


Visual Abstract

Abstract
177Lu-PSMA-617 (LuPSMA) is a newly established treatment for patients with metastatic castration-resistant prostate cancer (mCRPC), but survival outcomes vary widely, and predictors of treatment responses are needed. This study investigated the role of total tumor volumes (TTVs) and new lesions (NLs) determined by LuPSMA SPECT/CT in early cycles to predict subsequent outcomes in a real-world practice setting. Methods: Between June and December 2022, consecutive patients with mCRPC who received at least 2 administrations of LuPSMA with SPECT/CT 24 h after treatment were retrospectively reviewed. We evaluated associations between TTVs and the appearance of NLs at cycles 2 and 3 with subsequent prostate-specific antigen (PSA) progression-free survival and overall survival (OS) using multivariate Cox regression. All analyses were adjusted for changes in PSA level relative to baseline. Results: Sixty-six mCRPC patients (median age, 74 y) received a median of 4 (interquartile range, 3–5) cycles of LuPSMA. Median follow-up starting at cycle 2 was 42 wk (interquartile range, 33–48 wk), with 24 of 66 patients deceased at the time of the analysis. Changes in TTV measured at the start of cycles 2 and 3 relative to baseline correlated significantly with corresponding changes in PSA level (r = 0.55 and 0.56), but absolute TTVs did not correlate significantly (r = 0.00 and 0.18). Patients with a higher absolute TTV at the start of cycle 2 had worse PSA progression-free survival and OS (hazard ratio [HR], 1.4 [95% CI, 1.1–1.8] and 2.1 [95% CI, 1.5–2.9]), with consistent results at the start of cycle 3 (HR, 2 [95% CI, 1.4–2.9] and 2 [95% CI, 1.2–3.2]). NLs were identified in 13 of 66 and 11 of 51 patients at the start of cycles 2 and 3. NLs at the start of cycle 2 were associated with worse OS (HR, 5.8 [95% CI, 1.9–17.5]), with consistent results at the start of cycle 3 (HR, 4.9 [95% CI, 1.3–18.6]). In multivariate analysis, a higher TTV and the appearance of NLs at the start of cycles 2 and 3 were independently associated with poorer OS. Conclusion: Higher TTVs and NLs on LuPSMA SPECT/CT at the start of cycles 2 and 3 were independently associated with higher risk of death. These measures provided prognostic information independent of changes in PSA. Development of prognostic and predictive models including TTV, NLs, and PSA changes is warranted.
Metastatic castration-resistant prostate cancer (mCRPC) remains incurable even with multiple lines of systemic treatment (1–3). 177Lu-PSMA-617 (LuPSMA) is a U.S. Food and Drug Administration–approved treatment that delivers targeted β-radiation to prostate-specific membrane antigen (PSMA)–expressing tumors and extends the progression-free survival (PFS) and overall survival (OS) of patients with mCRPC (4). Although PSMA-avid disease identified by PSMA PET/CT was required at baseline in the VISION trial of LuPSMA, only 46% of patients achieved a reduction in their prostate-specific antigen (PSA) level of at least 50% relative to baseline (5). Given that LuPSMA is currently used as a very late line of treatment for most mCRPC patients, with many experiencing rapidly progressive disease, early predictors of response are desirable.
Treatment evaluation by PSMA PET/CT 12 wk after starting LuPSMA has been suggested as a promising response biomarker to predict OS (6). Notably, γ-radiation decay from LuPSMA allows SPECT/CT imaging that can quantify the radiopharmaceutical delivery to the tumor sites and normal organs and can be used to ascertain tumor volume, the resolution of previously identified lesions, or disease progression. Multiple studies have shown that changes in disease volume assessed at the start of cycle 2 or 3 on SPECT/CT are associated with PFS or OS (7–9). Further, biochemical response monitoring by PSA concentration is convenient, and early changes in PSA at those time points relative to baseline are associated with OS in patients with mCRPC receiving LuPSMA (10–12). However, the added value of response monitoring by SPECT/CT to changes in PSA, especially during the early course of treatment, is understudied in clinical practice.
In this study, we investigated relationships between SPECT/CT total tumor volumes (TTVs) and the appearance of new lesions (NLs) at the start of cycles 2 and 3, adjusted for changes in PSA level, with PSA PFS and OS. By evaluating the predictive potential of these biomarkers and evaluating the correlation between pretreatment PSMA PET/CT and SPECT/CT, this work may inform appropriate prognostic models for patients with mCRPC.
MATERIALS AND METHODS
Patient Population
This retrospective study examined consecutive patients with mCRPC referred for LuPSMA after progressing on the last systemic regimen. The patients received at least 2 administrations of LuPSMA at the Fred Hutchinson Cancer Center between June 15, 2022, and December 30, 2022. The date of last follow-up was September 20, 2023. The University of Washington Cancer Consortium institutional review board approved this retrospective study and waived the requirement for obtaining informed consent (STUDY00015507).
Treatment Scheme
The patients received up to 6 administrations of LuPSMA, each 7,400 MBq (200 mCi) ± 10%. Blood tests including PSA measurements were obtained every 3 wk after each administration. During each cycle, patients were clinically evaluated by a group of oncologists with expertise in prostate cancer management. At these evaluations, the disease state was monitored with multidisciplinary assessments involving oncologists and nuclear medicine physicians who evaluated evidence of disease progression and made decisions about continuing treatment. The results of SPECT/CT and all other interim imaging were available in the electronic medical record for clinicians.
Imaging Procedures and Analysis
The mean interval (±SD) between administration of LuPSMA and acquisition of SPECT/CT (base of the skull to mid thighs, 2 fields of view) was 24.2 ± 3.5 h. SPECT/CT was undertaken per institutional protocols with a Discovery 870 SPECT/CT system (GE HealthCare) (supplemental materials, available at http://jnm.snmjournals.org).
The SPECT/CT and pretreatment PSMA PET/CT scans were analyzed using a semiautomated whole-body tumor segmentation workflow using MIM software (MIM Software Inc.) to derive quantitative metrics of tumor burden. The workflow placed regions of interest on any tumor site with an SUVmax of greater than 3 and a lesion size of at least 0.5 cm3. Sites of physiologic activity that were not related to the disease were manually removed (Supplemental Fig. 1). TTV, SUVmax, and SUVmean were extracted from the segmented tumor volume. A 3-cm-diameter region of interest was used to calculate liver SUVmean within the lower portion of the right liver lobe.
Additionally, each SPECT/CT study was evaluated by an experienced nuclear medicine physician for NL assessment. New PSMA-avid lesions were defined as distinct NLs with uptake above background in a distribution consistent with metastatic prostate cancer. New non–PSMA-avid lesions were defined as distinct NLs on noncontrast CT that had uptake similar to or less than background. New sclerotic lesions on CT must not have had a corresponding PSMA-avid lesion on the baseline PSMA PET/CT study. Newly identified non–PSMA-avid soft-tissue lesions in the liver were verified through a follow-up diagnostic contrast-enhanced CT scan and bone scan for non–PSMA-avid bone lesions, whenever possible. Characteristics of these NLs were documented, including the number, involved site, and PSMA avidity.
Endpoints
PSA PFS was defined as the duration between the start of cycle 2 or 3 and a 25% increase in PSA compared with baseline or nadir starting at least 4 wk after the first administration of LuPSMA or death from any cause (13). OS was defined as the duration between the start of cycle 2 or cycle 3 and death from any cause.
Statistical Analysis
Preliminary examination of absolute levels and changes in PSA and TTV at the start of cycle 2 or 3 showed a significant correlation (using Spearman ρ) in all pairs except absolute TTV and change in PSA (Supplemental Fig. 2). Consequently, our TTV analysis used absolute levels adjusted for change in PSA, and our NL analysis similarly adjusted for change in PSA. Follow-up was calculated from the start of cycle 2 or 3 using reverse Kaplan–Meier estimation (14). Exploratory associations were visualized using Kaplan–Meier estimation stratified by median TTV at the start of cycle 2 or 3 or an indicator of NLs identified at the start of cycle 2 or 3 and evaluated using log-rank tests. Associations between absolute TTV or identification of NLs at the start of cycle 2 or 3 and PSA PFS and OS, adjusting for change in PSA measured at the corresponding cycle relative to baseline, were evaluated using multivariate Cox regressions.
RESULTS
This study comprised 82 consecutive patients with mCRPC who received LuPSMA. Of these, 66 and 51 patients were included in cycle 2 and 3 analysis, respectively (Fig. 1).

Consolidated Standards of Reporting Trials (CONSORT) diagram of study population.
Baseline Characteristics
The median age was 74 y (range, 51–91 y). All patients had at least one type of prior androgen deprivation therapy, and 61 of 66 (92%) patients had at least one chemotherapy regimen (Table 1). Exploratory univariate Cox regression models involving the previous number of chemotherapy regimens showed no statistically significant difference in OS (supplemental materials). The median number of LuPSMA cycles was 4 (interquartile range [IQR], 3–6).
Baseline Characteristics and Prior Treatments
Of the 66 participants, 47 (71%), 34 (52%), and 15 (23%) experienced any reduction, at least a 50% reduction, and at least a 90% reduction in PSA at any time during the treatment relative to baseline, respectively (Supplemental Fig. 3A). Of the patients, 48 (73%), 41 (62%), 31 (47%), and 13 (20%) had any reduction, at least a 20% reduction, at least a 50% reduction, and at least a 90% reduction in TTV, respectively, at any time during treatment (Supplemental Fig. 3B). Figure 2 depicts the temporal relationship between SPECT/CT findings and endpoints (Fig. 2).

Swimmer plot of time from start of therapy to PSA progression (orange bars) or to death from any cause or last follow-up, SPECT/CT, NLs, and increase in TTV by 20% or more.
Association Between SPETCT/CT Parameters and PSA
Changes in TTV measured at the start of cycles 2 and 3 relative to baseline correlated significantly with corresponding changes in PSA level (r = 0.55 and 0.56, P < 0.001), but absolute TTVs did not correlate significantly (r = 0.00 and 0.18) (Supplemental Fig. 2). Therefore, to evaluate the predictive value of TTV independently of PSA, we examined associations between absolute TTVs and the survival endpoints after adjusting for changes in PSA level.
Association Between TTVs at Start of Cycle 2 and Subsequent PSA PFS and OS
The median follow-up for the cycle 2 analysis was 42 wk (IQR, 33–48 wk). At the start of cycle 2, median changes in PSA and TTV were −14% (IQR, −47 to 36) and −17% (IQR, −44 to 8), respectively (Supplemental Table 1). The median PSA PFS was 24 wk (95% CI, 19–43 wk), and the median OS was 54 wk (95% CI, 45 wk to not reached). Exploratory analyses stratifying the patients on the basis of median TTV at the start of cycle 2 suggested an association between TTV and PSA PFS and OS (P = 0.02 and 0.009, respectively) (Figs. 3A and 3B). In Cox regressions adjusted for changes in PSA relative to baseline, the patients with higher absolute TTVs had worse PSA PFS and OS (hazard ratio [HR], 1.42 [P = 0.006] and 2.11 [P < 0.001], respectively) (Table 2).

Kaplan–Meier plots of PSA PFS at start of cycle 2 (A), OS at start of cycle 2 (B), PSA PFS at start of cycle 3 (C), and OS at start of cycle 3 (D). Curves are stratified by median TTV at start of cycle 2 or 3.
Results of Cox Regression Models
Association Between TTVs at Start of Cycle 3 and PSA PFS and OS
The median follow-up for the cycle 3 analysis was 36 wk (IQR, 27–41 wk). At the start of cycle 3, median changes in PSA and TTV were −47% (IQR, −79 to −1) and −44% (IQR, −75 to −6), respectively (Supplemental Table 1). The median PSA PFS was 23 wk (95% CI, 17 wk to not reached), and the median OS was 48 wk (95% CI, 42 wk to not reached). Exploratory analyses stratifying the patients on the basis of median TTV at the start of cycle 3 suggested an association between TTV and PSA PFS and OS (P < 0.001 and 0.02, respectively) (Figs. 3C and 3D). In Cox regressions adjusted for changes in PSA relative to baseline, the patients with higher absolute TTVs had worse PSA PFS and OS (HR, 1.99 [P < 0.001] and 1.98 [P = 0.005], respectively) (Table 2).
Association Between NLs at Start of Cycle 2 and PSA PFS and OS
NLs were identified in 13 of 66 (20%) patients at the start of cycle 2. The most common sites of NLs were bone (77%) and liver (54%), and across sites, 54% were PSMA-avid (Table 3). Twelve of 13 (92%) patients with NLs had a rise in PSA. Ten of 13 (77%) patients with NLs had an increase in TTV, of whom 7 of 13 (54%) had at least a 20% increase in TTV (Figs. 4A and 4B).
Characteristics of NLs

Waterfall plots of change in PSA at start of cycle 2 (A), change in TTV at start of cycle 2 (B), change in PSA at start of cycle 3 (C), and change in TTV at start of cycle 3 (D). Bars are color-coded by identification of NLs, and changes are truncated beyond 100% (*). Gray bar in panel C shows patient with evaluable PSA but no available SPECT/CT.
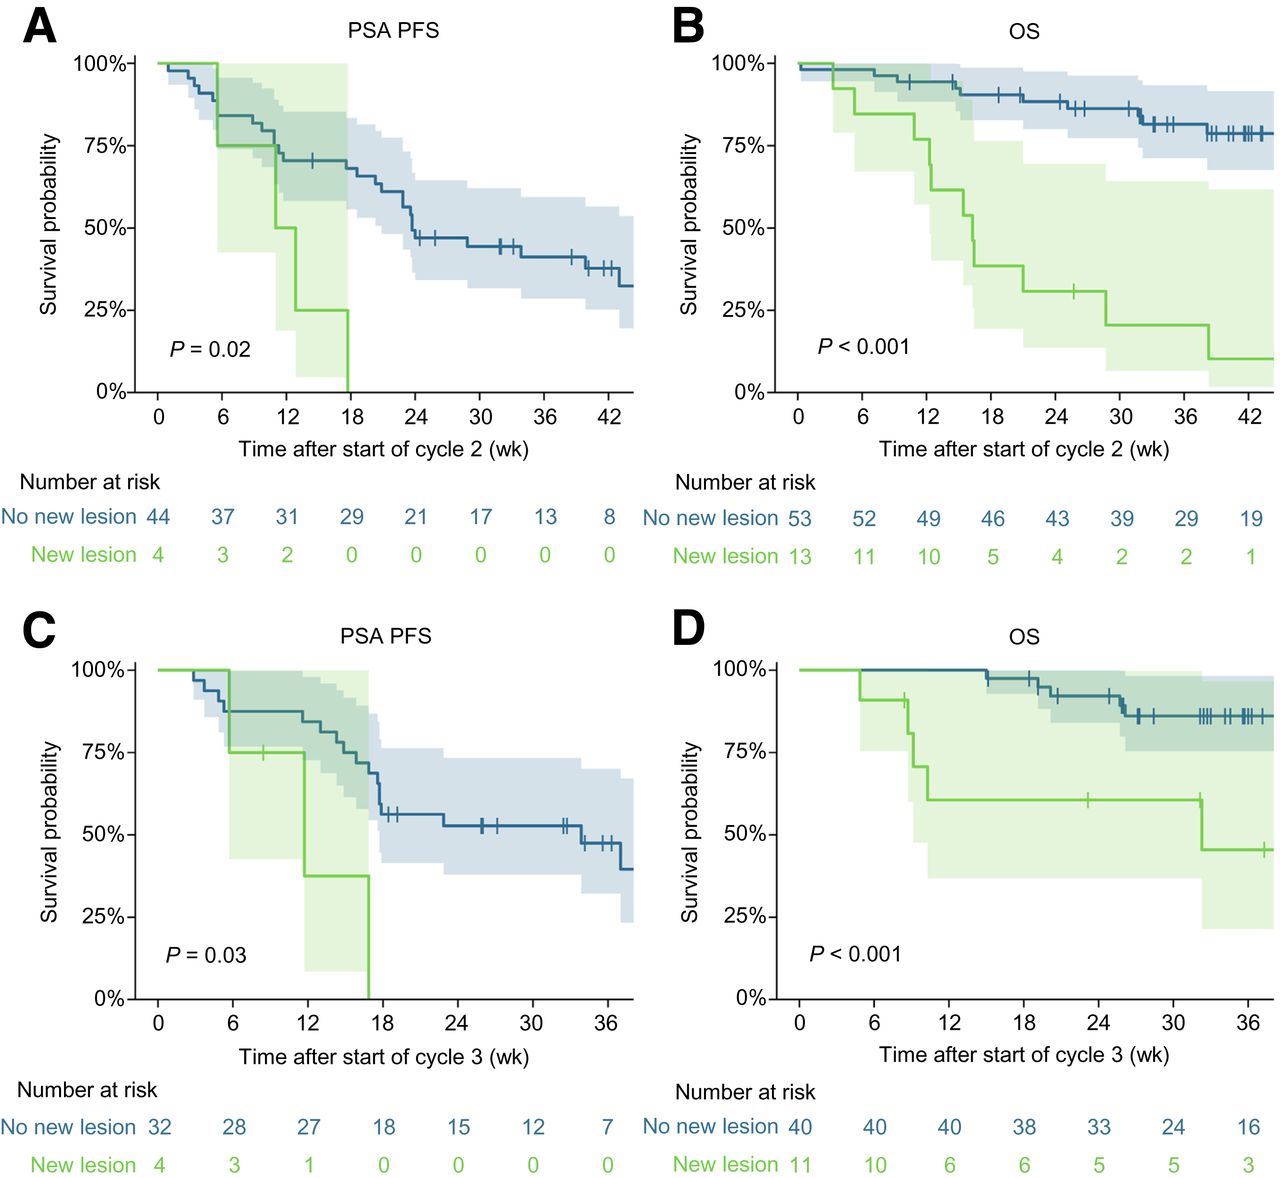
Exploratory analysis suggested an association between NLs and PSA PFS and OS (P = 0.02 and P < 0.001, respectively) (Figs. 5A and 5B). In Cox regression adjusted for change in PSA, patients with NLs had worse OS (HR, 5.81 [P = 0.002]), but no statistically significant difference was observed in PSA PFS (P = 0.10) (Table 2).

Kaplan–Meier plots of PSA PFS at start of cycle 2 (A), OS at start of cycle 2 (B), PSA PFS at start of cycle 3 (C), and OS at start of cycle 3 (D).
Associations Between NLs at Start of Cycle 3 and PSA PFS and OS
NLs were identified in 11 of 51 (22%) patients at cycle 3, of whom 7 were not previously identified at cycle 2. The remaining 4 patients developed NLs at cycle 2, with additional NLs at cycle 3. The most common sites were again bone (64%) and liver (45%), and across sites, 73% were PSMA-avid (Table 3). Overall, 6 of 11 (55%) patients with NLs had a rise in PSA and 7 of 11 (64%) patients with NLs had an increase in TTV, of whom 5 of 11 (46%) had at least a 20% increase in TTV (Fig. 4C and 4D). Exploratory analysis suggested an association between NLs and PSA PFS and OS (P = 0.03 and P < 0.001, respectively) (Figs. 5C and 5D). In Cox regression adjusted for change in PSA, patients with NLs had worse OS (HR, 4.92 [P = 0.019]), but no statistically significant difference was observed in PSA PFS (P = 0.087) (Table 2).
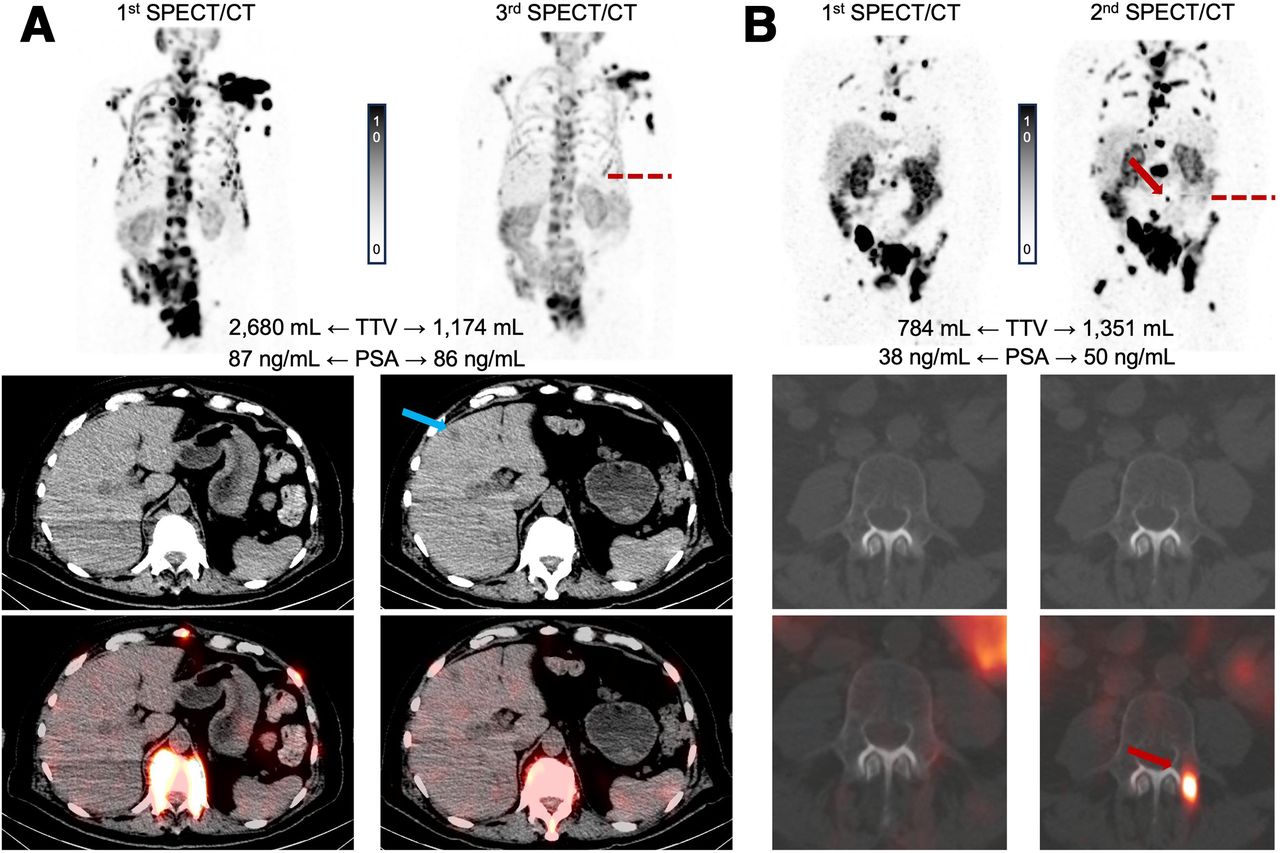
Of the 20 patients who developed NLs identified at the start of cycle 2 or 3 compared with baseline, 6 did not undergo confirmatory scans: 4 because of fast progression followed by their death soon after cycle 2 was administered, and 2 because they continued care at other centers and lacked confirmatory scans. Figure 6 shows examples of NLs.

Case examples of NLs in (from top to bottom) maximum-intensity projection, noncontrast CT, and SPECT/CT images. (A) Patient with new non–PSMA-avid liver lesion (blue arrow) at cycle 3 and decrease in TTV. (B) Patient with multiple new PSMA-avid bone lesions (red arrows) at cycle 2 and increase in TTV.
Multivariate Associations Between TTVs and NLs at Start of Cycles 2 and 3 and PSA PFS and OS
Multivariate analysis involving TTV and NLs after adjusting for change in PSA showed that a higher TTV was associated with a shorter PSA PFS and OS at cycle 2 or cycle 3. Similarly, NLs after adjusting for change in PSA were associated with worse OS at cycle 2 or cycle 3 (Table 2).
Correlation Between Pretreatment PSMA PET/CT and SPECT/CT Imaging Parameters at Start of Cycle 1
The median interval between pretreatment PSMA PET/CT and SPECT/CT at the start of cycle 1 was 34 d (IQR, 20–52 d). TTV and TTV SUVmean were significantly correlated between pretreatment PSMA PET/CT and SPECT/CT (r = 0.90 [95% CI, 0.84–0.94] and 0.72 [95% CI, 0.58–0.82], respectively). Similarly, the ratio of TTV SUVmean to liver SUVmean showed a substantial correlation (r = 0.70 [95% CI, 0.55–0.80]) (Supplemental Table 2; Supplemental Fig. 4).
DISCUSSION
LuPSMA is an effective and safe treatment for patients with mCRPC, yet response rates and response durations are limited. Although PSA is commonly used for early response assessment, PSMA imaging may provide a more specific measure of treatment efficacy considering the mechanism of action of LuPSMA. Further, at this late stage of the disease, early predictors of response and progression are desired for a timely change in management given the relatively short survival of the patients. Initially, we found a substantial correlation between PSA change and SPECT TTV change but a minimal correlation between PSA change and absolute TTV in early cycles. Consequently, we examined absolute TTV, which potentially contained predictive value independent of PSA change. This study found that, for a given PSA change relative to baseline, a higher absolute TTV and the appearance of NLs at the start of cycles 2 and 3 are independently associated with shorter OS.
Recent studies proposed SPECT/CT as a potential response assessment tool. In the LuPIN trial, which included 32 men who received LuPSMA and underwent SPECT/CT 24 h after treatment, Pathmanandavel et al. found that any increase in TTV at the start of cycle 3 compared with baseline was associated with shorter PFS (7). In a retrospective study of 96 men who underwent SPECT/CT 24 h after cycles 1 and 2 of treatment with 177Lu-PSMA I&T, John et al. showed that any increase in TTV at the start of cycle 2 compared with baseline was also associated with shorter PFS but not OS (8). None of these studies adjusted their analysis for corresponding PSA changes. In an observational study of 73 men with SPECT/CT 48 h after cycles 1 and 2 of 177Lu-PSMA I&T, Neubauer et al. found that stable or decreased TTV at the start of cycle 2 compared with baseline was associated with longer OS (9). Additionally, they showed that combining TTV and PSA changes results in an improved prognostic value for OS. Our findings support the utility of SPECT/CT TTV as a potential imaging prognostic biomarker independent of PSA in patients treated with LuPSMA.
Gafita et al. investigated the role of a 12-wk interim PSMA PET/CT scan for response assessment and outcome prediction and proposed response assessment criteria (6). Response Evaluation Criteria in PSMA PET/CT (RECIP 1.0) introduced the appearance of NLs as a criterion in progression assessment but also required a simultaneous TTV increase of at least 20%. In this study, NLs were identified primarily in bone (17/24) and liver (12/24) and could be both PSMA-avid (15/24) and nonavid (9/24). We found that the appearance of NLs was associated with shorter OS regardless of absolute TTV or changes in PSA. This may be of particular clinical importance since substantial proportions of these NLs exhibited low or no PSMA expression and hence may not be optimally targeted by LuPSMA. Even though SPECT/CT inherently involves noncontrast CT scans, these scans provide valuable information for NL assessment when thoroughly interrogated. Furthermore, the distinct implications of different NL types, such as bone versus liver or PSMA-avid versus non–PSMA-avid lesions, warrant further investigation.
Pathmanandavel et al. compared the TTVs quantitated using baseline SPECT/CT and pretreatment PSMA PET/CT in the LuPIN trial and found a strong correlation between the 2 modalities (r = 0.87 [95% CI, 0.74–0.93], P < 0.001) (7). Our study yielded similar findings (r = 0.90 [95% CI, 0.84–0.94], P < 0.001), suggesting that the 2 modalities provide consistent quantification metrics with likely similar predictive and prognostic value.
Although there have been significant advances in automated tumor segmentation, the current workflows still require user input to evaluate physiologic and nonmalignant uptake. Further, the required software may not commonly be available in all centers. Technical variations including differences between SPECT cameras, imaging protocols, and reconstruction parameters may also affect quantitative assessments (15). Multicenter studies using cross-calibrated imaging systems, harmonized imaging protocols, and software are needed to validate the reproducibility of SPECT/CT quantitative parameters. In a study by Gafita et al., qualitatively assessed RECIP demonstrated excellent agreement with quantitative RECIP, with excellent interreader agreement for interim PSMA PET/CT at 12 wk after treatment initiation (16). Further research is needed to better understand how to adopt PET/CT visual response criteria to SPECT/CT.
This study was subject to several limitations. Its retrospective nature inevitably led to missing data and prevented the application of standard radiologic progression criteria. Standardized LuPSMA cycle durations of 6 wk were not followed in certain patients because of sporadic radiopharmaceutical availability, treatment toxicity, or a treatment holiday after a deep response. Given the low number of patients, there was limited power to detect differences in outcomes between some subgroups, such as patients with new PSMA-avid versus non–PSMA-avid lesions (supplemental materials). The differing biology of the NLs may carry distinct implications for outcomes and, consequently, treatment strategies, and further investigation in a larger patient population may be warranted. The pretreatment clinical factors and imaging features were not included in the multivariable analysis, as the purpose of this study was to risk-stratify patients during treatment using SPECT/CT and evaluate its additional value to PSA monitoring. Future studies combining pretreatment characteristics and on-treatment information are of interest. Finally, since SPECT/CT reports were available in electronic medical records to the clinicians, these may have been incorporated into clinical decision making concerning whether to continue the treatment. However, the impact is likely low given that many patients received this treatment as the last line and most continued treatment unless there was clear clinical progression. Despite these limitations, this study supports previous findings and highlights the added value of SPECT/CT as a response biomarker in addition to PSA in early cycles of treatment.
CONCLUSION
This study showed that TTV and NLs on SPECT/CT early during treatment at the start of cycle 2 or 3 of LuPSMA provide independent prognostic information even after adjustment for changes in PSA level. Additional research is needed to evaluate the clinical utility of a dynamic treatment strategy that incorporates these parameters and informs decisions about continuing versus changing or discontinuing treatment. For instance, patients with a higher volume of disease at the start of cycle 2 may require more intensive treatment, including a higher administered activity, more frequent dosing, or treatment with α-radiopharmaceutical therapy, whereas patients with development of new disease that has no or low PSMA expression may require combination therapy with other systemic treatments or targeted therapy to limited areas of disease.
DISCLOSURE
This work was partly supported by an ACR FCRI grant and by Pacific Northwest Prostate Cancer SPORE. Michael Haffner served as a paid consultant or received honoraria from Pfizer and has received research funding from Merck, Novartis, Genentech, Promicell, and Bristol Myers Squibb. The following grants, which are not directly related to this study, were acknowledged by the authors: R37CA286450 (Michael Haffner); P30CA015704, P50CA097186, and R01CA280056-01A1 (Peter Nelson); and P50CA097186, R50CA22183, and R35CA274442 (Roman Gulati). Amir Iravani served as a consultant for Curium Pharma, Ambrx, and ITM. No other potential conflict of interest relevant to this article was reported.
KEY POINTS
QUESTION: What is the added value of TTV quantitation and NL assessment using SPECT/CT over changes in PSA level in patients treated with LuPSMA for mCRPC?
PERTINENT FINDINGS: This retrospective study showed that patients with a higher TTV or NLs on SPECT/CT at the start of cycle 2 or 3 had a shorter OS after controlling for observed changes in PSA level.
IMPLICATIONS FOR PATIENT CARE: SPECT/CT TTV and the appearance of NLs are independent prognostic imaging biomarkers and should be used in risk stratification and clinical decision-making for patients receiving LuPSMA.
ACKNOWLEDGMENT
We thank all staff at the nuclear medicine and medical oncology departments for caring for prostate cancer patients at the University of Washington and Fred Hutchinson Cancer Center.
Footnotes
Published online Nov. 7, 2024.
- © 2024 by the Society of Nuclear Medicine and Molecular Imaging.
REFERENCES
- Received for publication February 26, 2024.
- Accepted for publication October 15, 2024.
In this issue


Jump to section
Related Articles
Cited By...
- No citing articles found.