


Visual Abstract

Abstract
We propose strongly unrealistic data augmentation to improve the robustness of convolutional neural networks (CNNs) for automatic classification of dopamine transporter SPECT against the variability between sites and between cameras. Methods: A CNN was trained on a homogeneous dataset comprising 1,100 123I-labeled 2β-carbomethoxy-3β-(4-iodophenyl)-N-(3-fluoropropyl)nortropane SPECT images using strongly unrealistic data augmentation based on gaussian blurring and additive noise. Strongly unrealistic data augmentation was compared with no augmentation and intensity-based nnU-Net augmentation on 2 independent datasets with lower (n = 645) and considerably higher (n = 640) spatial resolution. Results: The CNN trained with strongly unrealistic augmentation achieved an overall accuracy of 0.989 (95% CI, 0.978–0.996) and 0.975 (95% CI, 0.960–0.986) in the independent test datasets, which was better than that without (0.960, 95% CI, 0.942–0.974; 0.953, 95% CI, 0.934–0.968) and with nnU-Net augmentation (0.972, 95% CI, 0.956–0.983; 0.950, 95% CI, 0.930–0.966) (all McNemar P < 0.001). Conclusion: Strongly unrealistic data augmentation results in better generalization of CNN-based classification of 123I-labeled 2β-carbomethoxy-3β-(4-iodophenyl)-N-(3-fluoropropyl)nortropane SPECT images to unseen acquisition settings. We hypothesize that this can be transferred to other nuclear imaging applications.
Convolutional neural networks (CNNs) outperform conventional methods in many medical imaging tasks (1). However, CNN-based methods, too, are sensitive to the variability of image characteristics (dataset shift) between sites and between cameras. Thus, a CNN generally performs best when the unseen data have been acquired with the same camera and the same acquisition and reconstruction protocol as its training dataset. This limits sharing of trained CNNs between sites. CNN robustness can be improved using large heterogeneous training datasets covering the whole range of image characteristics that may be expected in practice (2). However, collecting and labeling large and heterogeneous datasets are expensive.
Here, we propose strongly unrealistic data augmentation to improve the robustness of CNN-based binary classification of dopamine transporter (DAT) SPECT against a dataset shift.
MATERIALS AND METHODS
Datasets
Three datasets with a total of 3,025 DAT SPECT scans were used (Table 1). The first dataset (development dataset) comprised 1,740 consecutive clinical 123I-labeled 2β-carbomethoxy-3β-(4-iodophenyl)-N-(3-fluoropropyl)nortropane ([123I]FP-CIT) SPECT images (3). All images were reconstructed retrospectively using the same reconstruction algorithm, resulting in a rather homogeneous dataset. The second dataset comprised 645 [123I]FP-CIT SPECT images from the Parkinson Progression Markers Initiative (PPMI) (www.ppmi-info.org/data) (2). The third dataset comprised 640 consecutive clinical [123I]FP-CIT SPECT images acquired with brain-specific multiple-pinhole (MPH) collimators (4).
Datasets
Preprocessing of the DAT SPECT images comprised applying spatial normalization, using intensity scaling to obtain distribution volume ratio images, and then averaging six 2-mm-thick transversal slices through the striatum to obtain a 12-mm-thick slab image (4). The 2-dimensional slabs served as input to the CNN.
More details are given in the “Datasets” and “Image Preprocessing” sections in the supplemental materials and in Supplemental Table 1 (supplemental materials are available at http://jnm.snmjournals.org) (5–7).
Image characteristics differed between the datasets (Fig. 1): compared with the development dataset, the PPMI dataset was characterized by lower spatial resolution (resulting in lower striatum-to-background contrast), and the MPH dataset showed considerably better spatial resolution (higher striatum-to-background contrast) and less statistical noise.

Two-dimensional 12-mm slabs representative of normal (top) and reduced (bottom) DAT SPECT characteristics in 3 included datasets.
The development dataset was randomly split into 1,100 DAT SPECT images for CNN training and 640 images for testing. PPMI and MPH data were used for testing only.
The ethics review board of the general medical council of the state of Hamburg, Germany, approved the retrospective analysis of anonymized data and granted a waiver of written informed consent.
CNN
A custom residual network with 1, 1, and 2 blocks and 16, 32, and 64 filters per stage was used. The downsampling ratio was set to 3. The residual blocks consisted of 2 convolution-batch normalization leaky rectified linear unit pairs initialized with the He initializer. The final block was followed by a linear layer, max pooling, and the sigmoid function.
Training was performed in a 5-fold cross-validation manner to reduce the impact of randomness associated with weight initialization, batch sampling, and augmentation. The final predictions were obtained using the majority vote across the 5 CNNs. In the following, CNN is used to denote the ensemble of 5 CNNs to simplify notation.
Data augmentation was performed on the fly. Unrealistic augmentation was compared with augmentation according to the nnU-Net framework (8) and with no augmentation. nnU-Net augmentation was restricted to its intensity transformations; spatial transformations were not used. nnU-Net augmentation, specifically designed for the segmentation of organs or lesions, is increasingly used also for other image-analysis tasks. The same cross-validation folds were used for each augmentation method.
All networks were trained for 50,000 batches of size 12 (6 normal and 6 reduced) with a weight decay of 3 × 10⁻⁵, a standard stochastic gradient descent optimizer with Nesterov momentum of 0.9, and a linear warm-up followed by a cosine learning rate schedule with a maximum of 3 × 10⁻⁴. All networks reached convergence during the training. Early stopping was not applied. Overall accuracy was used as a performance metric.
Unrealistic Data Augmentation Framework
Data augmentation was restricted to the combination of 2 intensity-based operations on the 2-dimensional slabs in the training dataset, that is, gaussian blurring followed by additive gaussian noise:
The blurring term, (M · FWHMblurr) ⊗ slab, indicates convolution of the slab with a 2-dimensional gaussian kernel with full width at half maximum (FWHM) given by M · FWHMblurr. The variable FWHMblurr was randomly selected between 1 and 6 mm. The hyperparameter (M) was introduced to vary this interval between different experiments (M = 0.5, 0.75, 1.0, 1.5, 2.0, 2.5, 3.0). For example, when M is 2.5, the FHWMblurr was randomly selected between 2.5 and 15 mm.
For the additive error, standard normal distributed noise R was first smoothed with a gaussian kernel with a full width at half maximum FWHMnoise selected randomly between 5 and 15 mm and then rescaled to pixelwise standard deviation as M·SD. SD was randomly selected between 0.1σ and 0.25σ, where σ represents the standard deviation of the distribution volume ratio across all pixels. Again, M was used to vary this interval between different experiments. Thus, in each experiment, the FWHM interval and the SD interval were stretched or compressed by the same factor M to reduce the number of hyperparameters (9).
Values of a for blurring and noise are the binary random variables that determine whether an operation is applied (a = 1) or not (a = 0). They were drawn independently from the same Bernoulli distribution. The probability (P) of the Bernoulli distribution to provide an a of 1 was varied between experiments (P = 0.25, 0.33, 0.5, 0.75, 0.9, 1.0).
In summary, data augmentation was controlled by 2 hyperparameters: M and P. All combinations of M and P were tested, resulting in a 7 × 6 (M, P) search grid to optimize data augmentation.
Figure 2 illustrates the proposed data augmentation. It is unrealistic in several respects. First, the ordering of the 2 operations can result in a high-frequency noise typically not encountered in practice. In reality, high-frequency noise of the projection data is suppressed during reconstruction. Second, the additive noise is independent of the pixel intensity; that is, the noise level (in absolute terms) is the same in striatal and extrastriatal pixels (including cerebrospinal fluid). More realistic statistical noise is proportional to the square root of the pixel intensity, resulting in smaller (in absolute terms) noise in extrastriatal pixels than in striatal pixels. Thus, the additive model overestimates the statistical noise in extrastriatal regions relative to the striatum. Finally, for large M values, the operations can be unrealistically strong (Fig. 2).

Left: blurring and additive noise by unrealistic data augmentation with M = 2.5 illustrated in single normal DAT SPECT image (FWHMnoise fixed at 5 mm). There is dramatic decrease in image quality toward top-right corner. Green frame marks transformations that might be considered realistic. Right: 30 random instances of intensity-based nnU-Net augmentation applied to same DAT SPECT. All appear realistic.
Further details of the algorithm development according to the Society of Nuclear Medicine and Molecular Imaging AI Task Force checklist are given in the supplemental materials (10).
RESULTS
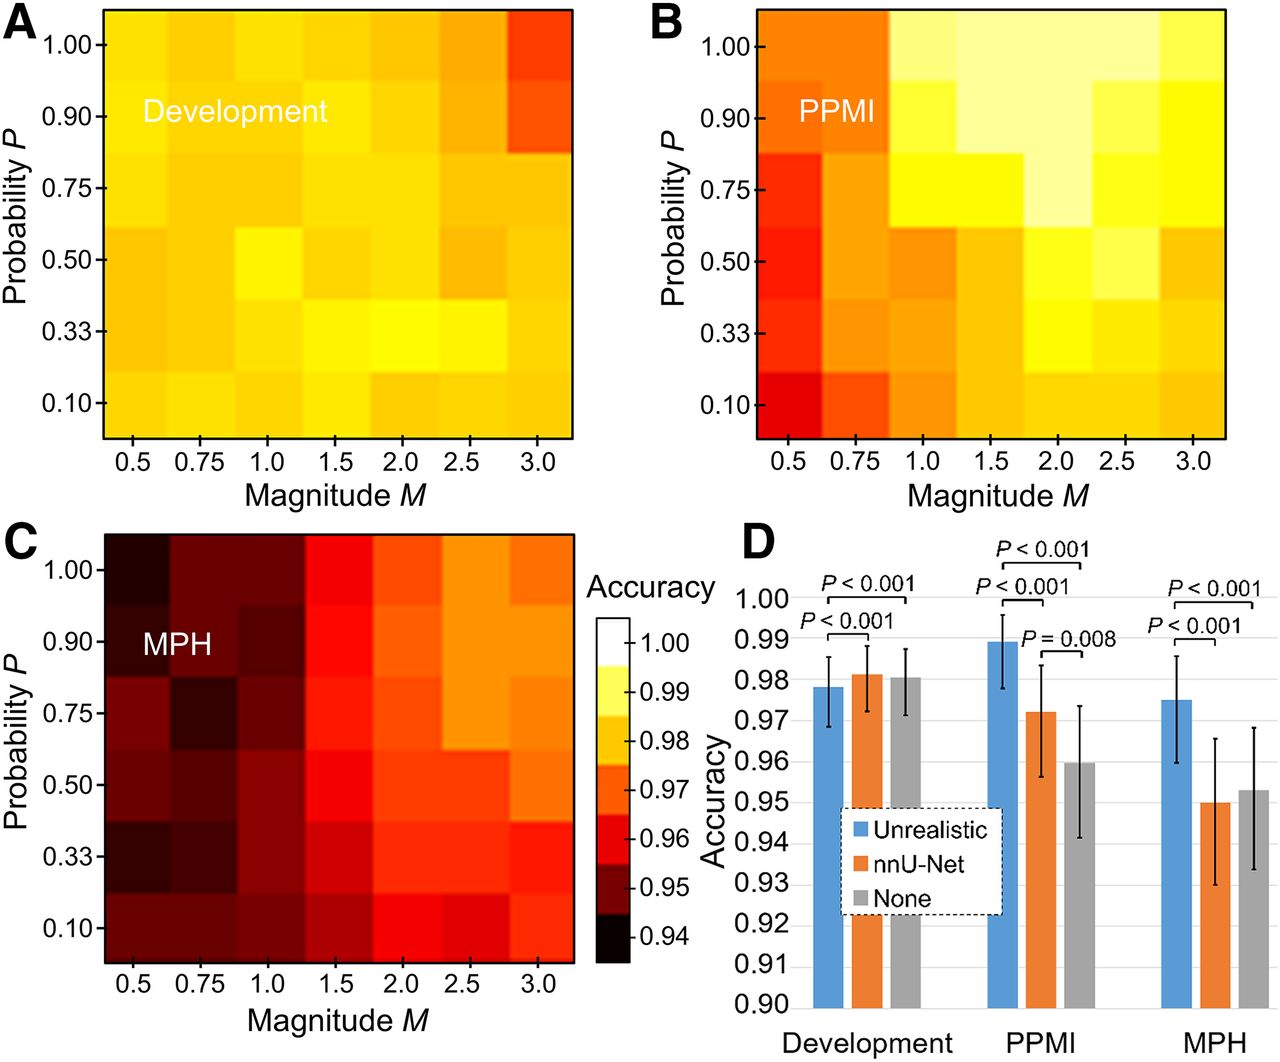
Figures 3A–3C show the overall accuracy of the CNN trained with unrealistic data augmentation across the (M, P) grid. Although the unrealistic augmentation did not affect the performance of the CNN in the test subsample from the development dataset, except for some performance loss at extreme hyperparameter values (M = 3.0, P ≥ 0.90), it resulted in improved performance in the 2 independent test datasets (PPMI and MPH). For both, the best performance was achieved at an M of about 2.5 and a P of 0.90, that is, for augmentation with high probability P and high magnitude M, just before the performance in the development dataset started to degrade. Figure 3D and Supplemental Figure 1 compare optimal unrealistic data augmentation (M = 2.5, P = 0.90) with intensity-based nnU-Net augmentation and no augmentation.

CNN performance with unrealistic data augmentation. (A–C) Heat maps of overall accuracy across (M, P) grid in development (A), PPMI (B), and MPH dataset (C). (D) Overall accuracy with optimal unrealistic augmentation (M = 2.5, P = 0.9) compared with no data augmentation and intensity-based nnU-Net augmentation. Error bars represent 95% CIs. P values are according to McNemar test. Sensitivity and specificity are shown in Supplemental Figure 1.
DISCUSSION
Data augmentation is often thought of as a method to create additional realistic training cases to avoid overfitting that would degrade CNN performance in unseen images with known image characteristics, particularly when the number of real training cases is small. Recent research suggests that data augmentation has the potential to improve the network’s generalization performance, that is, its accuracy in unseen cases with different image characteristics from other sources (9). This led us to hypothesize that generalization performance of a CNN-based DAT SPECT classification might be improved by strongly unrealistic data augmentation, particularly by unrealistically strong intensity-based transformations that corrupt irrelevant features in the images (e.g., extracranial signal that might vary between datasets). This was the rationale for restricting the proposed augmentation framework to gaussian blurring and additive gaussian noise. Spatial transformations (rotation, translation, mirroring) change the localization and orientation of such features but do not corrupt them.
The hypothesis was supported by the finding that the proposed augmentation framework resulted in the most robust classification performance across the test datasets when M and P were large, corresponding to unrealistically strong variation of regional image intensity distributions.
The PPMI dataset featured a lower spatial resolution than did the development dataset. Thus, spatial smoothing during unrealistic data augmentation generated training cases that better resembled the PPMI images. Improved performance in this dataset, therefore, might be explained by harmonization regarding spatial resolution. However, the unrealistic data augmentation improved the CNN performance also in the MPH dataset with considerably better spatial resolution. Gaussian smoothing during data augmentation increased the mean distance between training data and MPH data. Thus, harmonization of image characteristics is not very likely to be the mechanism underlying the improved generalization performance by unrealistic data augmentation. We hypothesize that the benefit is due to corruption of irrelevant image features that prevents the CNN from learning these (“Impact of Extracranial Signals on CNN Performance” section in the supplemental materials; Supplemental Figs. 2–5). It requires that the relevant features are relatively preserved by the unrealistic transformations. This can be fulfilled in DAT SPECT, since the normal striatal signal is much stronger than extrastriatal signals. However, the relevant signal, disease-related regional reduction or increase of tracer uptake, is stronger than nonrelevant signals in many nuclear imaging applications. We therefore hypothesize that unrealistic data augmentation can improve the generalization performance of deep learning–based methods in other nuclear imaging tasks. The hyperparameters for unrealistic data augmentation should be optimized carefully for each technique to avoid corruption of relevant features. The fact that the optimal hyperparameters were about the same for both external test datasets in the current study, despite strong differences in image characteristics, suggests that a single external test dataset (with clearly different image characteristics from the training dataset) is sufficient to optimize the hyperparameters for improved CNN generalization performance.
Unrealistic augmentation may lessen the requirements on size and heterogeneity of training datasets. However, large and heterogeneous datasets are to be favored but are often expensive to collect and label. Furthermore, unrealistic data augmentation is easier and less risky than the simulation of realistic images. The latter can result in invisible (for human readers) artificial patterns that differ between classes and, therefore, can lead to hidden bias in CNNs.
In the test cases from the development dataset (with the same image characteristics as the training cases), unrealistic data augmentation resulted in a 0.3% loss of overall accuracy compared with nnU-Net augmentation. The improvement in accuracy in the independent test datasets was considerably larger (1.7%–2.9%). Whether a small performance loss in the classification of DAT SPECT images with known image characteristics is acceptable to avoid a considerably larger loss in cases with unseen image characteristics depends on the setting.
CONCLUSION
We believe that the current findings are relevant not only for clinical practice but also for research: they suggest that data augmentation should be understood as a powerful regularization technique rather than just a data-enrichment tool.
DISCLOSURE
Data used in the preparation of this article were obtained from the PPMI database (www.ppmi-info.org/access-data-specimens/download-data). No other potential conflict of interest relevant to this work was reported.
KEY POINTS
QUESTION: Can data augmentation be used to improve the robustness of CNN-based classification of DAT SPECT against variability of image characteristics between sites and between cameras?
PERTINENT FINDINGS: Strongly unrealistic data augmentation based on gaussian blurring and additive noise improved the performance of CNN-based classification of unseen DAT SPECT images with different image characteristics compared with intensity-based nnU-Net augmentation.
IMPLICATIONS FOR PATIENT CARE: Strongly unrealistic data augmentation results in better generalization of CNN-based classification of [123I]FP-CIT SPECT to unseen acquisition settings. We hypothesize that this can be transferred to other nuclear imaging applications.
Footnotes
Published online Jul. 25, 2024.
- © 2024 by the Society of Nuclear Medicine and Molecular Imaging.
REFERENCES
- Received for publication February 5, 2024.
- Accepted for publication May 29, 2024.
In this issue


Jump to section
Related Articles
Cited By...
- No citing articles found.