


Visual Abstract

Abstract
Our aim was to investigate probable biomarkers specific to immune-related central nervous system toxicity (CNST) in cancer patients treated with immune checkpoint inhibitors (ICI) by analysis of 18F-FDG PET/CT images. Methods: Cancer patients receiving ICI treatment were enrolled in a multicenter observational study that analyzed regional metabolic changes before and during CNST onset from January 2020 to February 2022. In 1:1 propensity score–matched pairs, the regional SUVmean of each bilateral brain lobe of CNST patients (CNST+) was compared with that of patients who had central nervous system infections (CNSIs) and patients without CNST or CNSI (CNST−). In a validation cohort, patients were recruited from February 2022 to July 2023 and followed up for 24 wk after the start of ICI. Early changes in regional SUVmean at 5–6 wk after therapy initiation were evaluated for ability to predict later CNST onset. Results: Of 6,395 ICI-treated patients, 2,387 underwent prognostic 18F-FDG PET/CT and 125 of the scanned patients had CNST (median time from ICI treatment to onset, 9 wk; quartile range, 2–23 wk). Regional 18F-FDG PET/CT SUVmean changes were higher in CNST+ than in CNST− patients (117 patient pairs) but were lower than in CNSI patients (50 pairs). Differentiating analysis reached an area under the curve (AUC) of 0.83 (95% CI, 0.78–0.88) for CNST+ versus CNST− and of 0.80 (95% CI, 0.72–0.89) for CNST+ versus CNSI. Changes in SUVmean were also higher before CNST onset than for CNST− (60 pairs; AUC, 0.74; 95% CI, 0.66–0.83). In a validation cohort of 2,878 patients, preonset changes in SUVmean reached an AUC of 0.86 (95% CI, 0.79–0.94) in predicting later CNST incidence. Conclusion: Brain regional hypermetabolism could be detected during and before CNST clinical onset. CNST may be a distinct pathologic entity versus brain infections defined by 18F-FDG PET/CT brain scans. Regional SUV differences may be translated into early diagnostic tools based on moderate differentiating accuracy in our study.
- 18F-FDG PET/CT brain imaging
- immunotherapy
- immune-related CNS toxicity
- regional metabolism
- differential diagnosis
Immune checkpoint inhibitors (ICIs) have revolutionized the therapeutic landscape and significantly prolonged survival during the past decade, making ICI one of the primary therapies in nearly all types of cancer (1). ICIs inflict immune-related adverse events due to systemic T-cell activation, which can happen in any organ and have been reported to have an incidence of 10%–90% for any grade (2–4). However, immune-related adverse events in the central nervous system, or central nervous system toxicity (CNST), are less prevalent than in other organs, with an incidence of 1%–8% reported previously and fewer than 1% of cases being fatal (5,6). CNST has varieties of pathology types, including but not limited to immune-related meningitis, encephalitis, demyelinating encephalopathy, and central nervous system vasculitis (7). Although the exact pathoetiology is not thoroughly known, CNST is currently suggested to be induced by local inflammation from deranged immune attack (8).
CNST presents mostly with unspecific symptoms, including headaches (>50%), confusion, partial seizures, limb pain, and the meningeal irritation sign (9). Given the higher incidence of central nervous system infection (CNSI) in cancer patients and significant overlapping symptoms, CNST is usually diagnosed when other causes are excluded, including infection, brain hemorrhage, stroke, metabolic encephalopathy, and brain metastasis (10). Methods applied in clinical diagnosis involve traditional imaging protocols, cerebral spinal fluid analysis, and neurologic work-ups (10). According to the Consensus Statement of Neurologic Adverse Events, most suspected cases are given a possible diagnosis for further trial therapies because of the difficulty of making a definite diagnosis (8). Because of the unpredictable incidence of this severe complication during ICI treatment, which many patients may receive for years, the development of biomarkers for early diagnosis is crucial (11). However, efficient methods and predictable biomarkers for differential diagnosis are presently lacking, hindering subsequent management options.
18F-FDG PET/CT is a noninvasive imaging tool applied in diagnostic and prognostic protocols for cancer patients. Besides its utility in cancer management, the high sensitivity of 18F-FDG PET/CT imaging has long been well established for identifying inflammatory processes involving higher local metabolism (12). Anecdotal case reports of 18F-FDG PET/CT imaging analysis in evaluations of immune-related adverse events are being reported, but the characteristics of CNST have not been extensively reviewed (13). A pilot retrospective study of 58 melanoma patients identified metabolic biomarkers to delineate patients with or without immune-related adverse events in the lung, colon, and thyroid gland (14). Furthermore, 18F-FDG PET/CT imaging is capable of sensitively detecting local autoimmune attacks in cerebral regions and has been established as an alternative tool to diagnose autoimmune or paraneoplastic encephalitis (15,16). More direct evidence was found in a recent 18F-FDG PET/CT study of anti-LG1 protein autoimmune encephalitis, which is pathologically similar to CNST; biomarkers were identified that can signify disease course (17). Thus, we hypothesize that brain metabolism may be characteristic in patients with CNST (18,19).
Because of the low incidence of CNST, pivotal research on diagnostic biomarker identification for CNST has been statistically difficult to perform in underpowered sample sizes (20). Nevertheless, as ICIs are becoming more available in real-world settings, pilot multicenter analysis is encouraged to identify markers in the growing number of CNST cases. In the current study, we retrospectively reviewed cerebral metabolism in ICI-treated cancer patients, with the aim of obtaining preliminary evidence of diagnostic biomarkers for subclinical or syndromal CNST.
MATERIALS AND METHODS
Participants and Eligibility Criteria
We performed a multicenter, retrospective, case-control study to analyze early CNST-related metabolic changes in cerebral 18F-FDG PET/CT images of ICI-treated cancer patients, who were divided into a discovery cohort and a validation cohort. In the discovery cohort, cancer patients receiving ICI treatment were enrolled from January 2020 to February 2022, and in the validation cohort, patients were enrolled from February 2022 to July 2023. Demographic and clinical variables were recorded from chart review. The research setting was the nuclear medicine departments of 4 academic hospitals in China (supplemental materials, available at http://jnm.snmjournals.org) (21–28). The retrospective protocol of the study was approved by the institutional review board of the Affiliated Cancer Hospital of Shantou University Medical College. All procedure was performed according to the Helsinki Declaration. The participants had given written informed consent to use of clinical information for medical research. Reporting adhered to the Strengthening the Reporting of Observational Studies in Epidemiology checklist for cohort studies.
Chart review divided ICI-treated cancer patients into 3 groups: patients with CNST (CNST+ group), with CNSI (CNSI group), and without CNST or CNSI (CNST− group, defined as no CNST or CNSI for ≥5 mo after ICI treatment, as most patients developed CNST before 20 wk as previously described) (29). The diagnostic protocols for CNST were according to the Consensus Statement of Neurologic Adverse Events (the supplemental materials provide detailed criteria) (8). All symptoms related to diagnosis and excluding CNST followed Common Terminology Criteria for Adverse Events (version 5.0). The date of CNST diagnosis was identified by review of outpatient and inpatient charts.
Research Goals and Statistics
The research goals are illustrated in Figure 1A. We did 2 independent comparison analyses (between the CNST+ and CNST− groups and between the CNST+ and CNSI groups) to investigate the specificity of cerebral regional SUVmean in CNST+ patients. First, regional SUVmean changes was calculated and compared between the CNST+ group (calculated as the SUVmean difference between baseline and CNST onset) and the CNST− group (serving as a negative control comparison). Second, the SUVmean of subtype CNST was compared with the SUVmean of subtype CNSI (serving as a positive control comparison). For each step, a principal-component analysis and a neural network computation model were adopted to evaluate the differentiating ability of regional SUVmean in 18F-FDG PET/CT scans.

Research flowchart.
Third, for the CNST+ subgroup analysis, we queried whether there were early changes in brain metabolism before CNST symptoms started. To minimize the false-positive rate, subgroup analysis in the CNST+ group included only patients who underwent 18F-FDG PET/CT at least 4 wk before CNST onset (i.e., preonset). Changes in SUVmean from the baseline 18F-FDG PET/CT images to the preonset images in CNST+ patients were calculated and compared with changes in SUVmean in the CNST− group. If multiple images were present, only the earliest image was analyzed. A neural network computation model was adopted to evaluate the differentiating ability of regional SUVmean in 18F-FDG PET/CT scans. Last, in an independent validation cohort, preonset regional SUVmean changes at 5–6 wk after ICI initiation were evaluated in a real-world setting to determine whether they may predict the later incidence of CNST, and a nomogram was built to quantify the disease-free (CNST-free) survival probability. Statistical comparison, propensity score matching, and modeling details of the neural network computation are shown in the supplemental materials (22,23,27).
RESULTS
Demographics
The study on the discovery cohort included 6,395 patients who had ever received ICI therapy and 2,387 patients who had evaluable 18F-FDG PET/CT scans both at baseline and during ICI treatment. One hundred forty-nine patients had CNST (incidence, 2.3%), and 125 patients had evaluable 18F-FDG PET/CT scans (Fig. 1A). Briefly, there were 125 CNST+ patients in the imaging study (69.3% male), with a mean age of 59.71 y (SD, 10.21 y), spanning nearly all known cancer types and ICI types. Baseline information was substantially different from that in the CNST− group, and 1:1 propensity score matching (PSM) was performed for balancing. Of the 125 CNST+ patients, 117 were matched with 117 CNST− patients. Baseline information before and after propensity score matching is shown in Table 1. Additional details on CNST characteristics are shown in Supplemental Table 1. Blood glucose levels in comparable groups are shown in Supplemental Figure l, and representative images are shown in Supplemental Figure 2.
Baseline Variables Before and After Propensity Score Matching for CNST+ and CNST− Subtypes
Regional Uptake Values of CNST+ Compared with CNST− Patients
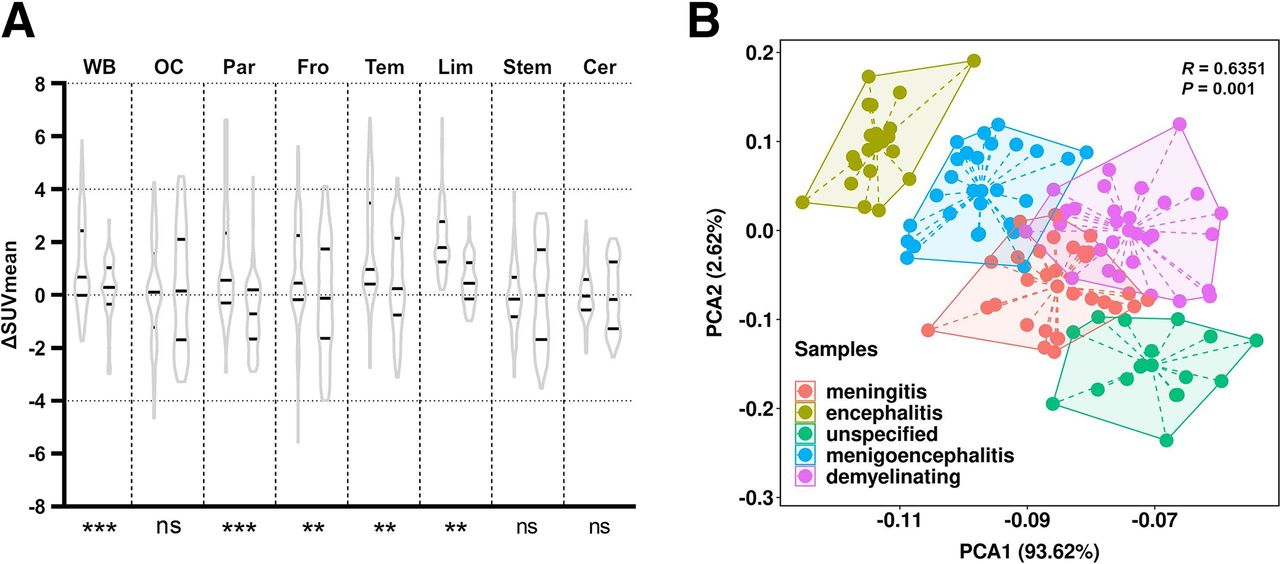
We first investigated metabolic changes in patients experiencing CNST in each brain region. By the Wilcoxon signed-rank test, there was a significant increase (P < 0.01) in SUVmean from baseline to CNST onset in all regions except the brain stem, occipital lobe, and cerebellum (Supplemental Fig. 3A, power of statistical tests reached >0.90 assuming a 2-sided α of 0.05). The median value of whole-brain SUVmean in the CNST− group did not significantly differ from baseline, but this statistical test was underpowered (P = 0.06; power, 0.31). We then compared changes in both groups in PSM pairs. Compared with CNST− patients, there were significantly more increases in SUVmean in each region of CNST+ patients except in the brain stem, occipital lobe, and cerebellum (Fig. 2A). Principal-component analysis indicated a relatively poor differentiating ability between the CNST+ and CNST− groups (R = 0.14, Supplemental Fig. 4A). However, the calculated differentiating ability from the neural network computation-based model showed an area under the curve (AUC) of 0.83 (95% CI, 0.78–0.88; Supplemental Fig. 4B). Principal-component analysis of CNST subtypes indicated an R of 0.64 (Fig. 2B).

Comparison analysis of regional uptake value changes with negative control. (A) Negative control comparison: changes in SUVmean from baseline to disease onset in CNST+ patients (left side of plot for each region) and changes in SUVmean from baseline to >5 mo after treatment in negative control (right side of plot for each region), matched by propensity scores. Black lines indicate median and range (first to third quartiles). Nonparametric Wilcoxon signed-rank test was performed to compare distribution. Significant difference in changes in SUVmean was seen between 2 groups in whole-brain area and in parietal, frontal, temporal, and limbic regions. (B) Principal-component analysis of 18F-FDG PET/CT radiomic uptake values to differentiate CNST subtypes in CNST+ patients (R = 0.64). Cer = cerebellum; fro = frontal lobe; lim = limbic area; ns = nonsignificant; OC = occipital lobe; par = parietal lobe; PCA = principal-component analysis; stem = brain stem; tem = temporal lobe; WB = whole brain. *P < 0.05. **P < 0.01. ***P < 0.001.
Regional Uptake Values of CNST+ Subtypes Compared with CNSI Subtypes
Clinical symptoms and imaging studies of CNST may mimic CNSI, and thus we tested the specificity of CNST regional uptake values by comparing CNST+ with PSM samples of CNSI subtypes: immune-related versus infectious meningitis, meningoencephalitis, and encephalitis. In total, 201 patients who had a diagnosis of CNSI were reviewed, 115 of whom had available 18F-FDG PET/CT images during CNSI onset. We adopted optimal matching for 3 subtypes between CNST+ and CNSI. Nearest-neighbor matching was adopted for other baseline variables. Finally, 50 pairs were matched from 3 subtypes of CNST+ and CNSI patients, including 19 pairs of meningitis, 17 pairs of meningoencephalitis, and 14 pairs of encephalitis, with baseline demographic details before and after PSM shown in Table 2. The regional SUVmean of the immune-related meningitis subtype was significantly lower than that of infectious meningitis in all regions of interest (Fig. 3A). In the meningoencephalitis subtype, regional values were also lower in CNST+ patients in nearly all regions, except for the brain stem and cerebellum (Fig. 3B). In the encephalitis subtype, a significantly lower SUVmean was seen in the whole brain and in the limbic area in CNST+ patients, although a higher SUVmean was seen in the parietal region of CNST+ patients (Fig. 3C). Principal-component analysis indicated a moderate to high ability to differentiate the 3 subtypes between CNST+ and CNSI (Figs. 3D–3F). Differential diagnostic tests of the neural network computation-based radiomic model indicated relatively good accuracy (AUC, 0.80; 95% CI, 0.72–0.89; Supplemental Fig. 5A).
Baseline Variables Before and After Propensity Score Matching for CNST+ and CNSI Subtypes

Comparison of regional uptake between CNSI and CNST subtypes. For each region, left side of plot is patients with infectious disease and right side is patients with immune-related disease. (A) SUVmean distribution plot in infectious meningitis patients and immune-related meningitis patients in each brain lobe. Black lines indicate median and range (first to third quartiles). Wilcoxon signed rank was performed to compare distribution of SUVmean between 2 subtypes. Significant difference in SUVmean was seen in all regions of interest. (B) SUVmean distribution plot in infectious meningoencephalitis patients and immune-related meningoencephalitis patients in each brain lobe. Black lines indicate median and range (first to third quartiles). Wilcoxon signed rank test was performed to compare distribution of SUVmean between 2 subtypes. Significant difference in SUVmean was seen in whole-brain area and in occipital, parietal, frontal, temporal, and limbic regions. (C) SUVmean distribution plot in infectious encephalitis patients and immune-related encephalitis patients in each brain lobe. Black lines indicate median and range (first to third quartiles). Wilcoxon signed rank test was performed to compare distribution of SUVmean between 2 subtypes. Significant difference in SUVmean was seen in whole-brain area and in parietal, brain stein, and limbic regions. Intergroup difference was seen in meningitis diagnosis (R = 0.84) and in encephalitis (R = 0.65). (D–F) PCA of 18F-FDG PET/CT radiomic uptake values to differentiate subtypes of meningitis (D), meningoencephalitis (E), and encephalitis (F). Intergroup difference in meningitis diagnosis (R = 0.84) and in encephalitis (R = 0.65). Cer = cerebellum; fro = frontal lobe; lim = limbic area; ns = nonsignificant; OC = occipital lobe; par = parietal lobe; PCA = principal-component analysis; stem = brain stem; tem = temporal lobe; WB = whole brain. *P < 0.05. **P < 0.01. ***P < 0.001.
Evaluating and Validating Preonset SUVmean Changes as Marker to Predict Later CNST Incidence
We next investigated whether changes in brain regional metabolism were present before CNST onset. Sixty patients with available preonset 18F-FDG PET/CT images were identified. The median time from ICI treatment to the earliest scanning was 12 wk (quartile range, 5.75–15.25 wk). The median time from the earliest scanning to CNST onset was 10 wk (quartile range, 8.75–14 wk).
Each regional SUVmean was compared with the baseline value in CNST+ patients. There was a significant increase (P < 0.01) in SUVmean as compared with baseline in all regions except the occipital lobe, brain stem, and cerebellum (Fig. 4A). The median SUVmean increased from 4.83 to 4.88 in the whole brain, from 3.81 to 4.48 in the parietal lobe, from 4.30 to 4.44 in the frontal lobe, from 4.31 to 4.81 in the temporal lobe, from 3.84 to 4.52 in the limbic area, and from 4.92 to 5.04 in the cerebellum. These changes were validated in PSM samples (60 pairs) between CNST+ and CNST− patients. Changes in SUVmean were significantly higher in CNST+ patients than in CNST− patients in the whole brain, frontal lobe, temporal lobe, and limbic area (Fig. 4B). The differentiating ability between CNST+ and CNST− patients was evaluated using ROC curve analysis, with an AUC of 0.74 (Supplemental Fig. 6B), and a nomogram was drawn to quantify the risk of future CNST (Supplemental Fig. 6A).

Comparison of regional uptake value changes before CNST onset. (A) Self-control comparison: SUVmean distribution plot in CNST+ patients at baseline (before treatment, left side of plot for each region) and before CNST onset (right side of plot for each region) in each lobe. Black lines indicate median and range (first to third quartiles). SUVmean in each region did not conform to normal distribution, and nonparametric Wilcoxon signed-rank test was performed to compare distribution at baseline and after CNST. Significant increases were seen in whole-brain area and in parietal, frontal, temporal, and limbic regions, and significant decreases were seen in cerebellum (z = −3.50, −0.49, −3.51, −3.59, −6.73, −5.54, −0.45, and −3.72, respectively, for rank differences in each comparison). (B) Negative control comparison: changes in SUVmean from baseline to preonset scan in CNST+ patients (left side of plot for each region) and changes in SUVmean from baseline to <5 mo after treatment in negative control (right side of plot for each region), matched by propensity scores. Black lines indicate median and range (first to third quartiles). Values did not conform to normal distribution, and nonparametric Wilcoxon signed-rank test was performed to compare distribution of changes in SUVmean between 2 groups. Significant difference in changes in SUVmean was seen in whole-brain area and in temporal, frontal, and limbic regions (z = −3.69, −0.75, −1.39, −2.41, −6.61, −4.42, −0.25, and −0.36, respectively, for rank differences in each comparison). (C) 18F-FDG PET/CT radiomic monogram in validation cohort using early changes (5–6 wk after treatment initiation) of regional uptake values. Specifically, changes in SUVmean, as compared with baseline SUVmean, can be projected to point ruler. Total scores were added to obtain 24-wk disease-free survival probability. (D) Predicted future CNST risk vs. actual CNST risk in validation cohort, plotted as receiver-operating-characteristic curves. Cer = cerebellum; DFS = disease-free survival; fro and front = frontal lobe; lim = limbic area; ns = nonsignificant; OC and OCC = occipital lobe; par = parietal lobe; stem = brain stem; tem = temporal lobe; WB = whole brain. *P < 0.05. **P < 0.01. ***P < 0.001.
In the independent validation cohort, we aimed to evaluate whether early regional changes in SUVmean may predict the later incidence of CNST. We recruited 2,881 patients to undergo prognostic scanning and followed them up for 24 wk. Three patients were excluded because CNST occurred before prognostic scanning, and thus early changes of SUVmean in 18F-FDG PET/CT were evaluable in 2,878 patients (1,540 male and 1,338 female; mean age, 64.2 ± 5.79 y) for predictive ability. In total, 38 patients (24-wk incidence rate, 1.3%) were diagnosed with CNST, at a mean of 14.79 ± 6.66 wk after ICI initiation. A nomogram to quantify disease-free survival was thus drawn, with an AUC of 0.86 (95% CI, 0.79–0.94; Figs. 4C and 4D).
DISCUSSION
This pilot case-control study of multicenter samples investigated regional metabolism specific to CNST and evaluated the accuracy of preonset regional metabolic changes in predicting the future onset of CNST. CNST was also identified in 18F-FDG PET/CT images as a pathologic entity with specific regional hypermetabolism as compared with brain infection or CNST− patients. Prior case reports showed that the limbic area may be a prominent area of immune attack, and our results showed that hypermetabolism was seen in the whole brain and in the occipital, frontal, and temporal lobes. SUVmean differed between CNST+ and CNSI in several regions—a positive control in terms of inflammation hypermetabolism (29). To our knowledge, our study was the first to analyze metabolism changes in brain immune-related adverse events after ICI treatment and the first to demonstrate that brain hypermetabolism, as a biomarker, may be present well before CNST symptoms exist. These regional metabolism differences were subsequently analyzed by radiomic methods, which showed moderate differentiating abilities. Early metabolism changes can be translated into a suggestive diagnostic tool. Considering the wide application of 18F-FDG PET/CT in prognostic indexing of ICI-based treatment regimens, our pilot study may give initial evidence about quantitative biomarkers to assist CNST diagnosis. Given the extremely low incidence of CNST in ICI-treated cancer patients, with clinical characteristics similar to those of brain infection, use as a noninvasive, quantitative tool to suggest levels of neuroinflammation during active ICI treatment may be a possibility.
Interestingly, early changes in cerebral metabolism were detected 10 wk (quartile range 8.75–14 wk) before CNST onset in a subgroup of patients (n = 60). Although the study recruited a relatively large sample size in terms of CNST incidence, subgroup statistical tests of differences in early changes as compared with CNST− patients may be underpowered to yield conclusive evidence and must be interpreted cautiously. However, the results may support an accumulative immune attack that may happen early before onset, as pointed out by radiologic evidence in other organs (14). Preclinical models also support autoimmunity before symptom onset (30). In our study, the earliest onset time for CNST+ patients with preonset 18F-FDG PET/CT scans happened in the 12 wk after ICI treatment, suggesting a rather late onset. It should be noted that most cases of previously reported CNST had an early-onset symptom, usually beginning at the first month of ICI treatment. Thus, our preonset 18F-FDG PET/CT scans may not be useful as a monitoring tool but rather suggest that immune attacks may occur even before clinical signs.
The ICIs used in our cohorts are all directed toward the programmed cell death protein 1 and programmed death ligand 1 pathways. However, currently, most immune-related reactions occur when ipilimumab, alone or in combination, is directed toward cytotoxic T-lymphocyte–associated protein 4. As such, what we report here may represent only one aspect, or a partial population, of CNST, and future research is encouraged to investigate immune-related adverse events inflicted by other types of immunotherapy (7–9). Also, ICIs may unmask, rather than induce, a preexisting inflammatory condition. As some patients may have an unreported history of mild autoimmune or rheumatic conditions, they may have an increased risk of CNST; this topic may require further investigation (31).
This study had some limitations. First, it had a retrospective design with uncontrolled recall bias in chart review. Second, the 18F-FDG PET/CT scanning time, which was based on oncologist preference and tumor prognostic functions, could not be precisely matched between comparable groups. We chose 18F-FDG PET/CT scanning after 5 mo of ICI therapy in CNST− patients to match the time period in CNST+ patients. Third, there are many confounders that can trigger regional metabolism changes. The SUV in our study was based on activity, weight, and injected dose, without further use of single-subject statistical parametric mapping analysis to normalize intensity. Lack of standardization in intensity normalization, with the correspondingly unknown effect on quantification output, may make the use of SUV in brain 18F-FDG PET/CT quantification less accurate. The population was quite heterogeneous, as it comprised patients with very different neoplasms in which ICI is often used in various combinations with chemotherapy—a potential cause of uncontrolled confounders during comparison (10). Also, age and sex were dictating factors in cerebral metabolism (32). Baseline factors were compared statistically, and several factors were significantly different as shown in Table 1. However, the PSM method, which included multiple baseline confounders in this study, partially salvaged the selection bias. Last, although the sample size was relatively large in the context of the extreme low incidence of CNST, statistical power remained low in matched comparisons, especially in the comparison statistics of matched subtypes of CNST versus CNSI. Future metaanalyses or large-sample research is encouraged to augment the statistical power.
CONCLUSION
Cerebral metabolism seemed increased in CNST+ patients on active ICI therapy as compared with CNST− patients but seemed lower than in CNSI patients in certain brain regions. Early regional changes that were present before CNST seemed to suggest a preonset immune attack, and such early regional changes may be translated into a diagnostic tool based on moderate accuracy in the observational study.
DISCLOSURE
This work was supported by a Fujian Province science and technology innovation joint fund project (2020Y9130 to Shangeng Weng) and by National Natural Science Foundation of China youth science fund projects (82102687 to Yifei Ma and 82201922 to Ao Zhang). The funders had no role in the design or conduct of the study. No other potential conflict of interest relevant to this article was reported.
KEY POINTS
QUESTION: What are the probable biomarkers specific to immune-related CNST in cancer patients treated with ICI by imaging analysis of 18F-FDG PET/CT?
PERTINENT FINDINGS: In a validation cohort of 2,878 patients, preonset changes in SUVmean reached an AUC of 0.86 (95% CI, 0.79–0.94) in predicting the later incidence of CNST.
IMPLICATIONS FOR PATIENT CARE: Regional SUV differences may be translated into early diagnostic tools based on moderate differentiating accuracy in our study.
ACKNOWLEDGMENT
We acknowledge the volunteers who participated in the study.
Footnotes
↵* Contributed equally to this work.
Published online May 2, 2024.
- © 2024 by the Society of Nuclear Medicine and Molecular Imaging.
REFERENCES
- Received for publication November 16, 2023.
- Accepted for publication March 25, 2024.
In this issue


Jump to section
Related Articles
Cited By...
- No citing articles found.