


Visual Abstract

Abstract
PET using 68Ga-labeled fibroblast activation protein (FAP) inhibitors (FAPIs) holds high potential for diagnostic imaging of various malignancies, including lung cancer (LC). However, 18F-FDG PET is still the clinical gold standard for LC imaging. Several subtypes of LC, especially lepidic LC, are frequently 18F-FDG PET–negative, which markedly hampers the assessment of single pulmonary lesions suggestive of LC. Here, we evaluated the diagnostic potential of static and dynamic 68Ga-FAPI-46 PET in the 18F-FDG–negative pulmonary lesions of 19 patients who underwent surgery or biopsy for histologic diagnosis after PET imaging. For target validation, FAP expression in lepidic LC was confirmed by FAP immunohistochemistry. Methods: Hematoxylin and eosin staining and FAP immunohistochemistry of 24 tissue sections of lepidic LC from the local tissue bank were performed and analyzed visually. Clinically, 19 patients underwent static and dynamic 68Ga-FAPI-46 PET in addition to 18F-FDG PET based on individual clinical indications. Static PET data of both examinations were analyzed by determining SUVmax, SUVmean, and tumor-to-background ratio (TBR) against the blood pool, as well as relative parameters (68Ga-FAPI-46 in relation to18F-FDG), of histologically confirmed LC and benign lesions. Time–activity curves and dynamic parameters (time to peak, slope, k1, k2, k3, and k4) were extracted from dynamic 68Ga-FAPI-46 PET data. The sensitivity and specificity of all parameters were analyzed by calculating receiver-operating-characteristic curves. Results: FAP immunohistochemistry confirmed the presence of strongly FAP-positive cancer-associated fibroblasts in lepidic LC. LC showed markedly elevated 68Ga-FAPI-46 uptake, higher TBRs, and higher 68Ga-FAPI-46–to–18F-FDG ratios for all parameters than did benign pulmonary lesions. Dynamic imaging analysis revealed differential time–activity curves for LC and benign pulmonary lesions: initially increasing time–activity curves with a decent slope were typical of LC, and steadily decreasing time–activity curve indicated benign pulmonary lesions, as was reflected by a significantly increased time to peak and significantly smaller absolute values of the slope for LC. Relative 68Ga-FAPI-46–to–18F-FDG ratios regarding SUVmax and TBR showed the highest sensitivity and specificity for the discrimination of LC from benign pulmonary lesions. Conclusion: 68Ga-FAPI-46 PET is a powerful new tool for the assessment of single 18F-FDG–negative pulmonary lesions and may optimize patient stratification in this clinical setting.
Lung cancer (LC) is the most frequently occurring type of cancer and is associated with a high rate of cancer-related death worldwide (1). Accurate and timely diagnosis of LC is crucial for treatment stratification of patients. CT is the most frequently used imaging method for primary staging of LC. CT imaging can be supplemented by 18F-FDG PET to improve tumor staging or to further characterize suggestive pulmonary lesions. Although tumor staging is clearly improved by 18F-FDG PET compared with CT, the additional diagnostic value of 18F-FDG for characterization of suggestive pulmonary lesions is limited (2). Different subtypes of LC have been shown to exhibit largely variable 18F-FDG avidity, such as lepidic LC, which are frequently 18F-FDG–negative, or other acinar- or papillary-dominant adenocarcinomas, which are 18F-FDG–negative or show low 18F-FDG avidity in a substantial percentage of cases (3,4).
PET with 68Ga- or 18F-labeled fibroblast activation protein (FAP) inhibitors (FAPIs) has recently been introduced as a novel imaging technique for various cancers and nonmalignant diseases with tissue remodeling (5–9). Although the clinically well-established 18F-FDG PET is based on increased glucose metabolism of neoplastic cells, FAPI PET allows visualization of the stromal tumor compartment in terms of FAP-positive fibroblasts (9). Because of the vast stromal portion and minor neoplastic-cell portion in many epithelial tumor entities, including LC, FAPIs have a high tumor accumulation in these types of cancer (10–13). Several studies have compared the diagnostic performance of FAPI PET and 18F-FDG PET with respect to the imaging properties of both PET examinations and with respect to potential additional FAPI-positive findings that may lead to differential staging (14,15). In consideration of LC, previous studies have focused on patients with advanced LC and evaluated staging on the basis of FAPI PET compared with 18F-FDG or CT imaging (13,16–18). To our knowledge, no evaluation of FAPI PET yet exists focusing on the characterization of single suggestive pulmonary lesions in the primary situation. Here, we applied static and dynamic 68Ga-FAPI-46 PET imaging in 19 treatment-naïve patients with 18F-FDG PET–negative suggestive pulmonary lesions. All patients underwent biopsy or surgical histologic confirmation of their lesions after imaging. For target validation, FAP expression patterns in 24 separate cases of lepidic LC were evaluated by FAP immunohistochemistry. The purpose of this analysis was to demonstrate the potential diagnostic benefit of supplemental 68Ga-FAPI-46 PET for primary assessment of patients with single suggestive pulmonary lesions.
MATERIALS AND METHODS
Patients
Between February 2022 and April 2023, 19 patients with suggestive pulmonary lesions were examined by CT, 18F-FDG PET, and 68Ga-FAPI-46 PET at the University Hospital Heidelberg. All patients underwent CT and 18F-FDG PET as clinical routine scans and were individually referred for additional 68Ga-FAPI-46 PET by their treating physicians because of inconclusive findings on CT and 18F-FDG PET (18F-FDG negativity despite suggestive CT morphology or patient-related risk factors according to the Fleischner Society guidelines (19)). Written informed consent was obtained from all patients on an individual-patient basis following the regulations of the German Pharmaceuticals Act §13(2b). After imaging, all patients underwent resection or biopsy of their pulmonary lesions followed by histopathologic diagnosis. Retrospective analysis of imaging, clinical, and pathologic data was approved by the local institutional review board (study number S-115/2020).
Diagnostic CT, 18F-FDG PET/CT, and 68Ga-FAPI-46 PET
All 19 patients underwent diagnostic contrast-enhanced CT imaging of the chest before PET imaging. 18F-FDG PET/CT was performed according to standard care as previously described (14). 68Ga-FAPI-46 was synthesized and labeled according to established protocols (9). Static and dynamic 68Ga-FAPI-46 PET/CT was performed using a Biograph mCT Flow scanner (Siemens) as previously described (20). In short, after injection of 187–329 MBq of 68Ga-labeled FAPI-46, low-dose CT without contrast medium was performed, followed by dynamic PET (28 frames over 60 min) to characterize tracer uptake over time, followed by whole-body PET/CT 60 min after tracer injection in 16 of 19 patients. In 3 patients, only whole-body PET/CT 60 min after tracer injection was performed. Reconstructions were performed with corrections for scatter, decay, and attenuation. The average time (±SD) between 18F-FDG PET/CT and 68Ga-FAPI-46 PET/CT was 6.2 ± 6.4 d.
Image Analysis
For static 18F-FDG PET/CT and 68Ga-FAPI-46 PET/PET/CT data, all pulmonary lesions were contoured manually on the basis of their CT appearance. For all lesions, SUVmax, SUVmean, and tumor-to-background ratio (TBR) against blood pool, as well as relative parameters (68Ga-FAPI-46 in relation to18F-FDG), were calculated. All cases selected for this analysis were classified as 18F-FDG–negative according to lesional 18F-FDG uptake equal to or below the blood pool level (in terms of a maximum and mean TBR of less than 1.3) as previously published (21). Differences between histologically confirmed LC and benign lesions were analyzed. For dynamic 68Ga-FAPI-46 PET data, time–activity curves and quantitative dynamic parameters (time to peak [time between start of the dynamic image acquisition and the frame with the highest activity] and slope [relative gradient between the time–activity curve peak and the lowest activity of the following time–activity curve section in analogy to previously published dynamic PET data analyses (22)]) were extracted, and differences between histologically confirmed LC and benign lesions were analyzed. All image analysis was performed using PMOD software (version 4.1; PMOD Technologies).
Immunohistochemistry
To validate FAP expression in lepidic LC, 24 tissue sections of histologically proven lepidic LC from the local tissue bank were stained for hematoxylin and eosin and FAP. These 24 cases were not examined by 68Ga-FAPI-46 PET/CT. For FAP immunohistochemistry, semithin tissue sections of 4-μm thickness were prepared from corresponding paraffin blocks being generated from resection tissue after its fixation in 4% buffered formalin for 24 h at room temperature. Tissue sections were treated with cell conditioning 2 (Roche) buffer (pH 8.0) for antigen retrieval. Immunohistochemical staining was performed using the antibody anti–FAP-α (1:100; Abcam [catalog no. ab207178]). Automated immunostaining was done using the automated Ventana BenchMark Ultra with the OptiView DAB Kit (Roche), Dako AutostainerLink 48, and the EnVision Flex Kit (Agilent). Stained tissue sections were mounted with Consul-Mount (Thermo Fisher Scientific) and scanned by Aperio AT2 (Leica; magnification 1:400) for analysis. All samples were provided by the Tissue Bank of the National Center for Tumor Diseases, in accordance with the regulations of the tissue bank and the approval of the ethics committee of Heidelberg University.
Statistical Analysis
We performed descriptive analyses for patients and their characteristics. For determination of static and dynamic PET parameters, median and range were used. For determination of significance, a 2-sided t test was used, and P values of less than 0.05 were defined as statistically significant. Receiver-operating-characteristic curves and corresponding estimates of area under the curve, including 95% CIs, were computed for static and dynamic PET parameters. GraphPad Prism, version 10, was used for all statistical analyses.
RESULTS
Target Confirmation of FAP in Lepidic LC
To evaluate FAP expression in lepidic LC, we performed FAP immunohistochemistry of 24 biopsy samples of lepidic LC. In all samples, we found variably intensive FAP-positive areas. FAP positivity was particularly pronounced in stroma-rich tumor areas (Fig. 1A) but was also clearly detectable in the tumor rim within single alveolar septa, which showed a desmoplastic reaction to the tumor (Fig. 1B). In contrast, adjacent lung tissue was fully FAP-negative (Fig. 1B).

FAP expression in lepidic LC. (A and B) Representative hematoxylin and eosin staining (left) and immunohistochemical staining against FAP (right) of central part of lepidic LC biopsy, which shows strong stromal FAP positivity (A), and tumor front of lepidic LC, showing transition from FAP-positive LC tumor rim into FAP-negative physiologic lung tissue (B) (magnification: upper rows, ×10; lower rows, ×40) (scale bars: upper rows, 100 μm; lower rows, 20 μm).
Patient Characteristics and Histologic Results
The cohort consisted of 19 patients (5 female, 14 male) aged from 41 to 77 y (average, 61.8 ± 10.5 y). The average size of the CT-graphically suggestive lesions was 22.47 ± 14.9 mm. After 18F-FDG and 68Ga-FAPI-46 PET imaging, tissue from all patients was obtained by either biopsy or surgery and subjected to definitive pathologic diagnosis. Seven patients had benign diagnoses (2 hamartomas, 1 tuberculosis, 1 sarcoidosis, 1 granuloma, 1 calcified lymph node, and 1 lung tissue without evidence of pathology), and 12 patients were diagnosed with LC (11 adenocarcinomas [4 of them with a predominantly lepidic growth pattern] and 1 typical carcinoid). Detailed patientwise information on the clinical status and applied imaging methods is given in Table 1.
Clinical Parameters and Diagnoses of 19 Patients with 18F-FDG–Negative Pulmonary Lesions
CT Size and 18F-FDG and 68Ga-FAPI-46 Uptake of LC and Benign Lesions
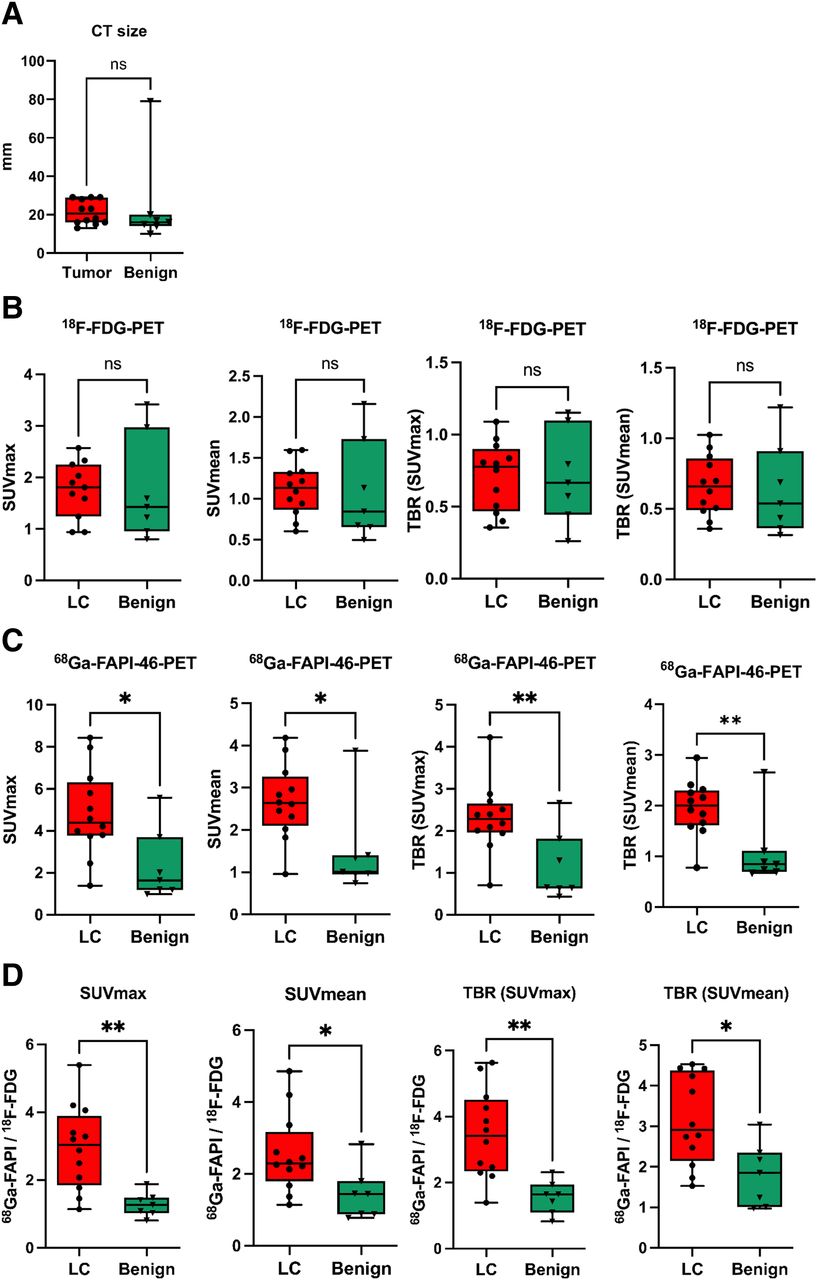
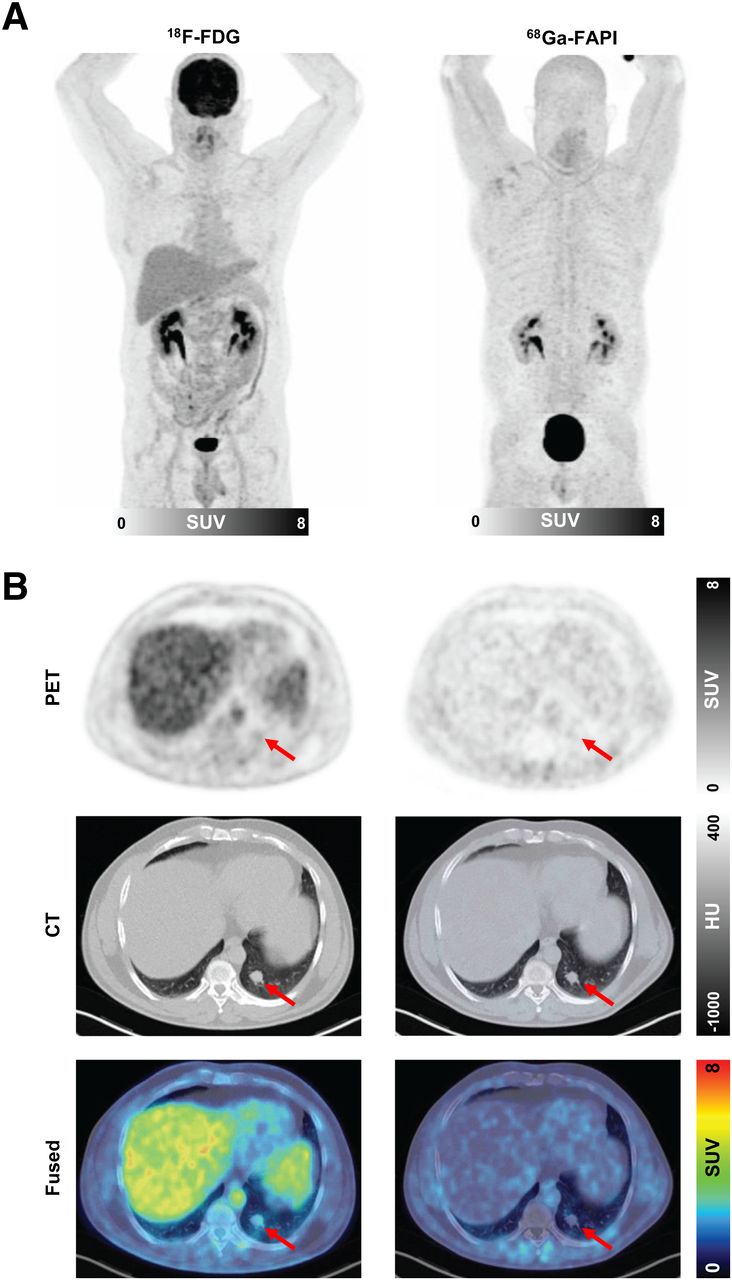
LC and benign lesions showed no significant differences in their average CT size or 18F-FDG uptake in terms of SUVmax, SUVmean, or corresponding TBR (Figs. 2A and 2B). In contrast, the average 68Ga-FAPI-46 uptake of LC lesions was significantly higher than that of benign lesions (Fig. 2C). Similarly, ratios between 68Ga-FAPI-46 uptake and 18F-FDG uptake were also significantly higher in LC than in benign lesions (Fig. 2D). With respect to benign subentities, moderately higher 18F-FDG and 68Ga-FAPI-46 uptake was seen in sarcoidosis, tuberculosis, and the calcified lymph node than in the other benign lesions (Supplemental Fig. 1; supplemental materials are available at http://jnm.snmjournals.org). Supplemental Table 1 provides a lesionwise overview of all static PET parameters (SUVmax, SUVmean, and corresponding TBR for 18F-FDG and 68Ga-FAPI-46 PET) for all LC and benign lesions analyzed. Figures 3 and 4 show 18F-FDG PET and 68Ga-FAPI-46 images of an example patient with a lepidic LC that had 18F-FDG uptake below the blood pool level and strong 68Ga-FAPI-46 positivity (Fig. 3) and an example patient with a hamartoma that showed only faint uptake of both tracers (Fig. 4).

Quantitative analysis of 18F-FDG and 68Ga-FAPI-46 uptake in LC and benign pulmonary lesions of 19 patients. (A–C) Box plots of SUVmax, SUVmean, and their corresponding TBRs against mediastinal blood pool for LC and benign pulmonary lesions calculated for 18F-FDG (A) and 68Ga-FAPI-46 (B) and fold changes of all parameters calculated for ratio of 68Ga-FAPI-46 to18F-FDG (C). Boxes represent interquartile range, whiskers represent interquartile range of 1.5, and horizontal line within box indicates median. Data outliers are shown separately within graph. *P < 0.05. **P < 0.01. ns = not significant.

Example 18F-FDG and 68Ga-FAPI-46 images of 51-y-old woman with adenocarcinoma with lepidic growth pattern in right upper lobe. (A) Maximum-intensity-projection PET images. (B) Axial images of suggestive lesion (red arrows) with low CT density in right lower lobe. Green arrows show blood pool in aortic arch. Lesion had 18F-FDG uptake below blood pool niveau but was strongly 68Ga-FAPI-46–positive. CT-guided biopsy led to pathologic diagnosis of adenocarcinoma, and patient was treated by stereotactic body radiation therapy because of functional inoperability. HU = Hounsfield units.

Example 18F-FDG and 68Ga-FAPI-46 images of 41-y-old man with hamartoma in left lower lobe. (A) Maximum-intensity-projection PET images. (B) Axial images of suggestive lesion (arrows) in left lower lobe. After wedge resection, hamartoma was diagnosed by pathology. HU = Hounsfield units.
Dynamic 68Ga-FAPI-46 PET Imaging Characteristics of LC and Benign Lesions
Dynamic 68Ga-FAPI-46 PET imaging was performed on 11 patients with LC and 5 patients with benign lesions. LC and benign lesions showed marked differences regarding their time–activity curve characteristics. As shown by the averaged time–activity curves in Figure 5A, LC was characterized by a delayed peak at 500–1,000 s after injection followed by a slow, continuous washout phase. In contrast, benign lesions typically showed an early peak within the first 2 min after injection followed by a rapid washout phase resulting in a reduction in activity to approximately 50% at 60 min after injection. Quantitative analysis of time to peak and slope showed a significantly prolonged time to peak and significantly smaller absolute values of slopes for LC than for benign lesions (Fig. 5B). Figure 5C shows 2 cases of LC and sarcoidosis, both of which had intermediate 68Ga-FAPI-46 uptake on static imaging but time–activity curves typical of LC and benign lesions, respectively.

Dynamic 68Ga-FAPI-46 PET imaging properties of LC and benign pulmonary lesions. (A) Averaged time–activity curves (relative to peak) of LC and benign pulmonary lesions. (B) Box plot of time to peak and slope of LC and benign pulmonary lesions. Boxes represent interquartile range, whiskers represent interquartile range of 1.5, and horizontal line within box indicates median. (C) Representative cases: 63-y-old man with adenocarcinoma (arrow) of left upper lobe and 62-y-old man with focally 68Ga-FAPI-46–avid sarcoid mass (encircled) in right lower lobe. Images are from static PET, and time–activity curves are from dynamic PET. Although both lesions show intermediate 68Ga-FAPI-46 uptake, time–activity curves clearly differ, with delayed peak of LC and markedly pronounced slope of sarcoidosis. *P < 0.05.
Sensitivity and Specificity of Static and Dynamic 68Ga-FAPI-46 PET Imaging Parameters
Receiver-operating-characteristic curves calculated for all static parameters and for the dynamic parameters time to peak and slope showed high sensitivity and specificity for discriminating LC from benign lesions. The highest areas under the curve were calculated for 68Ga-FAPI-46/18F-FDG SUVmax TBR (0.9167), 68Ga-FAPI-46/18F-FDG SUVmean (0.9167), SUVmean TBR (0.8831), and SUVmax TBR (0.8571) (Fig. 6). The calculated sensitivity and specificity of 68Ga-FAPI-46/18F-FDG SUVmax TBR were 85.71 (95% CI, 48.69–99.27) and 83.33 (95% CI, 55.20–97.04), respectively, for a cutoff of 1.62. The other static and the dynamic 68Ga-FAPI-46 PET parameters showed slightly lower areas under the curve, and the 18F-FDG PET parameters and CT size showed significantly lower areas under the curve (Supplemental Fig. 2).

Receiver-operating-characteristic (ROC) curves of 4 quantitative PET parameters with highest discriminatory power: 68Ga-FAPI-46/18F-FDG SUVmax (A), 68Ga-FAPI-46/18F-FDG TBR SUVmax (B), SUVmean TBR (C), and SUVmax TBR (D).
DISCUSSION
This retrospective analysis evaluated the 68Ga-FAPI-46 uptake of primary, 18F-FDG–negative LC and benign pulmonary lesions, as well as their kinetic behavior in dynamic 68Ga-FAPI-46 PET imaging. To characterize lepidic LC as a particularly promising 18F-FDG–negative target for 68Ga-FAPI-46 PET, we performed additional FAP immunohistochemistry of 24 tissue sections of lepidic LC and found strong FAP positivity in all specimens. This advance target characterization was of crucial interest for our analysis, as the presence of cancer-associated fibroblasts in lepidic LC has already been described histologically but the FAP expression of this entity had not, to our knowledge, been evaluated before (23). The strong FAP expression of lepidic LC is noteworthy because FAP-positive cancer-associated fibroblasts are crucially involved in tumor desmoplasia (24,25)—a process that is canonically considered a feature of more invasive LC subtypes, but not lepidic LC, as recently proposed by the International Association for the Study of Lung Cancer pathology committee (26). However, the results of our immunohistochemical and PET studies seem to indicate that a stromal reaction resulting in FAP positivity of the tumors is present even in early-stage, relatively noninvasive cancers such as lepidic LC.
In our analysis, all cases of LC showed markedly elevated 68Ga-FAPI-46 uptake, increased TBRs, and increased 68Ga-FAPI-46/18F-FDG ratios for all parameters compared with benign pulmonary lesions. One prospective study and large retrospective analyses have demonstrated that 68Ga-FAPI-46 PET in addition to gold standard imaging methods holds high potential for the staging and clinical management of LC (13–15,27). However, these studies were focused on advanced-stage cancers and did not address the value of 68Ga-FAPI-46 PET for the assessment of unclear single pulmonary lesions. In their recent prospective study on 34 patients with advanced, metastatic LC, Wang et al. showed that 68Ga-FAPI PET in addition to 18F-FDG PET/CT detects additional suspected metastases in lymph nodes, brain, bone, and pleura. However, the metabolic tumor volume and SUVmax in primary and recurrent primaries were mostly identical for both tracers (13). Similarly, Giesel et al. found no significant difference in 68Ga-FAPI and 18F-FDG uptake by primary tumors in 71 patients with various cancers, including 9 patients with LC (14). The missing difference in 18F-FDG and 68Ga-FAPI PET signal behavior for LC primaries in these studies might be explained by the inclusion of patients with primary and recurrent stage IV disease only, which is biologically more aggressive and more 18F-FDG–avid than the nonmetastatic 18F-FDG–negative primaries in our analysis. Chen et al. analyzed 68Ga-FAPI– and 18F-FDG–based staging of 54 cancer patients, including 8 with LC, and reported higher SUVs for LC primaries for 68Ga-FAPI than for 18F-FDG. Furthermore, they included 2 LC cases in which the primary tumor was detectable with 68Ga-FAPI PET but not 18F-FDG PET (15). However, because only 2 stage I LC cases were included, there is reduced comparability between their results and ours.
Dynamic imaging analysis revealed differential time–activity curves for LC and benign pulmonary lesions: initially increasing time–activity curves with a decent slope were typical of LC, and steadily decreasing time–activity curve indicated benign pulmonary lesions, as reflected by a significantly increased time to peak and absolute value of the slope for LC. These results are in line with our previously published data on dynamic 68Ga-FAPI-46 PET in LC and fibrosing interstitial lung diseases, intraductal papillary mucinous neoplasms of the pancreas, and pancreatic ductal adenocarcinomas. In that work, we observed similar time–activity curve patterns related to whether tumors were benign or malignant (20,28). On the basis of our summed experiences, we would generally recommend dynamic 68Ga-FAPI PET acquisition in primary patients with unclear and potentially malignant lesions, such as screening-detected pulmonary lesions.
Relative (68Ga-FAPI-46/18F-FDG) SUVmax and TBR showed the highest sensitivity and specificity for the discrimination of LC from benign pulmonary lesions, and the other static and dynamic PET parameters had only slightly lower sensitivity and specificity. CT size, which is in general the most important imaging feature for the risk stratification of pulmonary lesions (29,30), showed significantly lower sensitivity and specificity for the discrimination of LC from benign lesions, as can be explained by the relatively low number of patients included. The sensitivity and specificity of the 68Ga-FAPI-46 PET–derived parameters calculated for our dataset were similar to those reported for 18F-FDG (31,32). However, as our dataset included only highly selected 18F-FDG–negative cases, a comparison between the discriminatory power of 68Ga-FAPI-46 PET and 18F-FDG PET for single pulmonary lesions cannot be made.
Our results suggest that supplemental 68Ga-FAPI-46 PET may improve the noninvasive assessment of primary pulmonary lesions compared with 18F-FDG PET and CT alone. Noninvasive assessment of pulmonary lesions is of great clinical relevance because there are several contraindications, such as coagulopathies, reduced cardiopulmonary function, or reduced lung function, that can disfavor surgery or biopsy interventions, especially in elderly patients (33). In particular, for lepidic LC, 68Ga-FAPI-46 PET holds great potential to facilitate and accelerate clinical decision making toward biopsy or operative resection, as 18F-FDG PET frequently leads to inconclusive results, and CT-morphologic progression of these slowly growing tumors can be detected only over a relatively long time (34). On the other hand, supplemental 68Ga-FAPI-46 PET could be helpful to avoid overtreatment in terms of unnecessary resections, as double-negative (18F-FDG and 68Ga-FAPI-46) lesions appear to have a high probability of being benign. Dynamic imaging can support the assessment of pulmonary lesions in cases without clearly suggestive high or low 68Ga-FAPI-46 uptake. However, the results of our recent analysis should be considered preliminary and hypothesis-generating, and 2 major limitations must be mentioned. First, the number of patients analyzed was relatively small—with the subgroups thus being even smaller, especially with regard to benign subentities. Second, because the patients were highly selected according to 18F-FDG negativity of suggestive pulmonary lesions, our dataset does not allow comparison of the diagnostic accuracy of 18F-FDG and 68Ga-FAPI-46 PET for primary pulmonary lesions in general. Larger, confirmative studies are necessary to gain more evidence on the clinical value of 68Ga-FAPI-46 PET for assessment of primary pulmonary lesions.
CONCLUSION
The intense 68Ga-FAPI-46 uptake of primary, 18F-FDG–negative LC compared with benign pulmonary lesions, as well as their differential kinetic behavior on dynamic 68Ga-FAPI-46 PET imaging, suggests that supplemental 68Ga-FAPI-46 PET may optimize patient stratification in this clinical scenario. The promising results of this analysis should be confirmed by larger studies.
DISCLOSURE
This work was funded by the Federal Ministry of Education and Research (grant 13N 13341). Uwe Haberkorn has filed a patent application for quinoline-based FAP-targeting agents for imaging and therapy in nuclear medicine and has shares of a consultancy group for iTheranostics. No other potential conflict of interest relevant to this article was reported.
KEY POINTS
QUESTION: Can supplemental 68Ga-FAPI-46 PET help to assess 18F-FDG–negative single pulmonary lesions?
PERTINENT FINDINGS: LC showed markedly elevated 68Ga-FAPI-46 uptake, increased TBRs, and increased 68Ga-FAPI-46/18F-FDG ratios for all parameters compared with benign pulmonary lesions. Dynamic imaging analysis revealed differential time–activity curves for LC and benign pulmonary lesions. Relative (68Ga-FAPI-46/18F-FDG) SUVmax and TBR showed the highest sensitivity and specificity for discrimination of LC from benign pulmonary lesions.
IMPLICATIONS FOR PATIENT CARE: Supplemental 68Ga-FAPI-46 PET appears extremely promising in the clinical scenario of 18F-FDG–negative single pulmonary lesions, especially when biopsy or resection is hampered by reduced health status of patients and noninvasive methods are crucial for assessment of malignancy.
Footnotes
Published online Apr. 11, 2024.
- © 2024 by the Society of Nuclear Medicine and Molecular Imaging.
REFERENCES
- Received for publication November 24, 2023.
- Revision received February 20, 2024.


