


Visual Abstract

Abstract
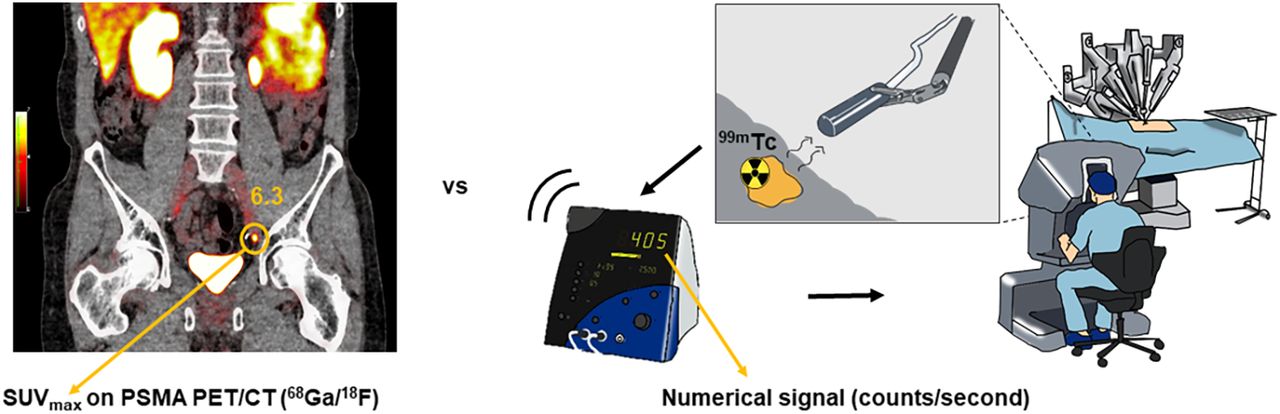
Prostate-specific membrane antigen (PSMA) PET is used to select patients with recurrent prostate cancer for metastasis-directed therapy. A surgical approach can be achieved through radioguided surgery (RGS), using a Drop-In γ-probe that traces lesions that accumulate the radioactive signal. With the aim of guiding patient selection for salvage surgery, we studied the correlation between the SUVmax of lesions on preoperative PSMA PET/CT and their intraoperative counts/s measured using the Drop-In γ-probe. Methods: A secondary analysis based on the prospective, single-arm, and single-center feasibility study was conducted (NCT03857113). Patients (n = 29) with biochemical recurrence after previous curative-intent therapy and a maximum of 3 suggestive lesions within the pelvis on preoperative PSMA PET/CT were included. Patients treated with androgen deprivation therapy within 6 mo before surgery were excluded. All patients received an intravenous injection of 99mTc-PSMA-I&S 1 d before surgery. Radioguidance was achieved using a Drop-In γ-probe. Correlation was determined using the Spearman rank correlation coefficient (ρs). Subgroup analysis was based on the median SUVmax. Results: In total, 33 lesions were visible on the PSMA PET/CT images, with a median overall SUVmax of 6.2 (interquartile range [IQR], 4.2–9.7). RGS facilitated removal of 31 lesions. The median Drop-In counts/s were 134 (IQR, 81–220) in vivo and 109 (IQR, 72–219) ex vivo. The intensity of the values correlated with SUVmax (ρs = 0.728 and 0.763, respectively; P < 0.001). Subgroup analysis based on median SUVmax in the group with an SUVmax of less than 6 showed no statistically significant correlation with the numeric signal in vivo (ρs = 0.382; P = 0.221) or the signal-to-background-ratio (ρs = 0.245; P = 0.442), whereas the group with an SUVmax of 6 or more showed respective statistically significant positive correlations (ρs = 0.774 [P < 0.001] and ρs = 0.647 [P = 0.007]). Conclusion: Our findings indicate that there is a direct relation between SUVmax on PSMA PET/CT and the readout recorded by the surgical Drop-In probe, thereby indicating that SUVmax can be used to select patients for PSMA RGS. For more definitive subgroup definitions for treatment recommendations, further studies are necessary to validate the present findings.
Despite curative-intent treatment in primary prostate cancer, recurrences occur in 20%–40% of patients (1,2). Targeting the prostate-specific membrane antigen (PSMA), a protein that is highly overexpressed on the surface of most prostate cancer cells, supports PET imaging. A technology that has substantially enhanced the diagnosis of prostate cancer metastases in intermediate- and high-risk primary patients (3), PSMA PET/CT can detect metastatic lesions in patients with biochemical recurrence at prostate-specific antigen (PSA) values of less than 0.5 ng/mL (4,5), thereby enabling curative metastasis-directed treatment options such as salvage radiotherapy and salvage lymph node dissection.
To accommodate PSMA-targeted surgery, γ-emitting PSMA ligands have been developed that facilitate image-guided surgery (6,7). In a PSMA-guided workflow, PSMA PET/CT provides the surgical road map, and a secondary PSMA ligand is used to provide intraoperative guidance. Signal intensities of primary tumors on PSMA PET/CT (SUVmax) have been reported to vary substantially (8).
For guidance during surgery, the γ-emitting 99mTc-based tracer [99mTc]Tc-PSMA-I&S has been most frequently used (9). This agent not only facilitates PSMA ligand SPECT/CT, albeit with an inferior performance compared with PSMA PET/CT (10,11), but also facilitates intraoperative lesion localization via γ-tracing (counts/s) (12), so-called radioguided surgery (RGS) (Fig. 1). Expanding from traditional γ-probes in open surgery (12–15), the introduction of the miniaturized Drop-In γ-probe (Eurorad S.A.) facilitated dissemination of these procedures to robotic surgery (16–19). Limited research has been conducted on the SUVmax in relation to intraoperative numeric signal. Although the intraoperative counts/s vary substantially (18,19), there are indications that these values relate to the SUVmax (20).

Illustration of PSMA PET/CT vs. numeric signal (counts/s) as seen by operating surgeon during robot-assisted surgery.
The aim of this study was to further corroborate the relation between the SUVmax on PSMA PET/CT and the surgical signal detected using [99mTc]Tc-PSMA-I&S. Ultimately, the goal is to identify cutoffs that can be used to refine the selection criteria for PSMA-targeted RGS.
MATERIALS AND METHODS
Study Design and Patient Population
A secondary analysis was performed on data from a prospective, single-center feasibility study that was approved by the local ethics committee at The Netherlands Cancer Institute (ClinicalTrials.gov identifier NCT03857113). All subjects gave written informed consent. The institutional review board approved this retrospective study (IRBdm21-106). Patients were included if they had biochemical recurrence (PSA between 0.2 and 4 ng/mL at 2 consecutive measurements) after previous curative-intent treatment and a maximum of 3 soft-tissue lesions (local or nodal recurrences) on PSMA PET/CT. Patients were excluded if they were receiving androgen deprivation therapy within 6 mo prior to surgery. Patients were treated with robot-assisted 99mTc-PSMA–targeted salvage RGS between June 2020 and November 2022 (19).
Preoperative Imaging and Analysis
All patients underwent PSMA PET/CT within the Prostate Cancer Network Netherlands (Prostaatkankernetwerk Nederland). Patients were scanned using [68Ga]Ga-PSMA-11, [18F]DCFPyl, or [18F]JK-PSMA-7 within 125 d before RGS, according to local protocols. Two experienced nuclear medicine physicians reevaluated the preoperative imaging using Osirix MD (Pixmeo SARL). On preoperative PSMA PET/CT, the SUVmax of lesions noted in the clinical report was determined by drawing a volume of interest over the lesions. The short-axis diameter of the morphologic substrate, if visible on concurrent CT, was measured.
One day before surgery, a single dose of [99mTc]Tc-PSMA-I&S (median, 541 MBq; interquartile range [IQR], 482–559 MBq) was injected intravenously and assessed by performing SPECT/CT on the morning of surgery, a median of 17 h (IQR, 17.3–17.8 h) after the injection. The preoperative scintigraphy was reevaluated after the evaluators had been masked to clinical or study-related data, including the preoperative PSMA PET/CT and intraoperative findings. The number and location of suggestive lesions were noted.
Intraoperative Measurements
Within a median of 21 h after injection, RGS was performed. All surgical procedures were done using a da Vinci Xi robot (Intuitive Surgical). Radioguidance was achieved using a Drop-In γ-probe translating the radiosignal to the numeric signal. First, radiotracer activity measurements of anatomic landmarks near target prostate cancer lesions (i.e., iliac artery, iliac vein, and psoas muscle) were performed to determine the background signal. Second, the locations of the suspected prostate cancer lesions were scanned in vivo with the Drop-In probe to assess the signal-to-background ratio (SBR). To confirm successful removal of radioactive tissue, ex vivo validations were performed using the Drop-In γ-probe. A detailed description of the surgical procedures was provided by de Barros et al. (19).
Histopathologic Evaluation and Immunohistochemistry
All dissected specimens were sent for histopathologic examination with hematoxylin and eosin staining and, if needed, immunohistochemical pan cytokeratin AE13 (cytokeratin AE1 and AE3) staining. On prostate cancer–positive tissues, additional immunohistochemical PSMA staining was performed (clone 3E6; Dako) to assess the PSMA intensity. The total immunostaining score (TIS) was calculated using:
The proportion score represented the percentage of cells that stained positively with a particular intensity and could range between 0% and 100%. The intensity score represented the intensity of the stained cells and could range between 0 and 3 (0, no staining; 1, weak; 2, moderate; 3, strong). One pathologist analyzed all intraoperative obtained tissues. The size of the node was measured along the long axis. The TIS of each tumor-positive region was correlated with the SUVmax and the numeric signal of the in vivo and ex vivo measurements.
Statistical Analysis
Data were summarized by frequency and percentage for categoric variables and mean and median with ranges for continuous variables. The numeric signal was normalized to account for differences in injected activity of 99mTc, using the average injected dose as the standard (550 MBq). For continuous variables, normality of distribution was verified with Kolmogorov–Smirnov testing. The primary outcome of interest was the correlation of the SUVmax of the prostate cancer lesions on preoperative PSMA PET/CT and the in vivo numeric signal of the PSMA-positive prostate cancer lesions recorded with the Drop-In γ-probe. A secondary outcome was the ex vivo signal and the PSMA intensity on histopathology’s correlation with SUVmax. All were analyzed using the Spearman rank correlation coefficient (ρs) to determine the correlation. To evaluate the visual perception of a potential correlation, a scatterplot was produced. The different PSMA PET tracers were compared using a Kruskal–Wallis statistical test, and the SPECT/CT subgroups were compared using a Mann–Whitney U statistical test. To identify meaningful subgroups for clinical applicability, median regression with concave fusion penalizations was used (21). A P value of less than 0.05 was considered statistically significant. Statistical analysis was performed with SPSS Statistics, version 29.0 (IBM).
RESULTS
Patient Characteristics
After staging on PSMA PET/CT, 29 patients who had suspected nodal disease (n = 25) or locally recurrent prostate cancer (n = 4) were included (Fig. 2). As primary treatment, 21 patients (72%) underwent radical prostatectomy and 8 (28%) underwent radiotherapy. Subsequently, 13 patients (45%) underwent salvage therapy before [99mTc]Tc-PSMA RGS (Table 1).

Workflow and inclusions. (A–C) Patient selection for salvage [99mTc]Tc-PSMA RGS (A), preoperative PSMA PET/CT (B), and [99mTc]Tc-PSMA-I&S imaging (C) demonstrate parailiac lesion in patient with biochemical recurrence. (D) Intraoperative activity measurements with Drop-In γ-probe. (E) Immunohistochemistry (PSMA staining) at histopathologic examination.
Patient Characteristics
Preoperative Imaging and Analysis
In total, 33 PSMA-avid lesions were identified on the preoperative PSMA PET/CT. The overall median SUVmax on preoperative PSMA PET/CT was 6.2 (IQR, 4.2–9.7) and did not differ between the different tracers (P = 0.559) (Table 2). Ninety-seven percent of the PSMA PET/CT scans were conducted on a European Association of Nuclear Medicine Research Ltd.–accredited system (22,23). Twenty-seven of the 33 (82%) identified lesions were smaller than 1 cm, with a median size of 4 mm (IQR, 3.8–6 mm). The size of the PSMA PET/CT–avid lesion correlated significantly with the SUVmax (ρs = 0.728; P < 0.001). The PSA before RGS showed a weak, nonsignificant correlation with the SUVmax (ρs = 0.2041; P = 0.289), as did the PSA density (defined as PSA before surgery multiplied by the size of the lesion or lesions on PSMA PET/CT) (ρs = 0.390; P = 0.073).
Characteristics of Diagnostic Preoperative Imaging and Preparation for Surgery
Of the 33 lesions found on PSMA PET/CT, 23 (70%) were observed on PSMA-I&S SPECT/CT and 10 (30%) were not. Within the group of lesions that were not visible on SPECT/CT, the median SUVmax was 4.9 (IQR, 3.3–6.4), whereas the group of lesions visible on SPECT/CT had a median SUVmax of 7.4 (IQR, 5.3–14.3) (P = 0.028). Visibility on SPECT/CT was not associated with a higher numeric signal in vivo (P = 0.237) or a higher SBR (P = 0.453)
Intraoperative
In total, 31 of 33 (94%) lesions were successfully removed during robot-assisted RGS. One suggestive LN could not be localized because of extensive intestinal adhesions (3 mm on PSMA PET/CT; SUVmax, 5.3), and 1 LN (3 mm on PSMA PET/CT; SUVmax, 1.8) located in the pararectal fat could not be detected because of high background signal in the rectum as a result of hepatobiliary tracer clearance. The numeric signal of the lesion was recorded both in vivo and ex vivo (median, 134 counts/s [IQR, 81–220] and 109 counts/s [IQR, 72–219], respectively). The median SBR in vivo was 2.3 (IQR, 1.7–3.9). No correlation was seen between the duration of the surgery (median, 136 min; IQR, 101–155) and the SUVmax (ρs = −1.44; P = 0.457) or the counts in vivo (ρs = −1.38; P = 0.492).
Correlation Between SUVmax and Intraoperative Numeric Signal
A significant and strong positive correlation was found between the overall SUVmax and the intraoperative measures (ρs = 0.728 and 0.763 for in vivo and ex vivo, respectively; P < 0.001) (Fig. 3). Median regression analysis identified 2 SUVmax subgroups (<6 and ≥6). The former subgroup showed no statistically significant correlation with the numeric signal in vivo (ρs = 0.382; P = 0.221), whereas the latter did (ρs = 0.774; P < 0.001). Ex vivo results were similar (SUVmax < 6, ρs = 0.308 [P = 0.284]; SUVmax ≥ 6, ρs = 0.752 [P < 0.001]). A very moderate, nonsignificant, correlation was observed between the size of the lesion on preoperative PSMA PET/CT and numeric signal in vivo (ρs = 0.421; P = 0.057) and ex vivo (ρs = 0.492; P = 0.015).

Scatterplot illustrating correlation between SUVmax on preoperative PSMA PET/CT and in vivo and ex vivo numeric signal of Drop-In γ-probe.
Overall, a moderate correlation was found for the SUVmax of the prostate cancer lesions on preoperative PSMA PET/CT and the SBR in vivo (ρs = 0.524; P = 0.004). Subgroup analysis showed no correlation between an SUVmax of less than 6 (ρs = 0.245; P = 0.442) and the SBR, whereas a strong correlation was observed for lesions with an SUVmax of 6 or higher (ρs = 0.647; P = 0.007).
Correlation Between SUVmax and PSMA Intensity Staining
Among the removed lesions, the median TIS was 2.3 (IQR, 2.0–3.0) (Table 3). The distribution of PSMA intensity was homogeneous in 46% of the lesions and heterogeneous in 54%. The type of distribution had no significant impact on SUVmax (P = 0.602). No positive correlation was found between SUVmax and TIS (ρs = −0.433; P = 0.015). Multiplying TIS by the size of the lesion at pathology did not show a correlation with SUVmax on preoperative PSMA PET/CT (ρs = 0.190; P = 0.353).
Intraoperative and Histopathologic Outcomes
DISCUSSION
By directly comparing pre- and intraoperative PSMA-targeting strategies, we could identify a significant, positive correlation between SUVmax and Drop-In γ-probe measurements. The higher the SUVmax is, the greater is the distinction between the tumor and surrounding structures in vivo, suggesting a more reliable road map. Lesion identification may seem less straightforward with a lower SUVmax but was not impossible since nearly all lesions in the present study were identified and removed. Our results are in line with the findings of Gondoputro et al., who performed successful RGS on lesions with a median SUVmax of 4.4 (18). SUVmax should therefore be considered among various parameters in the case assessment. Not all removed lesions were seen on the preoperative SPECT/CT, possibly because of timing and background interference (11). Although one might assume that the greater the distinction the shorter the duration of the surgery, the current results are inconclusive in this regard. A possible explanation might be the other factors that influence duration, such as adhesions, the type of tissue surrounding the lesion, and the learning curve of the operating surgeon.
On the basis of median regression, we defined 2 SUVmax subgroups (<6 and ≥6) that showed clear differences in sensitivity and specificity. However, external validation of these findings is needed in larger series since subgroups were not defined a priori. Nevertheless, with an increasing population subjected to oligometastatic treatment by PSMA RGS (9), definitions of optimal subgroups for RGS are desired.
For clinical applicability it would be less time-consuming to base the preoperative assessment on the size of the lesion. This study showed, however, that lesion size was not a significant predictor for the number of intraoperative numeric signal, whereas SUVmax appeared to be a strong and significant predictor and should therefore be preferred when selecting patients.
No positive correlation was observed between SUVmax and PSMA intensity staining defined as the TIS, possibly because of the wide variation in SUVmax and the fact that TIS ranged mostly from moderate to strong. Another influential factor could be the reporting of lymph node size solely as diameter, and the evaluation of TIS per slide, which omits consideration of its 3 dimensions. Little is known regarding the TIS and SUVmax of prostate cancer–positive lymph nodes. Looking at radical prostatectomy specimens, Rüschoff et al. also found no significant correlation between SUVmax on PSMA PET/CT and immunohistochemical PSMA intensity expression (24), whereas Jiao et al. and Vetrone et al. did find a correlation (25,26), possibly explained by different tumor characteristics or growth patterns (8).
Limitations include the high variability in a relatively small number of included patients and the retrospective nature of the secondary analysis. For the scope of this article, only PSMA PET/CT–positive nodes were included. The inclusion criteria of the prospective study introduce a possible selection bias (19). The nature of the surrounding tissue is always a consideration when measuring activity in vivo. To minimize the effect of background signal, in the prospective study the values were documented in real time after careful positioning of the Drop-In γ-probe. A limitation remains, however, in that the surrounding tissue type was not considered in this secondary analysis. In addition, applicability in open surgery was not studied.
Subgroup analysis was performed although subgroups were not specified a priori; inferential issues might therefore emerge. Subgroups based on the median are dependent on the cohort and may alter slightly after validation in larger cohorts. Furthermore, there were differences in the median SUVmax used for different PSMA PET/CT tracers and systems—although an accurate representation of daily clinical practice. Although our groups were much smaller, the differences were similar to those seen by de Bie et al., who found recurrent prostate cancer to have a nonsignificantly higher SUVmax in the [68Ga]Ga-PSMA-11 group (27). In addition, all surgical procedures were performed in a single tertiary center experienced in the use of 99mTc-tracers and the Drop-In γ-probe.
With the growing implementation of PSMA RGS and minimally invasive robotic surgery, it is expected that PSMA PET/CT will assume a fundamental role in the selection of patients, thereby helping to optimize the treatment of patients with oligometastatic prostate cancer recurrence and perhaps also during primary treatment.
CONCLUSION
This study showed a significant positive correlation between the SUVmax on preoperative PSMA PET/CT and the intraoperative numeric signal measured by the Drop-In γ-probe, thereby indicating that SUVmax can be considered a parameter to select patients for PSMA RGS. Further studies are needed to validate the present subgroup definitions before treatment recommendations can be made.
DISCLOSURE
Fijs W.B van Leeuwen is supported by an NWO-TTW-VICI grant (TTW 16141). No other potential conflict of interest relevant to this article was reported.
KEY POINTS
QUESTION: Does the SUVmax on preoperative PSMA PET/CT correlate with the intraoperative γ-probe signal during radioguided prostate cancer surgery?
PERTINENT FINDINGS: A secondary analysis based on the prospective, single-arm, and single-center feasibility study was conducted. Results showed a strong and statistically significant correlation between the SUVmax on preoperative PSMA PET/CT and the intraoperative numeric γ-probe signal
IMPLICATIONS FOR PATIENT CARE: Our findings of a direct relation between the SUVmax on PSMA PET/CT and the intraoperative signal indicates that SUVmax can be considered among other parameters to select patients for PSMA RGS.
ACKNOWLEDGMENTS
We thank the nuclear medicine, pathologic, and surgical staff of the Netherlands Cancer Institute.
Footnotes
↵* Contributed equally to this work.
Published online Mar. 14, 2024.
- © 2024 by the Society of Nuclear Medicine and Molecular Imaging.
REFERENCES
- Received for publication November 16, 2023.
- Revision received January 11, 2024.
In this issue


Jump to section
Related Articles
Cited By...
- No citing articles found.