


Visual Abstract

Abstract
In several malignancies, only a limited number of patients respond to immune checkpoint inhibitors. Predicting and monitoring responses to these inhibitors represent an unmet clinical need. Here, we developed a PET/CT probe targeting granzyme B, [68Ga]Ga-NOTA-Gly-Gly-Gly-Ile-Glu-Pro-Asp-CHO (GSI), and aimed to investigate whether it can be used to monitor the effects of immune checkpoint inhibitors early in the course of therapy. Methods: Seventy-two patients with gastric cancer (stages III–IV) were recruited for [68Ga]Ga-NOTA-GSI PET/CT imaging after 2 or 3 cycles of the immunotherapy, and 40 patients were included in the final analysis. The SUVmax of primary tumors (SUVmax-t), SUVmax of metastatic lymph nodes (SUVmax-LN), and SUVmax of normal tissues (liver and blood pool) were measured, and their target-to-liver background ratio (TLR) and target-to-blood background ratio (TBR) were denoted for primary tumors as TLRtumor and TBRtumor and for metastatic lymph nodes as TLRLN and TBRLN, respectively. The treatment responses were assessed within 1 wk after full-course treatment according to RECIST version 1.1. Wilcoxon rank-sum tests were used to compare the PET/CT parameters between responders and nonresponders. Receiver operating characteristic curve analysis was used to assess the diagnostic efficacy of [68Ga]Ga-NOTA-GSI PET/CT parameters in identifying responders. Two-tailed P value of less than 0.05 was considered statistically significant. Results: We found that SUVmax-t, TLRtumor, TBRtumor, SUVmax-LN, and TBRLN were higher in responders than in nonresponders (2.49 ± 0.58 vs. 1.55 ± 0.48, P = 0.000; 2.24 ± 0.48 vs. 1.74 ± 0.67, P = 0.007; 1.38 ± 0.43 vs. 0.90 ± 0.23, P = 0.000; 2.24 ± 0.99 vs. 1.42 ± 0.55, P = 0.003; and 1.28 ± 0.68 vs. 0.83 ± 0.32, P = 0.012, respectively). According to receiver operating characteristic curve analysis, the area under the curve for SUVmax-t, TBRtumor, TLRtumor, SUVmax-LN, TLRLN, and TBRLN was 0.886, 0.866, 0.746, 0.772, 0.648, and 0.731, respectively. The threshold of SUVmax-t was 2.05, and its sensitivity and specificity were 81.0% and 84.2%, respectively. In addition, multivariate logistic regression indicated that TBRtumor was an independent predictor of treatment response (P = 0.03). Conclusion: Our results indicated that [68Ga]Ga-NOTA-GSI PET/CT is a promising tool for predicting early response to combined immunotherapy in gastric cancer patients.
Gastric cancer (GC) is the third leading cause of cancer-associated mortality. It has been reported that more than 1 million new GC cases and approximately 769,000 GC-associated deaths occurred in 2020 alone (1,2). The 5-y survival rate for advanced or metastatic GC patients is less than 20%, and the median overall survival is no more than a year (3). Unfortunately, the clinical efficacy of chemotherapy is limited because of the high risk of disease recurrence due to micrometastasis and multidrug resistance. In recent years, immunotherapy using immune checkpoint inhibitors has significantly improved progression-free and overall survival in diverse tumors (4). Clinical trials have indicated that nivolumab plus chemotherapy achieved superior overall survival compared with chemotherapy alone (13.8 vs. 11.6 mo), reducing the risk of death by 20%, in GC patients (5). Nivolumab, in combination with chemotherapy, has already been approved as the first-line therapy for advanced or metastatic GC. However, some GC patients fail to benefit from immunotherapy, and the overall efficacy rate remains at 30% (6). Therefore, it is crucial to find effective biomarkers or methods for the precise selection and early evaluation of suitable candidates for immunotherapy.
PD-L1 expression, tumor mutational burden, and microsatellite instability or mismatch repair status could serve as potential biomarkers for patients’ selection for immunotherapy and are obtained using tumor biopsy (7). However, the biopsy is an invasive procedure. In some cases, getting sufficient specimens for testing is difficult. Moreover, the temporal and spatial heterogeneity of the tumors and metastases affects the accuracy of the results. With the growing field of precision medicine, there is an urgent need to develop noninvasive approaches to accurately evaluate treatment response during immunotherapy.
[18F]FDG PET/CT is commonly used to evaluate treatment response in the clinic. However, it cannot differentiate between tumor progression and pseudoprogression (8,9). Radiotracers targeting immune biomarkers can specifically identify immunobiomarkers to reflect systemic immune responses (10). Clinical trials have demonstrated that [89Zr]Zr-atezolizumab could effectively reflect PD-L1 expression in tumors, and high tracer uptake is associated with better treatment response (11). Nevertheless, immune checkpoint pathway receptors are expressed heterogeneously in multiple body regions, and the radiotracers are found in secondary lymphoid tissues, which may limit the clinical diagnostic and prediction value.
Granzyme B is released from the vesicles during the cellular immune response by active CD8+ T cells and natural killer cells, which induce cancer cell death (12). Monitoring of granzyme B secretion would be more specific to measuring ongoing antitumor activity than monitoring of cell surface or intracellular markers. Larimer et al. (13,14) have developed a granzyme B–specific PET imaging agent (GZP) targeting murine and human granzyme B and demonstrated that GZP uptake could successfully stratify therapy responders from nonresponders during immunotherapy in preclinical studies. Similar to GZP, our probe targeting granzyme B, [68Ga]Ga-NOTA-Gly-Gly-Gly-Ile-Glu-Pro-Asp-CHO (GSI), was developed based on the granzyme B inhibitor IEPD-CHO. By changing certain amino acids, we tried to improve the in vivo affinity. Our previous study showed that uptake of [68Ga]Ga-NOTA-GSI and the target–to–normal tissue ratio increased significantly in B16F10 tumor–bearing mice after immunotherapy (15), suggesting that this radiotracer has the potential to be translated from animal research to clinical practice.
The clinical value of [68Ga]Ga-NOTA-GSI has not yet been systematically investigated in relatively large cohorts. In the present work, we initiated a prospective clinical study to explore whether [68Ga]Ga-NOTA-GSI PET/CT could evaluate early response to combined immunotherapy in advanced GC patients.
MATERIALS AND METHODS
Clinical Trial Design
The prospective study was approved by the Ethics Committee of Fudan University Shanghai Cancer Center (number 2201249-28) and registered online at the Chinese Clinical Trial Registry (ChiCTR2200062087). In total, 72 patients who were pathologically diagnosed with GC, confirmed by biopsy, and treated with combined immunotherapy were consecutively recruited from June 2022 to August 2023. All subjects signed an informed-consent form. The selection criteria were as follows: histologically confirmed GC, age of at least 18 y, good performance status (i.e., Eastern Cooperative Oncology Group score of 0–1), and recipient of chemotherapy plus immunotherapy (anti–PD-1 immunotherapy). The exclusion criteria for the final analysis were as follows: patients who had previously undergone radical gastrectomy, patients who had received radiotherapy or interventional therapy during immunotherapy, patients who could not fulfill full-course immunotherapy, patients with no measurable target lesions, patients lost on follow-up, and patients who had other malignant tumors. Patients who met the selection criteria and remained after the exclusion process were included in the final analysis. The patient enrollment flow diagram is shown in Figure 1.

Flowchart of patients’ enrollment in study.
Patients were treated with anti–PD-1 immunotherapy combined with chemotherapy (fluorouracil, leucovorin, oxaliplatin plus docetaxel, or capecitabine plus oxaliplatin) in a concurrent regimen. Sintilimab or carelizumab (200 mg) was intravenously injected in each treatment course, and the treatment interval was 21 d. The standard treatment regimen is generally 4–6 treatment courses. The number of specific treatment cycles needs be comprehensively judged according to the patient’s physical conditions. [68Ga]Ga-NOTA-GSI PET/CT imaging was performed within 1 wk at the end of the second or third course of treatment.
Radiolabeling of [68Ga]Ga-NOTA-GSI
The synthesis of [68Ga]Ga-NOTA-GSI (the granzyme B–specific inhibitor) is illustrated in Supplemental Figure 1 (supplemental materials are available at http://jnm.snmjournals.org). In brief, 40 µg of NOTA-GSI were dissolved in 1.5 M NaAc solution, and 5 mL of [68Ga]GaCl3 (740 MBq) elution were added. The final pH of the reaction was adjusted to pH 4, and the radiolabeling was performed at 40°C for 10 min. The product was analyzed using radio–thin-layer chromatography (1 M NH4Ac/CH3OH at a 1:1 ratio as the mobile phase and on instant thin-layer chromatography medium impregnated with silica gel).
[68Ga]Ga-NOTA-GSI PET/CT Scanning
For [68Ga]Ga-NOTA-GSI PET/CT, the injected activity was 148–185 MBq. Scanning was performed 30 min after injection with the PET/CT scanner (Biograph 16 HR; Siemens Medical Systems). PET images were taken from the head to the thigh. Spiral CT scan was conducted with an x-ray tube voltage peak of 120 kV, 140 mA, and a slice thickness of 3 mm. Then, a PET scan was performed with FlowMotion (Siemens Healthineers). PET data were reconstructed iteratively using ordered-subset expectation maximization iterative reconstruction with CT data for attenuation correction.
Image Analysis
Two experienced nuclear medicine physicians independently assessed the [68Ga]Ga-NOTA-GSI PET/CT images using the software (Taxus; Medivoly Technology). A third nuclear medicine physician with 15 y of experience resolved inconsistent assessments. Regions of interest were drawn on PET/CT images over the primary tumor and metastatic lymph nodes. The software automatically calculated the SUVmax and was used to quantify tracer uptake in the primary tumors and lymph nodes. The SUVmean of the liver and blood background was quantified with a 2-cm-diameter sphere in the liver and aorta, respectively. The target-to-liver background ratio (TLR) and target-to-blood background ratio (TBR) were calculated by dividing the SUVmax of the lesion by the background SUVmean obtained from the normal liver tissue and blood pool, respectively. Moreover, SUVmax was determined in healthy tissues (brain, lung, left ventricle, thoracic aorta, thigh muscle, kidney cortex, bone cortex, liver, thyroid, spleen, and bone marrow) to investigate the distribution of [68Ga]Ga-NOTA-GSI.
Response Evaluation
The treatment responses were assessed within 1 wk after full-course (4–6 cycles) combined immunotherapy according to RECIST version 1.1 on [18F]FDG PET/CT or contrast-enhanced CT. Responses were characterized as complete response, partial response, stable disease, and progressive disease. Patients with a complete or partial response were classified as responders, and patients with stable or progressive disease were classified as nonresponders.
Statistical Analysis
All statistical analyses were conducted using GraphPad Prism version 7 (GraphPad Software) and SPSS version 25.0 (IBM). SUVmax, TLR, and TBR were expressed as mean ± SD or median and interquartile range. Wilcoxon rank-sum tests were used to compare the PET/CT parameters between responders and nonresponders. We used the SPSS software to analyze the receiver operating characteristic curve and thus investigate the diagnostic efficacy of [68Ga]Ga-NOTA-GSI PET/CT parameters in identifying responders and nonresponders. PET/CT parameters and multiple clinical variables, such as age, stage, and histopathology, were tested by logistic regression analyses to determine the relationships between these variables and the treatment response. Nonparametric Spearman rank correlation was conducted to provide the degree of correlation between PET/CT parameters and treatment response. Two-tailed P value of less than 0.05 was considered statistically significant.
RESULTS
Synthesis and Quality Control of [68Ga]Ga-NOTA-GSI
NOTA-GSI was synthesized by solid-phase peptide synthesis and purified by semiprepared high-performance liquid chromatography. The structure of the product was confirmed by a liquid chromatograph mass spectrometer (Supplemental Fig. 2). The mass spectrometry result showed a molecular weight of 1,077.3, confirming the product NOTA-GSI. The radiochemical purity of [68Ga]Ga-NOTA-GSI was more than 97%. The retention time of [68Ga]Ga-NOTA-GSI was about 9.8 min, whereas the retention time of the labeled precursor NOTA-GSI was about 9.7 min (Supplemental Fig. 3). The retention times were consistent, indicating that the labeled product was [68Ga]Ga-NOTA-GSI.
Clinical Characteristics of the Included Patients
In total, 72 patients with histologically confirmed GC were prospectively enrolled and underwent the [68Ga]Ga-NOTA-GSI PET/CT scan. The [68Ga]Ga-NOTA-GSI mass injected per patient was 10–20 µg. Thirty-two patients were excluded from further analysis according to the exclusion criteria (Fig. 1). The clinicopathologic data for the remaining 40 patients are detailed in Table 1. Nineteen patients were classified as responders (47.5%), including 8 complete and 11 partial responses, and 21 were classified as nonresponders (52.5%), including 18 with stable disease and 3 progressive disease.
Overall Characteristics of Enrolled Patients
Safety Profiles and Imaging Patterns of [68Ga]Ga-NOTA-GSI PET
No patient experienced an anaphylactic reaction during or after the [68Ga]Ga-NOTA-GSI PET/CT scan. There were no drug-related pharmacologic effects or physiologic responses among the 72 patients. Supplemental Figure 4 demonstrates the biodistribution of [68Ga]Ga-NOTA-GSI in healthy tissues. Because [68Ga]Ga-NOTA-GSI showed renal elimination, the highest tracer uptake was observed in the bladder (306.30 ± 207.00) and kidney (3.56 ± 1.39). In addition, there was minimal physiologic distribution in the blood vessels (1.83 ± 0.49) due to the circulation of the radiopharmaceutical. Other normal tissues and organs showed low tracer uptake.
[68Ga]Ga-NOTA-GSI PET/CT Imaging Parameters
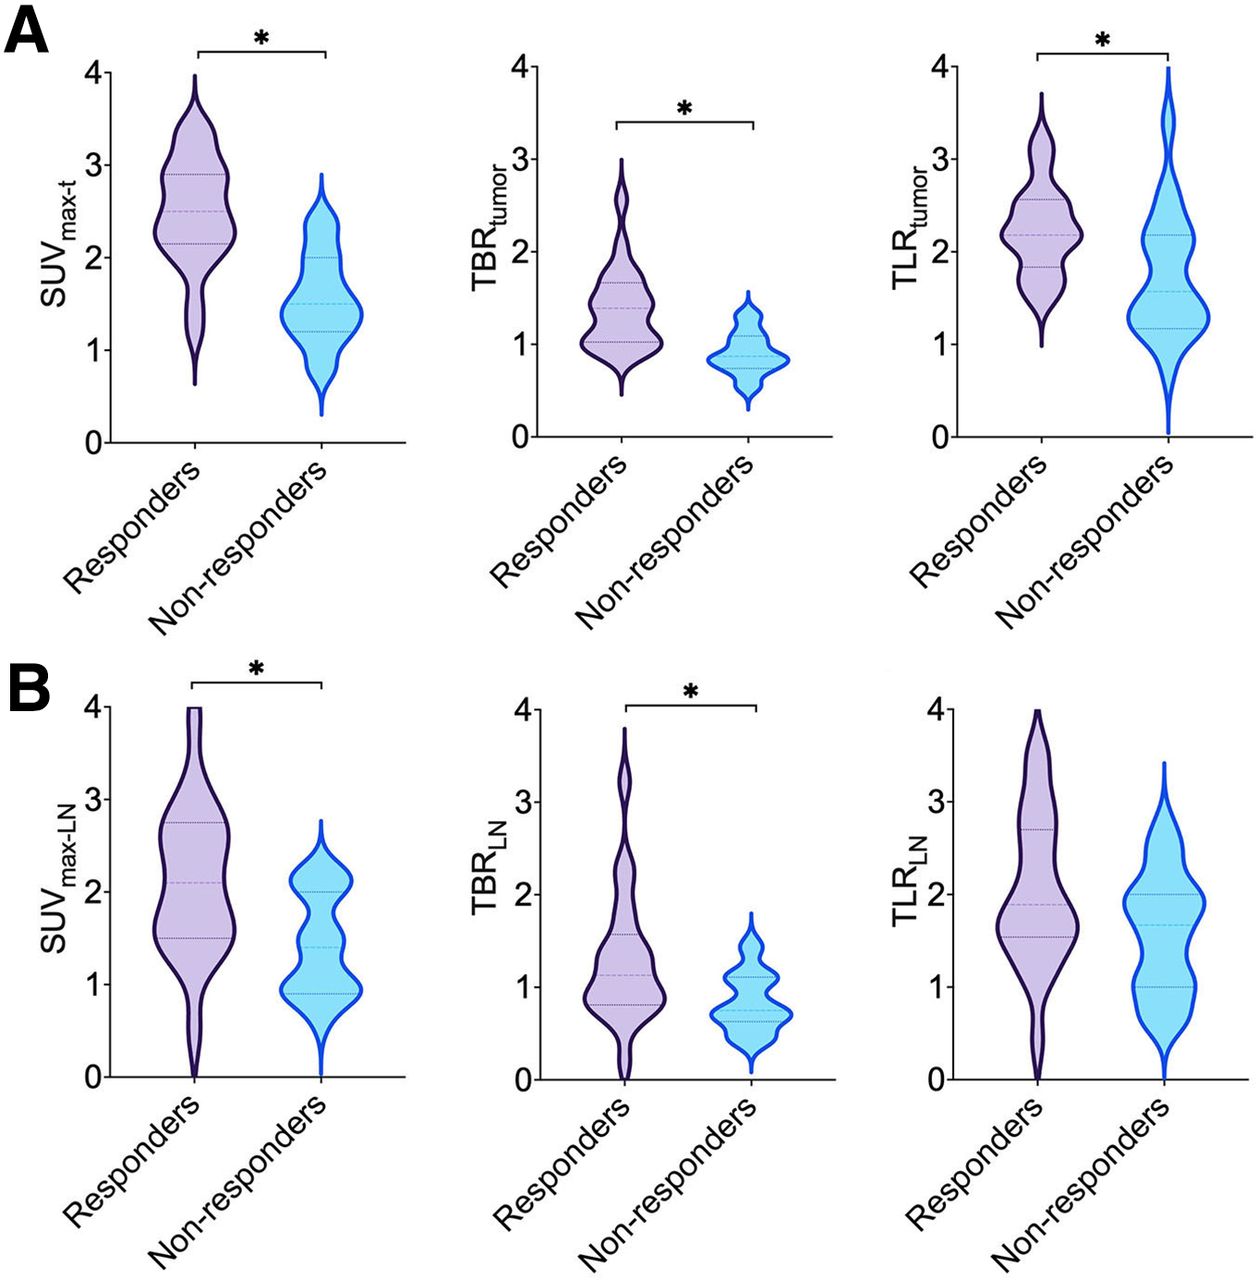
The quantitative [68Ga]Ga-NOTA-GSI PET/CT parameters of SUVmax, TLR, and TBR of primary tumors (SUVmax-t, TLRtumor, and TBRtumor, respectively) and SUVmax, TLR, and TBR of metastatic lymph nodes (SUVmax-LN, TLRLN, and TBRLN, respectively) are shown in Figure 2 and Supplemental Table 1 for all patients, both responders and nonresponders. SUVmax-t, TLRtumor, TBRtumor, SUVmax-LN, and TBRLN were significantly higher in responders than in nonresponders (P < 0.05). The differences in TLRLN between responders and nonresponders were statistically insignificant (P = 0.112). Moreover, there were no significant differences between SUVmax-t and SUVmax-LN (P = 0.127), TLRtumor and TLRLN (P = 0.257), and TBRtumor and TBRLN (P = 0.139). Representative PET/CT images of patients with complete response (Fig. 3), partial response (Fig. 4), and progressive disease (Fig. 5) are shown. Supplemental Figure 5 shows the follow-up contrast-enhanced CT images of 1 typical case (i.e., the case shown in Fig. 4) 3 mo after full-course combined immunotherapy. The images indicate that the primary tumor and lymph nodes with high uptake in interim [68Ga]Ga-NOTA-GSI PET/CT demonstrated a complete or partial response from the follow-up imaging with [18F]FDG PET/CT. By contrast, patients with negative uptake in [68Ga]Ga-NOTA-GSI PET/CT were finally assessed as having disease progression in the follow-up.

Distribution of parameters of [68Ga]-NOTA-GSI PET/CT in gastric tumors and metastatic lymph nodes. (A) SUVmax-t, TBRtumor, and TLRtumor. (B) SUVmax-LN, TBRLN, and TLRLN. *P < 0.05.

Typical example of [68Ga]Ga-NOTA-GSI PET/CT scan in 50-y-old man who received 3 courses of combined immunotherapy and presented with complete response after full-course combination immunotherapy. (A) Pretreatment [18F]FDG PET/CT showed tumor located in gastric antrum wall, with high [18F]FDG uptake (SUVmax, 9.2). (B) Interim [68Ga]Ga-NOTA-GSI PET/CT revealed high uptake of [68Ga]Ga-NOTA-GSI in tumor (SUVmax, 2.4). (C) After completing combined immunotherapy courses, patient underwent [18F]FDG PET/CT scan for final evaluation. Images showed regression of primary tumor and no positive [18F]FDG uptake in gastric antrum wall. Arrows point at tumor.

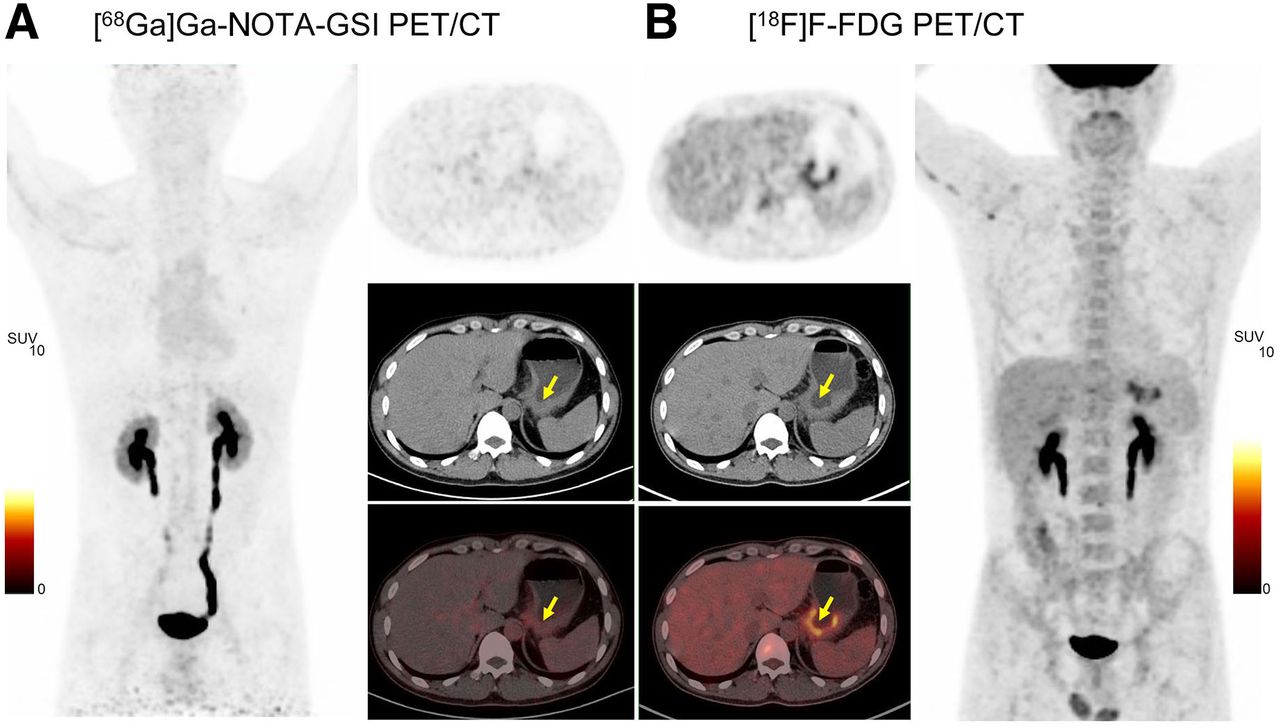
66-y-old man with gastric adenocarcinoma who received 4 courses of combined immunotherapy. (A) [68Ga]Ga-NOTA-GSI PET/CT demonstrated that tumor in gastric antrum (left) had high [68Ga]Ga-NOTA-GSI uptake (SUVmax, 3.2). Metastatic left supraclavicular (center) and retroperitoneal (right) lymph nodes also presented increased [68Ga]Ga-NOTA-GSI uptake (SUVmax, 3.9). (B) [18F]FDG PET/CT imaging at end of combination immunotherapy revealed that tumor shrank with nearly no [18F]FDG uptake (left). Left supraclavicular (center) and retroperitoneal (right) lymph nodes were significantly smaller than baseline with slight [18F]FDG uptake (SUVmax, 2.1). Arrows point at tumor.

40-y-old man with signet-ring cell carcinoma received 4 courses of combined immunotherapy. (A) Interim [68Ga]Ga-NOTA-GSI PET/CT revealed nearly no uptake of [68Ga]Ga-NOTA-GSI in tumor of gastric body (SUVmax, 1.3). (B) [18F]FDG PET/CT after combined immunotherapy showed tumor uptake of [18F]FDG was still high (SUVmax, 5.5), indicating active tumor and limited treatment efficacy. Arrows point at tumor.
[68Ga]Ga-NOTA-GSI PET/CT in Evaluating Response to Combined Immunotherapy
Receiver operating characteristic curve analysis was performed to evaluate the diagnostic accuracy of [68Ga]Ga-NOTA-GSI PET/CT parameters for identifying responders and nonresponders (Fig. 6); Table 2). The area under the curve for SUVmax-t and TBRtumor was 0.886 and 0.866, respectively (Table 2). Moreover, the area under the curve for SUVmax-t was higher than that of TLRtumor (P = 0.04) and TLRLN (P = 0.023). According to receiver operating characteristic curve analysis, the cutoff for SUVmax-t, TLRtumor, TBRtumor, SUVmax-LN, TLRLN, and TBRLN was 2.05, 2.25, 0.885, 1.65, 0.765, and 1.52, respectively. The sensitivity, specificity, and accuracy of SUVmax-t for predicting tumor response were 81.0%, 84.2%, and 82.5%, respectively. The calculated values for the sensitivity, specificity, positive predictive value, negative predictive value, and accuracy of these parameters are presented in Table 3.

Receiver operating characteristic (ROC) curves of [68Ga]Ga-NOTA-GSI PET/CT parameters. (A) SUVmax-t, TLRtumor, and TBRtumor. (B) SUVmax-LN, TLRLN, and TBRLN.
Area Under Curve of SUVmax-t, TLRtumor, TBRtumor, SUVmax-LN, TLRLN, and TBRLN for Predicting Tumor Response
Specificity, Sensitivity, and Accuracy of SUVmax-t, TLRtumor, TBRtumor, SUVmax-LN, TLRLN, and TBRLN
Associations Among Parameters, Clinical Factors, and Treatment Responses
Spearman ρ showed that treatment response was positively correlated with SUVmax-t (r = 0.669, P = 0.000), TBRtumor (r = 0.633, P = 0.000), TLRtumor (r = 0.425, P = 0.006), SUVmax-LN (r = 0.471, P = 0.002), and TBRLN (r = 0.399, P = 0.011). Clinical factors, including patients’ age, histopathology, and tumor location, and [68Ga]Ga-NOTA-GSI PET/CT parameters (SUVmax-t, TLRtumor, TBRtumor, SUVmax-LN, TLRLN, and TBRLN) were tested by logistic regression analyses. The result showed that only TBRtumor was a significant predictor of treatment response (P = 0.03) based on multivariate logistic regression analyses (Supplemental Table 2).
DISCUSSION
A noninvasive method measuring secreted granzyme B during immunotherapy can potentially guide patient management, especially response prediction. Here, we report a prospective clinical trial of [68Ga]Ga-NOTA-GSI PET/CT in patients with GC. In previous studies, PET/CT imaging with granzyme B tracers was highly accurate for predicting response in preclinical tumor models (16–19), which need further validation in clinical settings. The main findings of our study are as follows. First, clinical [68Ga]Ga-NOTA-GSI PET/CT imaging was safe and well tolerated. [68Ga]Ga-NOTA-GSI PET/CT imaging showed that [68Ga]Ga-NOTA-GSI was rapidly excreted by the kidneys, with the remaining signal mainly distributed in tumors and associated metastases. The background signal is low, producing images of high contrast and allowing good readout capabilities. Second, the results indicated that SUVmax-t, TLRtumor, TBRtumor, SUVmax-LN, and TBRLN were significantly higher in responders than in nonresponders. Third, in the receiver operating characteristic analysis, SUVmax-t, TLRtumor, TBRtumor, SUVmax-LN, and TBRLN showed a promising predictive value for the response to combined immunotherapy. Fourth, according to multivariable logistic regression analysis, TBRtumor was an independent predictor of immunotherapy efficacy in these patients. Therefore, specific parameters derived from interim [68Ga]Ga-NOTA-GSI PET/CT are valuable for evaluating the response to combined immunotherapy in patients with GC.
[18F]FDG PET/CT, the most commonly used probe in the clinic, has also been explored for early assessment of response to immunotherapy (20,21). Because [18F]FDG PET/CT cannot differentiate uptake between proliferative tumor cells and tumor-infiltrating immune cells, and some tumor types present nearly no [18F]FDG uptake, markers and associated molecular imaging tracers with high specificity and accuracy to assess therapeutic responses are needed. Granzyme B is a serine protease stored in the secretory granules of cytotoxic T cells and natural killer cells. On recognition of their target, T cells release granzyme. It targets caspase-3, caspase-8, and gastrin E, which are involved in caspase-dependent and caspase-independent apoptosis, necrosis, DNA fragmentation, and antitumor immunity (22). PET/CT tracers targeting granzyme B may have higher specificity than [18F]FDG in evaluating immunotherapy responses.
In recent years, some studies have demonstrated in several murine tumor models that granzyme B–targeting radiotracers [68Ga]Ga-NOTA-GZP and [18F]F-AlF-mNOTA-GZP may serve as quantitative predictive imaging biomarkers for immunotherapy (2,13,14). Zhou et al. (23) synthesized granzyme B–targeting precursors based on nonaldehyde peptidomimetics and developed [68Ga]Ga-grazytracer. They showed that [68Ga]Ga-grazytracer had significantly higher tumor uptake and contrast than [68Ga]Ga-NOTA-GZP at 0.5 h after immunotherapy. We have developed [68Ga]Ga-NOTA-GZP and have validated that [68Ga]Ga-NOTA-GSI PET/CT could reflect the immune activation state in preclinical tumor models (15,24). Moreover, the target–to–normal tissue ratio of [68Ga]-NOTA-GSI peaked (10.64 ± 0.52) at 6 d after combined immunotherapy in B16F10 tumor-bearing mice (15). The high specificity and tumor contrast of [68Ga]-NOTA-GSI make it promising for clinical translation. Here, our prospective study validated that [68Ga]-NOTA-GSI may be effective for evaluating early tumor responses to combined immunotherapy in GC patients.
Besides granzyme B, imaging immune checkpoint ligands (e.g., PD-1 or PD-L1) and cell surface or intracellular biomarkers (e.g., CD8) have drawn significant attention. The clinical trials showed that uptake of [89Zr]Zr-pembrolizumab and [89Zr]Zr-atezolizumab in tumor lesions correlated with tumor treatment response and patients’ prognosis (11,25). A previous study showed that [89Zr]Zr-Df-IAB22M2C PET/CT imaging could visualize the whole-body biodistribution of CD8+ leukocytes in tumors and reference tissues (26). Compared with these probes, [68Ga]Ga-NOTA-GSI has several advantages. On the one hand, radiolabeled full-length antibodies accumulate in the liver and the prolonged circulation time may cause nonspecific uptake of free [89Zr]Zr in bones, which affects the evaluation of lesions. As a small molecular tracer, [68Ga]Ga-NOTA-GSI exhibits enhanced distribution kinetics and more rapid clearance. On the other hand, unlike antibody or single-domain antibody-derived tracers, which have uptake in secondary lymphoid tissues such as the spleen, lymph nodes, and bone marrow, [68Ga]Ga-NOTA-GSI has a more favorable distribution pattern, and uptake was mainly found in tumors and metastatic lymph nodes.
Our study found that the average SUVmax-t and SUVmax-LN of the included patients were relatively low, 2.05 ± 0.71 and 1.85 ± 0.90, respectively. The reason may be that the fraction of cells producing granzyme B at a single time point may be small, and granzyme B tends to be unpredictable, diffusible, and located in the extracellular matrix. We conducted the scan in the middle course of combined immunotherapy to determine whether [68Ga]Ga-NOTA-GSI PET/CT could evaluate the response earlier. Whether there is a better time point for imaging remains to be further studied.
The present study has some limitations. First, this pilot prospective study was conducted in a single center with a limited sample size. Second, we investigated only the predictive efficacy of [68Ga]Ga-NOTA-GSI PET/CT for short-term response to combined immunotherapy. Further studies on the prognostic value of [68Ga]Ga-NOTA-GSI PET/CT should also be performed. More clinical studies, including ones with large cohorts of patients, are needed to reveal the value of [68Ga]Ga-NOTA-GSI PET/CT in therapy decisions for various types of cancers.
CONCLUSION
In the study, we demonstrated that interim [68Ga]Ga-NOTA-GSI PET/CT parameters (SUVmax-t, TLRtumor, TBRtumor, SUVmax-LN, and TBRLN) are promising in assessing treatment response to combined immunotherapy. Moreover, TBRtumor was an independent factor that predicted treatment response. Therefore, [68Ga]Ga-NOTA-GSI PET/CT may efficiently evaluate the short-term response to combined immunotherapy in GC patients.
DISCLOSURE
This work was partially supported by the National Key Research and Development Program of China (grant 2020YFA0909000) and the National Natural Science Foundation of China (grants 82001866 and 81971648). No other potential conflict of interest relevant to this article was reported.
KEY POINTS
QUESTION: Could [68Ga]Ga-NOTA-GSI PET/CT predict treatment response to combined immunotherapy in GC patients?
PERTINENT FINDINGS: In our prospective study, interim [68Ga]Ga-NOTA-GSI PET/CT parameters (SUVmax-t, TLRtumor, TBRtumor, SUVmax-LN, and TBRLN) are helpful in assessing treatment response to combined immunotherapy in GC patients.
IMPLICATIONS FOR PATIENT CARE: [68Ga]Ga-NOTA-GSI PET/CT may efficiently evaluate early response to combined immunotherapy in patients with GC.
Footnotes
Published online Oct. 10, 2024.
- © 2024 by the Society of Nuclear Medicine and Molecular Imaging.
REFERENCES
- Received for publication January 29, 2024.
- Accepted for publication September 9, 2024.
In this issue


Jump to section
Related Articles
Cited By...
- No citing articles found.