


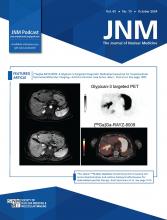
Visual Abstract

Abstract
This analysis aimed to identify clinical factors associated with positivity on repeat 68Ga-PSMA-11 PET/CT after a negative scan in patients with recurrent prostate cancer (PCa) under observation. Methods: This single-center, retrospective analysis included patients who underwent at least 2 68Ga-PSMA-11 PET/CT scans (PET1 and PET2) at UCLA between October 2016 and June 2021 for recurrent PCa with negative PET1 and no PCa-related treatments between the 2 scans. Using Prostate Cancer Molecular Imaging Standardized Evaluation criteria to define negative and positive scans, the final cohort was divided into PET2-negative (PET2-Neg) and PET2-positive (PET2-Pos). The same PET1 was used twice in the more than 2 PET cases with inclusion criteria fulfilled. Patient characteristics and clinical parameters were compared between the 2 cohorts using Mann–Whitney U test and Fisher exact test. Areas under the curve (AUCs) of the receiver operating characteristic and the Youden index were computed to determine the discrimination ability of statistically significant factors and specific cut points that maximized sensitivity and specificity, respectively. Results: The final analysis included 83 sets of 2 PET/CT scans from 70 patients. Thirty-nine of 83 (47%) sets were PET2-Neg, and 44 of 83 (53%) sets were PET2-Pos. Prostate-specific antigen (PSA) increased from PET1 to PET2 for all 83 (100%) sets of scans. Median PSA at PET1 was 0.4 ng/mL (interquartile range, 0.2–1.0) and at PET2 was 1.6 ng/mL (interquartile range, 0.9–3.8). We found higher serum PSA at PET2 (median, 1.8 vs. 1.1 ng/mL; P = 0.015), absolute PSA difference (median, 1.4 vs. 0.7 ng/mL; P = 0.006), percentage of PSA change (median, +270.4% vs. +150.0%: P = 0.031), and median PSA velocity (0.044 vs. 0.017 ng/mL/wk, P = 0.002) and shorter PSA doubling time (DT; median, 5.1 vs. 8.3 mo; P = 0.006) in the PET2-Pos cohort than in the PET2-Neg cohort. Receiver operating characteristic curves showed cutoffs for PSA at PET2 of 4.80 ng/mL (sensitivity, 34%; specificity, 92%; AUC, 0.66), absolute PSA difference of 0.95 ng/mL (sensitivity, 62%; specificity, 71%; AUC, 0.68), percentage of PSA change of a positive 289.50% (sensitivity, 48%; specificity, 82%; AUC, 0.64), PSA velocity of 0.033 ng/mL/wk (sensitivity, 57%; specificity, 80%; AUC, 0.70), and PSA DT of 7.91 mo (sensitivity, 71%; specificity, 62%; AUC, 0.67). Conclusion: Patients with recurrent PCa under observation after a negative 68Ga-PSMA-11 PET/CT scan with markedly elevated serum PSA levels and shorter PSA DT are more likely to have positive findings on repeat 68Ga-PSMA-11 PET/CT.
Approximately one third to half of patients with prostate cancer (PCa) will experience disease recurrence after definitive treatment (1). The term biochemical recurrence (BCR) is used in the clinical practice to indicate a rise in serum prostate-specific antigen (PSA) levels greater than 0.2 ng/mL after radical prostatectomy or a PSA of at least 2 ng/mL from nadir after radiation therapy (2–5). The guideline for PSA recurrence is less clear when the disease progresses and additional or alternative treatments are initiated. Serial PSA measurements represent a mainstay of PCa monitoring with higher serum levels associating with more widespread disease. However, PSA monitoring alone cannot provide information on the location of the recurrence (6). This is where imaging comes into play and can be used to guide metastasis-targeted treatments in patients experiencing BCR.
Prostate-specific membrane antigen (PSMA) PET/CT has emerged as an accurate imaging modality for PCa in the initial staging, BCR setting (7–10), and other clinical scenarios (11). The detection and localization of disease in the BCR setting is correlated to serum PSA levels. This can be as low as 30%–35% when PSA is less than 0.5 ng/mL and as high as 97%–98% when PSA is more than 5.0 ng/mL (7,9). Therefore, especially at low PSA levels, 68Ga-PSMA-11 PET/CT might not be able to detect and localize the disease despite rising serum PSA levels indicating BCR.
Although the prognostic value of a negative 68Ga-PSMA-11 PET/CT scan is being reported in patients with BCR (12–14), referring physicians may be hesitant to proceed with salvage therapies without a positive scan and opt for expectant management (i.e., observation) to repeat 68Ga-PSMA-11 PET/CT later. Therefore, understanding when to repeat imaging after a negative 68Ga-PSMA-11 PET/CT scan can provide meaningful information about the progression of disease and provide guidance to referring physicians for the clinical management of these patients (11,15,16). The aim of this study was to identify clinical factors associated with the positivity of repeat 68Ga-PSMA-11 PET/CT after a negative scan in patients with recurrent PCa who are under observation.
MATERIALS AND METHODS
Study Design
This is a single-center, retrospective analysis conducted on patients with PCa who underwent at least 2 68Ga-PSMA-11 PET/CT scans (PET1 and PET2) at UCLA and did not undergo PCa-related treatment between the 2 scans. The study was approved by the local institutional review board (number 20-000954), and because of the retrospective design, the need for written informed consent was waived.
Patients
Patients who underwent at least 2 68Ga-PSMA-11 PET/CT scans between October 2016 and July 2021 at UCLA as part of a prospective clinical trial (NCT03792841, NCT03515577, NCT04050215, NCT02940262, NCT04348682, NCT04282824, NCT03368547, NCT03042312, NCT03582774, and NCT03511664) or clinically after Food and Drug Administration approval of 68Ga-PSMA-11 (17) were retrospectively screened for this study. All patients who did not receive PCa-related treatment between the 2 68Ga-PSMA-11 PET/CT scans and had a negative PET1 were included in the current analysis. Patients who received new or continued PCa-related treatment, including hormone therapy, between the 2 68Ga-PSMA-11 PET/CT scans; whose clinical data, PCa treatment history, or PSA values were missing; and whose PET1 was positive were excluded from the analysis.
Clinical Variables
The clinical parameters collected from electronic medical records by 1 of the investigators included age at the time of PET1, initial PSA, prostate biopsy Gleason score, National Comprehensive Cancer Network risk group classification, type of initial treatment, prostatectomy Gleason score, pathologic stage, castration status at the time of PET1, time from the last treatment, time from the last hormonal treatment, time interval between PET1 and PET2, and serum PSA level at the time of each PET scan. Absolute PSA difference, percentage of PSA change, PSA velocity, and PSA doubling time (DT) between the 2 PET scans were calculated using PSA values from PET1 and PET2. PSA DT was calculated using the Memorial Sloan Kettering Cancer Center’s online PSA Doubling Time Calculating Tool (18).
68Ga-PSMA-11 PET Acquisition and Image Analysis
68Ga-PSMA-11 PET/CT image acquisition was performed according to current guidelines, as previously described (19,20). All 68Ga-PSMA-11 PET/CT scans were interpreted and reported by a board-certified nuclear medicine physician. The clinical reports were collected from electronic medical records. When available in the clinical report, Prostate Cancer Molecular Imaging Standardized Evaluation criteria were also used to define negative (no pathologic PSMA uptake on whole-body 68Ga-PSMA-11 PET/CT or miT0N0M0) and positive (presence of at least 1 area of pathologic PSMA uptake on whole-body 68Ga-PSMA-11 PET/CT).
Based on the results of PET2, patients were divided into 2 cohorts: PET2-negative (PET2-Neg) and PET2-positive (PET2-Pos). Patients were included in the analysis more than once if they underwent more than 2 68Ga-PSMA-11 PET/CT scans and fulfilled all inclusion and exclusion criteria using the same baseline PET1 and a different PET2. Throughout the article, we refer to the number of sets of 2 68Ga-PSMA-11 PET/CT scans rather than the number of patients.
Statistical Analysis
Patient characteristics and clinical variables are described as median and interquartile range (IQR) unless stated otherwise. Mann–Whitney U test for continuous variables and Fisher exact test for categoric variables were used to compare clinical parameters, including age at the time of PET1, initial PSA, prostate biopsy Gleason score, National Comprehensive Cancer Network risk group classification, type of initial treatment, prostatectomy Gleason score, pathologic stage, time from the last treatment, time from the last hormonal treatment, castration status at the time of PET1, time between PET1 and PET2, and PSA level at the time of each PET scan, absolute PSA difference, percentage of PSA change, PSA velocity, and PSA DT between PET2-Neg and PET2-Pos cohorts. The area under the curve (AUC) of the receiver operating characteristic (ROC) was computed to determine the discrimination ability of these PSA factors to classify PET2-Pos versus PET2-Neg patients. The Youden index was used to determine specific cut points that maximized sensitivity and specificity. Two-tailed P values of less than 0.05 were regarded as significant, and statistical analyses were performed using R version 4.1 (R Project for Statistical Computing).
RESULTS
Patients
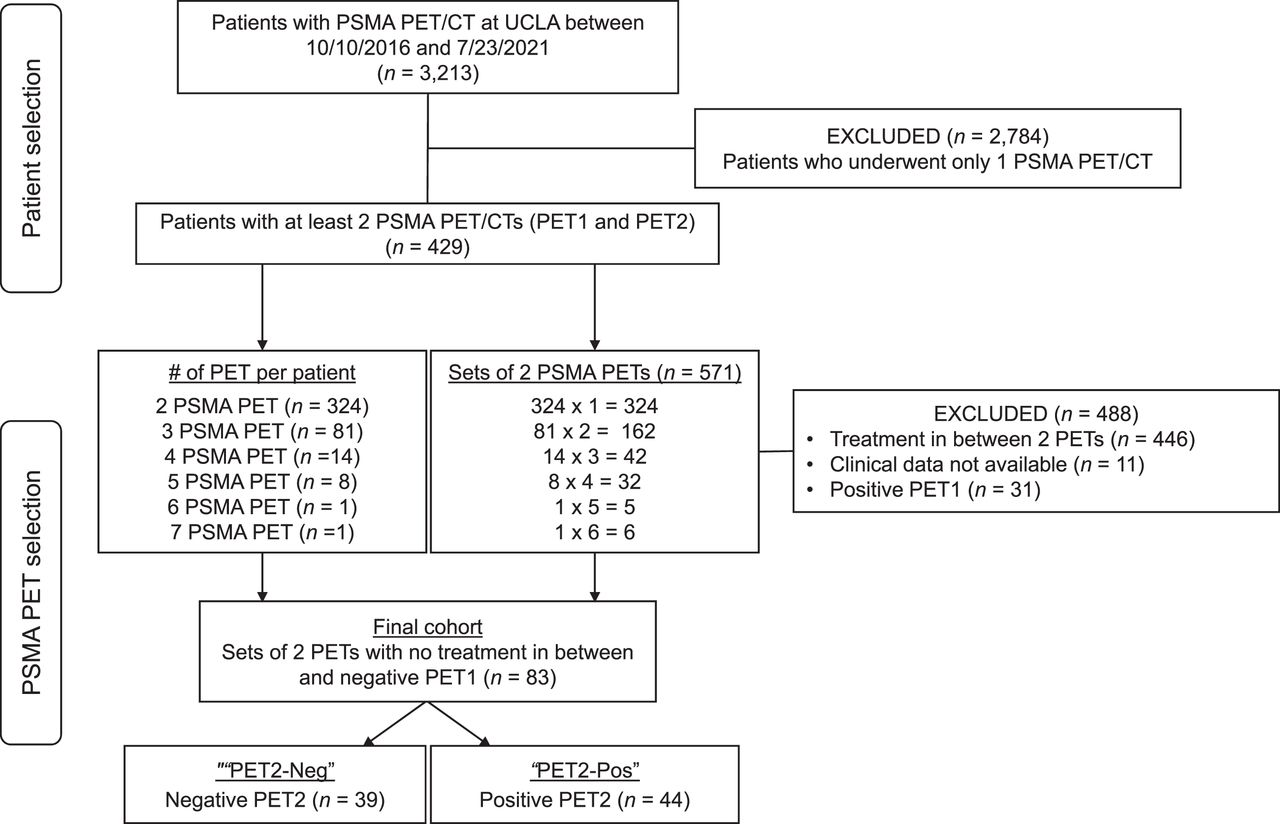
Between October 10, 2016, and July 23, 2021, 3,213 patients underwent a 68Ga-PSMA-11 PET/CT scan at UCLA, and 429 patients had at least 2 68Ga-PSMA-11 PET/CT scans, generating 571 sets of 2 68Ga-PSMA-11 PET/CT scans available for this analysis (Fig. 1). The final cohort consisted of 70 patients who generated 83 sets of 2 68Ga-PSMA-11 PET/CT scans. For each set of 68Ga-PSMA-11 PET/CT scans, PET1 was negative, and patients did not undergo PCa-related treatment between PET1 and PET2. The indications for PET1 were to assess the response of a previous treatment or to localize the recurrence of disease because of an increase in serum PSA levels. The indication for the repeat scan (PET2) was a new or further PSA increase, as reported in the clinicians’ notes.

Patient selection flowchart.
The clinical characteristics of the patients are shown in Table 1. With regard to prior treatments, 51 of the 83 (61.4%) sets of scans were from patients had at least 1 salvage treatment before the time of PET1. All 83 (100%) sets were from patients had a PSA increase from PET1 to PET2. In the PET2-Pos cohort, 5 of 44 (11.4%) scan sets showed local disease only (T+), 8 of 44 (18.2%) sets showed N1 disease with or without local disease, and 31 of 44 (70.5%) sets showed M1 disease with or without local or N1 disease on PET2 (Table 2). Of 31 scan sets showing M1 disease on PET2, 26 (83.9%) were for patients subsequently treated for their lesions shown on the scan, 2 (6.5%) led to continued observation, and 3 (9.7%) had no available data.
Patient Characteristics and Comparison of PET2-Neg and PET2-Pos Cohorts
68Ga-PSMA-11 PET2 Findings in PET2-Pos Cohort (n = 44)
Comparison of PET2-Neg and PET2-Pos Cohorts
There were 83 sets of 2 PET/CT scans, with 39 (47%) in the PET2-Neg cohort and 44 (53%) in the PET2-Pos cohort. As shown in Table 1, the PET2-Pos cohort had significantly higher PSA levels at PET2 (1.8 vs. 1.1 ng/mL, P = 015), absolute PSA difference (1.4 vs. 0.7 ng/mL, P = 0.006), percentage of PSA change (+270.4% vs. +150.0%, P = 0.031), and PSA velocity (0.044 vs. 0.017 ng/mL/wk, P = 0.002) and shorter PSA DT from PET1 to PET2 (5.1 vs. 8.3 mo, P = 0.006) than did the PET2-Neg cohort. Changes of PSA values tracked over time between PET1 and PET2 in the 2 cohorts are shown in Figure 2.

Visual representation of all PSA values tracked over time between PET1 and PET2 for PET2-Neg and PET2-Pos cohorts.
ROC Curve Analysis
As shown in Figure 3, ROC curve analysis showed that the best cutoffs able to predict positivity on PET2 were PSA at PET2 of 4.80 ng/mL (sensitivity, 34%; specificity, 92%; AUC, 0.66), absolute PSA difference of 0.95 ng/mL (sensitivity, 62%; specificity, 71%; AUC, 0,68), PSA percentage change of a positive 289.50% (sensitivity, 48%; specificity, 82%; AUC, 0.64), PSA velocity of 0.033 ng/mL/wk (sensitivity, 57%; specificity, 80%; AUC, 0.70), and PSA DT of 7.91 (sensitivity, 71%; specificity, 62%; AUC, 0.67).

ROC curve analysis to assess ability of clinical parameters to predict positivity on PET2.
DISCUSSION
In this retrospective study investigating patients with recurrent PCa under clinical observation who repeated 68Ga-PSMA-11 PET/CT after a first negative scan, PSA was a key clinical factor for positivity on repeat 68Ga-PSMA-11 PET/CT. Patients with positivity on PET2 had faster PSA velocities from PET1 to PET2 and a higher PSA level at the time of PET2 than did PET2-Neg patients. However, our findings are discordant with previously published work by Mjaess et al. (21), which retrospectively found that both PSA at the time of PET2 and PSA DT were not significantly associated with the positivity of the second 68Ga-PSMA-11 PET/CT scan after an initial negative scan. The reasons behind this difference are likely related to the cohort size (83 scan sets in our cohort vs. 29 patients in the Mjaess et al. cohort) and the homogeneity of the cohort, which included patients at various stages of disease in our cohort vs. patients at the same stage in Mjaess et al. (21).
Strong evidence of prescan PSA being an excellent predictor of a positive 68Ga-PSMA-11 PET/CT scan has been previously demonstrated by other groups (7,22,23). In our study, not only the PSA at PET2 but also other measures of PSA kinetics (absolute difference, percentage of change, velocity, and DT) were positively associated with the positivity of the repeat 68Ga-PSMA-11 PET/CT scan after a negative scan. In addition, we used ROC curve analysis to assess the ability of clinical parameters to predict positivity on PET2. The cutoff values identified for PSA at the time of PET2, absolute PSA difference, percentage of PSA change, PSA velocity, and PSA DT provided AUCs in the range of 0.64–0.70. Specifically, the identified cutoff values for PSA at the time of PET2 and for PSA percentage change had low sensitivity (<50%) and high specificity (82% and 92%, respectively). The high specificity can decrease the number of false-positives and guide clinicians in determining the best time to repeat 68Ga-PSMA-11 PET/CT after an initial negative scan for the purpose of initiating a new treatment. Approximately 70% of the population in the study with a repeat positive 68Ga-PSMA-11 PET/CT scan were positive for M1 disease, and at least 83.9% of them subsequently underwent treatment for the lesion or lesions identified on repeat 68Ga-PSMA-11 PET/CT. This finding suggests a potential high impact on management (Fig. 4 shows a case example from the study).

Case example from patient who underwent 3 PSMA PET/CT scans resulting in 2 sets of scans being included in analysis. 60-y-old man with PCa previously treated with radical prostatectomy in 2012 (Gleason score, 3 + 4 = 7, perineural invasion, pT3aN0Mx; PSA nadir, undetectable) and adjuvant radiation therapy to prostate bed in 2013 (PSA nadir, 0.01 ng/mL). First 68Ga-PSMA-11 PET/CT was obtained for PSA rise to 0.29 ng/mL and was negative. PSA rose further to 1.13 ng/mL 11 mo later without treatments (PSA difference, 0.84 ng/mL; PSA % increase, 289.7%; PSA DT, 5.8 mo), and repeated 68Ga-PSMA-11 PET/CT remained negative (PET2 in PET2-Neg cohort). Serum PSA levels continued rising to 14.3 ng/mL 23 mo after PET1 (PSA difference, 14.01 ng/mL; PSA % increase, 4831.0%; PSA DT, 4.2 mo all with PET1 as baseline), and third 68Ga-PSMA-11 PET/CT was obtained showing high PSMA expression in sclerotic lesions involving bilateral pubic bodies, right superior pubic ramus, and right acetabulum (mean SUVmax, 13.7; range, 5–476), consistent with osseous metastatic disease (red and green arrows, PET2 in PET2-Pos cohort).
The main limitation of this study is the retrospective nature, which implies a lack of homogeneous follow-up data on this population. Our cohort was heterogeneous and included patients at various stages of PCa and management plans that deviate from standard practice. For example, whereas current clinical guidelines advocate prompt salvage prostate bed radiation therapy in patients experiencing BCR after radical prostatectomy (24), our data reflect a real-life scenario in which the radiation oncologist or the patient often preferred to defer the salvage treatment and repeat 68Ga-PSMA-11 PET/CT for precise lesion localization. The relatively small sample size with different yet heavily skewed patient characteristics (i.e., initial treatment type and castration status) did not allow us to conduct subanalyses in these populations. The only clinical parameters that were found to be correlated to the positivity of the second scan were the aggregations of PSA values (i.e., difference, increase, velocity, and DT), which made composite analyses less meaningful and led us to focus on the impact of each PSA-related variable with ROC curves. However, the low sensitivity of using PSA parameters to predict positivity on PET2 can lead to higher numbers of false-negatives. This in turn may result in the exclusion of patients who may benefit from repeating a negative 68Ga-PSMA-11 PET/CT scan. Although our study cannot provide a definitive clinical threshold as to when repeat 68Ga-PSMA-11 PET/CT will be positive after a negative scan for recurrent PCa under observation, it can provide useful indications to treating physicians and guide their clinical management choices in the absence of a well-structured, prospective analysis.
CONCLUSION
Patients with recurrent PCa under observation after a negative 68Ga-PSMA-11 PET/CT scan with markedly elevated serum PSA levels and shorter PSA DT are more likely to have positive findings on repeat 68Ga-PSMA-11 PET/CT.
DISCLOSURE
Johannes Czernin is a founder of SOFIE Biosciences, founder of Trethera, on the medical advisory board of Amgen, and on the medical advisory board of RayzeBio. Jeremie Calais reports grants to his institution from Lantheus, Novartis, and POINT Biopharma. He also reports consulting activities (advisory boards, speaker, blinded reader) for Advanced Accelerator Applications, Amgen, Astellas, Bayer, Blue Earth Diagnostics Inc., Curium Pharma, DS Pharma, Fibrogen, GE Healthcare, Isoray, IBA RadioPharma, Janssen Pharmaceuticals, Monrol, Lightpoint Medical, Lantheus, Novartis, Nucleus Radiopharma, Pfizer, POINT Biopharma, Progenics, Radiomedix, Radiopharm Theranostics, Sanofi, Siemens-Varian, SOFIE, and Telix Pharmaceuticals, outside of the submitted work. No other potential conflict of interest relevant to this article was reported.
KEY POINTS
QUESTION: What clinical factors influence the positivity of repeat 68Ga-PSMA-11 PET/CT in patients with recurrent PCa under observation after a negative 68Ga-PSMA-11 PET/CT scan?
PERTINENT FINDINGS: Patients with a repeat positive 68Ga-PSMA-11 PET/CT scan had a higher PSA level at PET2, absolute PSA difference, percentage of PSA change, and PSA velocity and shorter PSA DT from PET1 to PET2 than those with a repeat negative 68Ga-PSMA-11 PET/CT scan.
IMPLICATIONS FOR PATIENT CARE: A repeat scan should be considered in patients with markedly elevated PSA or shorter PSA DT.
Footnotes
Guest Editor: Wolfgang P. Fendler, University of Duisburg–Essen
Published online Aug. 21, 2024.
- © 2024 by the Society of Nuclear Medicine and Molecular Imaging.
REFERENCES
- Received for publication March 3, 2024.
- Accepted for publication June 17, 2024.
In this issue


Jump to section
Related Articles
Cited By...
- No citing articles found.