


Visual Abstract

Abstract
The preoperative Gleason grade group (GG) from transrectal ultrasound–guided prostate biopsy is crucial for treatment decisions but may underestimate the postoperative GG and miss clinically significant prostate cancer (csPCa), particularly in patients with biopsy GG1. In such patients, an SUVmax of at least 12 has 100% specificity for detecting csPCa. In patients with an SUVmax of less than 12, we aimed to develop a model to improve the diagnostic accuracy of csPCa. Methods: The study retrospectively included 56 prostate cancer patients with transrectal ultrasound–guided biopsy GG1 and an SUVmax of less than 12 from 2 tertiary hospitals. All [68Ga]Ga-PSMA-HBED-CC PET scans were centrally reviewed in Xijing Hospital. A deep learning model was used to evaluate the overlap of SUVmax (size scale, 3 cm) and the level of Gleason pattern (size scale, 500 μm). A diagnostic model was developed using the PRIMARY score and SUVmax, and its discriminative performance and clinical utility were compared with other methods. The 5-fold cross-validation (repeated 1,000 times) was used for internal validation. Results: In patients with GG1 and an SUVmax of less than 12, significant prostate-specific membrane antigen (PSMA) histochemical score (H-score) H-score overlap occurred among benign gland, Gleason pattern 3, and Gleason pattern 4 lesions, causing SUVmax overlap between csPCa and non-csPCa. The model of 10 × PRIMARY score + 2 × SUVmax exhibited a higher area under the curve (AUC, 0.8359; 95% CI, 0.7233–0.9484) than that found using only the SUVmax (AUC, 0.7353; P = 0.048) or PRIMARY score (AUC, 0.7257; P = 0.009) for the cohort and a higher AUC (0.8364; 95% CI, 0.7114–0.9614) than that found using only the Prostate Imaging Reporting and Data System (PI-RADS) score of 5–4 versus 3–1 (AUC, 0.7036; P = 0.149) and the PI-RADS score of 5–3 versus 2–1 (AUC, 0.6373; P = 0.014) for a subgroup. The model reduced the misdiagnosis of the PI-RADS score of 5–4 versus 3–1 by 78.57% (11/14) and the PI-RADS score of 5–3 versus 2–1 by 77.78% (14/18). The internal validation showed that the mean 5-fold cross-validated AUC was 0.8357 (95% CI, 0.8357–0.8358). Conclusion: We preliminarily suggest that the model of 10 × PRIMARY score + 2 × SUVmax may enhance the diagnostic accuracy of csPCa in patients with biopsy GG1 and an SUVmax of less than 12 by maximizing PSMA information use, reducing the misdiagnosis of the PI-RADS score, and thereby aiding in making appropriate treatment decisions.
The International Society of Urological Pathology Gleason grade group (GG) before radical prostatectomy (RP) is a key factor in determining the appropriate treatment for prostate cancer (PCa). Transrectal ultrasound (TRUS)–guided prostate biopsy is the standard of care for obtaining preoperative GG (1). However, this approach has the limitation that it can potentially underestimate the true GG because of biopsy undersampling, leading to the misclassification of clinically significant PCa (csPCa) as indolent PCa, especially in patients with TRUS-guided biopsy GG1. According to a large-scale study with 17,598 cases, 55.7% of biopsy GG1 patients have experienced GG upgrading after RP (2). It is important to differentiate between indolent PCa and csPCa to determine the most appropriate treatment. Active surveillance is typically recommended for patients with indolent PCa, whereas curative treatment is the preferred option for csPCa (1). Therefore, multiple previous studies have attempted to identify csPCa patients using clinical and biopsy GG parameters (3). However, studies with large sample sizes, including 7,643 patients (4) and 10,089 patients (5), have concluded that clinical and pathologic morphology information alone is insufficient to accurately predict csPCa. It is necessary to include additional imaging or molecular information to improve the diagnostic performance (6). Previous studies have reported that the Prostate Imaging Reporting and Data System (PI-RADS) score had a diagnostic area under the curve (AUC) of only 0.672–0.694 for detecting csPCa in patients with biopsy GG1 (7,8). Consistent with this, the European Association of Urology guideline pointed out that the MRI PI-RADS score has low specificity in very low-risk patients, which can result in a higher incidence of false-positive results and necessitate further optimization (1).
In recent years, [68Ga]Ga-PSMA-HBED-CC ([68Ga]PSMA) PET/CT has gained recognition as a precise molecular imaging approach for PCa detection (9). Studies have indicated that prostate-specific membrane antigen (PSMA) intensity positively correlated with GG (10) and tumorigenic molecular events (11). SUVmax can provide intraprostatic pathologic information and has the potential to improve the performance of existing nomograms for identifying csPCa. The PRIMARY study also demonstrated that an SUVmax of at least 12 had 100% specificity for csPCa (12).
However, the problem with using SUVmax for csPCa detection among patients with biopsy GG1 is the overlap of SUVmax between csPCa (mainly GG2 through GG3) and non-csPCa (benign prostate disease or GG1 PCa). This makes it difficult to accurately detect csPCa among patients with biopsy GG1 and an SUVmax of less than 12 (13). In addition, the diagnostic performance of the PRIMARY score for patients with biopsy GG1 warrants further research. Therefore, the aim of this study was to analyze the overlap of SUVmax (size scale, 3 cm) on Gleason pattern (GP, the basic component of GG) level (size scale, 500 μm) and develop a csPCa-predicting model based on both the SUVmax and the PRIMARY score. This model aimed to improve the diagnostic accuracy of csPCa in patients with biopsy GG1 and an SUVmax of less than 12. In addition, the quantitative relationship among the PRIMARY score, SUVmax, and csPCa risk was presented using a contour plot.
MATERIALS AND METHODS
Participants
We performed a retrospective review of 1,003 consecutive patients who underwent [68Ga]PSMA PET/CT from June 2017 to June 2022 at Xijing Hospital and Nanjing Drum Tower Hospital in China. Patients were included if they were suspected to have PCa on the basis of a prostate-specific antigen test or digital rectal examination and underwent [68Ga]PSMA PET/CT. Patients were excluded if [68Ga]PSMA PET/CT was performed after pharmacotherapy or surgery, there was an absence of biopsy GG information, the SUVmax was at least 12, the biopsy result was not GG1, and there was an absence of RP GG information. Ultimately, 56 patients were included in the analysis. The institutional review board (Ethics Committees of Xijing Hospital, Fourth Military Medical University) approved this study, and all subjects signed a written informed consent form.
PET Imaging Protocols and Image Interpretation
The [68Ge]/[68Ga] generator was from ITG Co., and the PSMA-HBED-CC ligand was from ABX Co. Patients were prepared and PET images were acquired according to the procedure guideline (Supplemental Table 1 [supplemental materials are available at http://jnm.snmjournals.org]) (14). All [68Ga]PSMA PET/CT images were reviewed by 2 experienced nuclear medicine specialists according to the guideline (15) in Xijing Hospital. The PRIMARY scores were evaluated according to the previous PRIMARY study (13).
MRI Acquisition Protocol and Imaging Evaluation
The protocol consisted of T1-weighted imaging, T2-weighted imaging, and diffusion-weighted imaging sequences. All MR images were analyzed according to Pl-RADS version 2.1 (16) by 2 urologic radiologists. Interrater agreement was evaluated with Cohen κ and associated 95% CI.
Histopathologic Examination
All patients underwent TRUS-guided prostate biopsy and RP. csPCa was diagnosed if malignancy of at least GG2 was present. All pathologic results were reported according to the International Society of Urological Pathology guideline (17). The descriptions for the deep learning model, immunohistochemistry analysis (18,19), and International Society of Urological Pathology grading system are provided in the supplemental materials (Supplemental Table 2).
Statistical Analysis
In addition to basic descriptive statistics, a contour plot was used to depict csPCa probability according to PSMA PET SUVmax and the PRIMARY score. The methods for imputation of missing data (20), model development, and subgroup analysis (21–23) are provided in the supplemental materials. All tests were 2-sided, and statistical significance was set at a P value of less than 0.05. All statistical analyses were performed using R (version 4.1.1; R Foundation for Statistical Computing).
RESULTS
Baseline Characteristics
In total, 56 patients were included in the study (Fig. 1). The baseline characteristics of these patients are shown in Table 1. The mean time between [68Ga]PSMA PET/CT examination and RP was 13.4 d (range, 1–61 d).

Flowchart of study design.
Demographic and Clinical Characteristics of 56 Patients Investigated in This Study
Performance of PI-RADS Score in Discrimination Between Non-csPCa and csPCa
MRI results were available for analysis for 47 of 56 (83.93%) patients in the study. In contrast to biopsy GG1, indicating non-csPCa, 51.06% (24/47; PI-RADS, 5–4) or 80.85% (38/47; PI-RADS, 5–3) of these patients had a positive PI-RADS result, indicating csPCa (Supplemental Table 3). Furthermore, the false-positive rate of the PI-RADS score ranged from 33.33% (8/24; PI-RADS, 5–4 vs. 3–1) to 44.74% (17/38; PI-RADS, 5–3 vs. 2–1), and the false-negative rate ranged from 11.11% (1/9; PI-RADS, 5–3 vs. 2–1) to 26.09% (6/23; PI-RADS, 5–4 vs. 3–1). The AUC for detecting csPCa was only 0.7036 (95% CI, 0.5703–0.8370; PI-RADS, 5–4 vs. 3–1) and 0.6373 (95% CI, 0.5339–0.7407; PI-RADS, 5–3 vs. 2–1). Similar findings were reported in previous studies (Supplemental Table 3) (7,8,24,25). In addition, Cohen κ for the MRI evaluation was 0.763 (95% CI, 0.544–0.982) for a PI-RADS score of 5–4 versus 3–1 and 0.957 (95% CI, 0.875–1) for a PI-RADS score of 5–3 versus 2–1. For the 5-point PI-RADS, Cohen κ was 0.786 (95% CI, 0.650–0.920).
Overlap of SUVmax in Discrimination Between Non-csPCa and csPCa
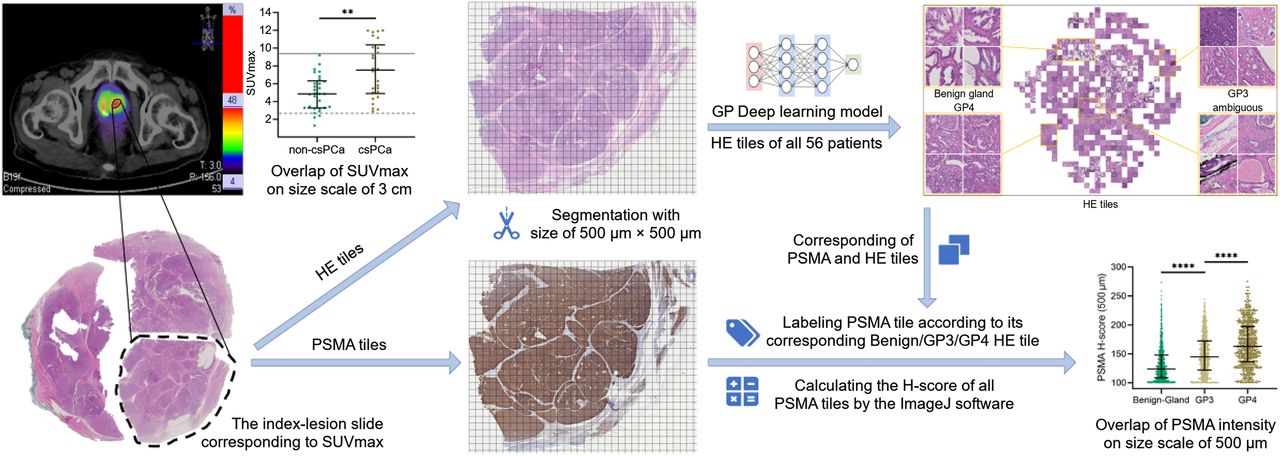
As shown in Figure 2, csPCa had a significantly higher SUVmax than that of non-csPCa (7.52 ± 3.13 vs. 4.91 ± 1.96, P = 0.002). In addition, all lesions with an SUVmax of less than 2.9 (dashed gray line) were non-csPCa, and all lesions with an SUVmax of greater than 9.2 (solid gray line) were csPCa. However, there was an overlap of SUVmax between 2.9 and 9.2, which reduced the diagnostic performance of SUVmax. The GG of the index lesion (size scale, 3 cm) was composed of different ratios of GPs (size scale, 500 μm) (26). On the level of GP, we classified hematoxylin-eosin tiles into benign gland, GP3, and GP4 by the deep learning model (Supplemental Fig. 1) and found that the mean PSMA histochemical scores (H-scores) of benign gland, GP3, and GP4 were 132.03 (±29.80), 149.10 (±33.77), and 166.69 (±38.70), respectively (Fig. 2). There were significant overlaps of PSMA H-scores among tiles of benign gland, GP3, and GP4. Because of such overlaps, the AUC of SUVmax was limited as 0.7353 (95% CI, 0.6006–0.8699).

Overlap of SUVmax and overlap of PSMA intensity in patients with TRUS-guided biopsy GG1 and SUVmax < 12. Distribution of [68Ga]PSMA PET/CT SUVmax demonstrated higher SUVmax in csPCa than in non-csPCa. However, between values of 2.9 (dashed gray line) and 9.2 (solid gray line), there was SUVmax overlap between csPCa and non-csPCa. Subsequently, 56 patients’ index-lesion slides corresponding to SUVmax were selected and made into 2 consecutive tissue sections. After this, 2 consecutive tissue sections were subjected to hematoxylin-eosin and PSMA immunohistochemistry staining and digital scanning. Resulting hematoxylin-eosin and PSMA images were segmented into 500 × 500 μm tiles. Deep learning was used to identify and cluster hematoxylin-eosin tiles, whereas PSMA tiles were matched with their corresponding hematoxylin-eosin tiles on basis of sample name and spatial coordinates of 2 consecutive tissue sections. Finally, according to categories of hematoxylin-eosin tiles, PSMA tiles were correspondingly labeled benign gland, GP3, and GP4 and randomly selected (n = 1,000 for each category) to calculate PSMA H-score using ImageJ software (National Institutes of Health). **P < 0.01 by Mann–Whitney test (overlap of SUVmax) and Kruskal–Wallis test (overlap of PSMA intensity). ****P < 0.0001 by Mann–Whitney test (overlap of SUVmax) and Kruskal–Wallis test (overlap of PSMA intensity). HE = hematoxylin-eosin.
Performance of PRIMARY Score in Discrimination Between Non-csPCa and csPCa
A tumor located in the anterior apex region was easily underestimated because the prostate needle biopsy had difficulty reaching into the anterior location in TRUS-guided biopsy, resulting in prostatic evasive anterior tumors (27). In the current cohort, the SUVmax and PRIMARY score screened out 66.67% (2/3) and 100.00% (3/3) of prostatic evasive anterior cases, respectively. As shown in Figure 3, the representative case was previously classified as indolent PCa (prostate-specific antigen, 4.56 ng/mL; biopsy GG1; 1/13 positive core) and would be recommended for active surveillance on the basis of the guideline (1). Because of its PRIMARY score of 4 and SUVmax of 10.1, RP was finally performed and the RP pathologic result proved to be csPCa (at least GG2).

Representative case of prostatic evasive anterior tumor shown on [68Ga]PSMA PET/CT in axial, coronal, and sagittal views (from left to right). Representative case was previously underestimated as indolent PCa on basis of TRUS-guided biopsy result (biopsy GG1 and 1/13 positive core). [68Ga]PSMA PET/CT (PRIMARY score, 4; SUVmax, 10.1) identified case as csPCa (RP GG2).
However, the AUC of the PRIMARY score was limited to 0.7256 (95% CI, 0.6159–0.8354). Its false-negative rate was 15% in the PRIMARY score of 1–2 and its false-positive rate was 86% and 25% in the PRIMARY scores of 3 and 4, respectively (Supplemental Fig. 2). It is necessary to develop a csPCa-predicting model incorporating both the SUVmax and the PRIMARY score to further improve the diagnostic performance of [68Ga]PSMA PET/CT.
Development and Internal Validation of [68Ga]PSMA PET/CT-Based Diagnostic Model
We developed a diagnostic model based on the PRIMARY score (P = 0.010), TRUS imaging result (P = 0.045), and SUVmax (P = 0.147), even though the SUVmax did not have a P value of less than 0.05 in the multivariate logistic analysis (Supplemental Table 4). The missing values were imputed (Supplemental Fig. 3).
The PRIMARY scores were treated as ordered categoric variables, whereas the SUVmax was treated as a continuous variable. Restricted cubic spline functions of the continuous variables showed SUVmax can be modeled as a continuous linear variable (nonlinearity, P = 0.2111). Furthermore, in the subgroup analysis of the peripheral zone and transition zone of the study population, a linear relationship between SUVmax and csPCa risk was maintained (Supplemental Fig. 4). No interaction terms were found by the interaction tests. The coefficients for the PRIMARY score, SUVmax, and TRUS imaging result were calculated using logistic analysis and multiplied by 10. Finally, 2 models were developed.
Model 1
Linear predictor = 10 × PRIMARY score + 2 × SUVmax. The coefficients were rounded to the nearest integer to create a user-friendly model.
Model 2
Linear predictor = 8.4 × PRIMARY score + 1.7 × SUVmax + 15.1 × TRUS. The coefficients were rounded to 1 decimal to improve accuracy.
The Akaike information criterion and AUC values for models 1 and 2 are shown in Supplemental Table 5. Compared with model 1 (AUC, 0.8359), model 2 (AUC, 0.8615) only slightly improved the Akaike information criterion and AUC values, with the TRUS imaging result as the additional predictor (P = 0.367) (Supplemental Table 5). To develop an easy-to-use risk assessment tool, model 1 was selected as the final model. A diagnostic model based on these findings was created for individual csPCa risk assessment (Fig. 4A). The relationship among the SUVmax, PRIMARY score, and csPCa probability was depicted in a contour plot (Fig. 4B). The calibration plot indicated that the model had good calibration, with a Hosmer–Lemeshow P value of 0.9115 and a Brier score of 0.162 (Supplemental Fig. 5). In internal validation, the mean 5-fold cross-validated AUC (repeated 1,000 times) was 0.8357 (95% CI, 0.8357–0.8358).

Relationships among SUVmax, PRIMARY score, and csPCa probability. (A) Nomogram of model of 10 × PRIMARY score + 2 × SUVmax for individual csPCa prediction. (B) Contour plot of csPCa probability according to 10 × PRIMARY score and 2 × SUVmax.
Comparison of Diagnostic Performance of Model 1 and Other Methods
The AUC of the model was significantly higher than that of the SUVmax (0.8359 vs. 0.7353, P = 0.048) and PRIMARY score (0.8359 vs. 0.7257, P = 0.009) (Table 2). As shown in Supplemental Figure 6A, decision curve analysis indicated that the net benefit of the model was similar to that of the PRIMARY score at low-risk thresholds (0%–40%). However, at high-risk thresholds (40%–90%), the net benefit of model 1 was superior to that of other methods. At a risk threshold of 50%, the difference of net benefit between model 1 and the PRIMARY score was 0.143 (0.268–0.125). Therefore, use of model 1 would lead to 14.3% (0.143/[0.50/0.50]) fewer false-positive csPCa reports with no increase in the number of false-negative csPCa reports compared with the PRIMARY score (Supplemental Fig. 6A).
Comparison of Performance and Discriminative Ability of Model 1 and Other Diagnostic Methods
In the MRI subgroup, model 1 also outperformed the PI-RADS score, with a higher AUC for a PI-RADS score of 5–4 versus 3–1 (AUC, 0.8364 vs. 0.7036; P = 0.149) and a PI-RADS score of 5–3 versus 2–1 (AUC, 0.8364 vs. 0.6373; P = 0.014) (Table 2) and with greater net benefit (Supplemental Fig. 6B). Figure 5 displays 2 typical cases in which model 1 corrected misdiagnoses in the PI-RADS score. Overall, model 1 reduced misdiagnoses of PI-RADS (5–4 vs. 3–1) by 78.57% (11/14) and PI-RADS (5–3 vs. 2–1) by 77.78% (14/18) (Supplemental Table 6). Furthermore, the discriminative performance and clinical utility of model 1 were better in almost all subgroups (Supplemental Tables 7–10; Supplemental Figs. 7 and 8).

Correction of misdiagnoses by model 1. (A) Patient with PI-RADS score of 3, biopsy GG1, PRIMARY score of 4, SUVmax of 5.5, and positive model 1 score of 51 (∼60% csPCa probability). Lesion pointed at with arrow was missed by MRI but was detected by PRIMARY score and model 1. Postoperative pathology confirmed csPCa (GG2). (B) Patient with PI-RADS score of 4, PRIMARY score of 3, SUVmax of 6.26, and negative model 1 score of 42.52 (∼40% csPCa probability). Lesion pointed at with arrow was identified as csPCa by PI-RADS score and PRIMARY score but was suggested as non-csPCa by model 1. Postoperative pathology confirmed non-csPCa (type of benign prostatic disease called atypical adenomatous hyperplasia). ADC = apparent diffusion coefficient; DWI = diffusion-weighted imaging; HE = hematoxylin-eosin.
DISCUSSION
In a cohort of 56 patients with TRUS-guided biopsy GG1 and a [68Ga]PSMA PET/CT SUVmax of less than 12, we developed and internally validated the model of 10 × PRIMARY score + 2 × SUVmax to predict the probability of csPCa with better diagnostic performance than the PRIMARY score, SUVmax, and PI-RADS alone. The current study visualizes the relationships among the SUVmax, PRIMARY score, and csPCa probability with a contour plot; analyzes SUVmax overlap among patients (size scale, 3 cm) based on the level of GP (size scale, 500 μm); and enhances the diagnostic accuracy of csPCa by developing a predictive model based on PSMA PET parameters for patients with biopsy GG1 and an SUVmax of less than 12.
The European Association of Urology guideline recommended routine MRI for suspected PCa patients. PI-RADS demonstrated adequate diagnostic accuracy for csPCa detection, with pooled sensitivity of 0.91 (95% CI, 0.83–0.95) and specificity of 0.37 (95% CI, 0.29–0.46) (1). However, the guideline highlighted that MRI in very low-risk patients could lead to more false-positive reports because of low specificity. In this study, 33.33% (PI-RADS, 5–4 vs. 3–1) or 44.74% (PI-RADS, 5–3 vs. 2–1) of reports were false-positive. Previous studies reported similar false-positive rates of 25.87%–39.33%. Meanwhile, the false-negative rates in this study and prior research were between 11.11% and 54.65% (7,8). In addition, in this study, despite biopsy GG1 suggesting non-csPCa, 51.1% (PI-RADS, 5–4) and 80.85% (PI-RADS, 5–3) of patients had positive PI-RADS scores, indicating csPCa. Similarly, recent studies have reported that the positive rate of PI-RADS ranged from 13.21% to 50.71% in patients with biopsy GG1 (24,25). Because misdiagnoses of the PI-RADS score could lead to inappropriate treatment decisions, improving the diagnostic performance for csPCa in patients with biopsy GG1 was essential.
[68Ga]PSMA PET/CT is useful for evaluating the entire prostate, identifying the location of lesions, and providing additional pathologic information in the early stage of disease. This method may be particularly helpful in addressing the diagnostic challenges of TRUS-guided biopsy. Therefore, it is necessary to incorporate [68Ga]PSMA PET/CT parameters in the csPCa-predicting model for patients with TRUS-guided biopsy GG1. In previous research, a positive correlation had been found between SUVmax and GG (10). A study that reviewed 419 patients with biopsy results of no more than GG2 demonstrated that only 10% of cases with an SUVmax of no more than 5 were upgraded compared with 90% of cases with an SUVmax of more than 11 (28). However, SUVmax alone may not be sufficient for detecting csPCa in the current population because of significant overlap of SUVmax among patients with GG2 through GG3 and GG1 or benign (13). The GG was reported on the basis of the whole tumor lesion (size scale, 3 cm) via the microscopic examination by pathologists, and the whole tumor lesion was composed of different ratios of benign prostate tissue, GP3, GP4, and Gleason pattern 5 tiles (size scale, 500 μm) (Fig. 2) (26). On the GP level, we found significant overlap of PSMA H-scores among the tiles of benign gland, GP3, and GP4, resulting in the overlap of SUVmax between patients with GG2 through GG3 and GG1 or benign.
The anterior apex region often contains csPCa, but taking a TRUS-guided biopsy sample of this region can be painful and challenging because of its location. If not adequately sampled, it can lead to prostatic evasive anterior csPCa and GG upgrading (27). We found the PRIMARY score is effective in identifying such prostatic evasive anterior csPCa. However, further optimization is needed for the PRIMARY score method in csPCa detection. In patients with biopsy GG1, the false-positive rate of the PRIMARY scores (scores 3 and 4) was 38.5% (20/52) in the PRIMARY study (13) and 43.3% (13/30) in the current study. In addition, the false-negative rate of the PRIMARY scores (scores 1 and 2) was 11.5% (3/26) in the current study.
Considering that the SUVmax and PRIMARY score represent the level and anatomic location of PSMA expression, respectively, a comprehensive model is crucial for csPCa prediction instead of relying solely on either factor. As a result, we introduced a user-friendly model that integrates both the SUVmax and the PRIMARY score, maximizing PSMA information use and ultimately improving diagnostic accuracy for csPCa in patients with biopsy GG1.
Previous studies have suggested that the combined use of PSMA PET SUVmax and PI-RADS can accurately identify csPCa and potentially allow a biopsy-free strategy for specific patients (12,29). Similarly, when our model was used as a complementary diagnostic approach with PI-RADS, misdiagnosis was reduced.
This study had limitations, such as including only biopsy GG1 patients who underwent RP, which could introduce participation bias. PSMA PET/CT examinations were typically performed on patients with positive results from other tests, potentially causing verification bias and enhancing sensitivity of PSMA PET/CT-based parameters. In addition, the sample size remains small for developing a nomogram. To address this limitation, a prospective study or external validation is needed to confirm the conclusions of the current study.
CONCLUSION
This study preliminarily suggests using the model of 10 × PRIMARY score + 2 × SUVmax as a complementary diagnostic approach to PI-RADS for assessing csPCa risk. The approach can maximize the use of PSMA information and correct the misdiagnosis of the PI-RADS score, ultimately improving the diagnostic accuracy of csPCa and assisting in making appropriate treatment decisions.
DISCLOSURE
This study was supported by the National Natural Science Foundation of China (82220108004, 82122033, 92259304, and 82103002), the Innovation Capability Support Program of Shaanxi (2021TD-39), the Clinical Research Project of AFMU (2021LC2111), and the China Postdoctoral Science Foundation (2022M711579). No other potential conflict of interest relevant to this article was reported.
KEY POINTS
QUESTION: How can we improve csPCa diagnostic accuracy in patients with biopsy GG1 and an SUVmax of less than 12 to reduce the risk of inappropriate treatment decisions?
PERTINENT FINDINGS: In this patient group, the PI-RADS score demonstrated modest discriminative ability with an AUC of 0.704 (PI-RADS 5–4 vs. 3–1) and 0.637 (PI-RADS 5–3 vs. 2–1). A multicenter retrospective study led to a predictive model for csPCa, termed “10 × PRIMARY score + 2 × SUVmax,” which outperformed individual SUVmax, PRIMARY score, and PI-RADS score, fully exploiting the advantages of both the SUVmax and the PRIMARY score.
IMPLICATIONS FOR PATIENT CARE: The model can identify misdiagnosis in PI-RADS score results, prompting clinicians to take necessary actions for accurate diagnosis and facilitating the selection of appropriate treatment decisions, such as RP to avoid delayed treatment or active surveillance to prevent overtreatment.
Footnotes
↵* †Contributed equally to this work.
Published online Aug. 31, 2023.
- © 2023 by the Society of Nuclear Medicine and Molecular Imaging.
REFERENCES
- Received for publication January 15, 2023.
- Revision received July 11, 2023.
In this issue


Jump to section
Related Articles
Cited By...
- No citing articles found.