


Visual Abstract

Abstract
O-GlcNAcylation is thought to play a role in the development of tau pathology in Alzheimer’s disease because of its ability to modulate tau’s aggregation propensity. O-GlcNAcylation is regulated by 2 enzymes: O-GlcNAc transferase and O-GlcNAcase (OGA). Development of a PET tracer would therefore be an essential tool for developing therapeutic small-molecule inhibitors of OGA, enabling clinical testing of target engagement and dose selection. Methods: A collection of small-molecule compounds was screened for inhibitory activity and high-affinity binding to OGA, as well as favorable PET tracer attributes (multidrug resistance protein 1 efflux, central nervous system PET multiparameter optimization, etc.). Two lead compounds with high affinity and selectivity for OGA were selected for further profiling, including OGA binding to tissue homogenate using a radioligand competition binding assay. In vivo pharmacokinetics were established using a microdosing approach with unlabeled compounds in rats. In vivo imaging studies were performed in rodents and nonhuman primates (NHPs) with 11C-labeled compounds. Results: Two selected candidates, BIO-735 and BIO-578, displayed promising attributes in vitro. After radiolabeling with tritium, [3H]BIO-735 and [3H]BIO-578 binding in rodent brain homogenates demonstrated dissociation constants of 0.6 and 2.3 nM, respectively. Binding was inhibited, concentration-dependently, by homologous compounds and thiamet G, a well-characterized and structurally diverse OGA inhibitor. Imaging studies in rats and NHPs showed both tracers had high uptake in the brain and inhibition of binding to OGA in the presence of a nonradioactive compound. However, only BIO-578 demonstrated reversible binding kinetics within the time frame of a PET study with a 11C-labeled molecule to enable quantification using kinetic modeling. Specificity of tracer uptake was confirmed with a 10 mg/kg blocking dose of thiamet G. Conclusion: We describe the development and testing of 2 11C PET tracers targeting the protein OGA. The lead compound BIO-578 demonstrated high affinity and selectivity for OGA in rodent and human postmortem brain tissue, leading to its further testing in NHPs. NHP PET imaging studies showed that the tracer had excellent brain kinetics, with full inhibition of specific binding by thiamet G. These results suggest that the tracer [11C]BIO-578 is well suited for further characterization in humans.
A key feature of Alzheimer’s disease is the presence of fibrillar deposits of phosphorylated tau protein, so-called neurofibrillary tangles (1). Recent natural history studies in Alzheimer’s disease patients have shown that increased tau pathology is associated with more severe disease, spurring efforts to develop treatments that may slow or prevent neurofibrillary tangle formation (2,3).
Glucose hypometabolism is directly correlated with tau pathology in Alzheimer’s disease (4). Cellular glucose availability regulates a posttranslational modification known as O-GlcNAcylation (5,6). O-GlcNAcylation of tau has been demonstrated to attenuate the propensity of tau to aggregate, and increased O-GlcNAcylation can be achieved by inhibiting the enzyme responsible for the removal of O-GlcNAc residues from proteins, O-GlcNAcase (OGA) (7–9). The availability of an OGA PET radiotracer is important as an early clinical development tool to determine target occupancy of OGA inhibitors, aiding drug development and dose selection in patients.
To date, there have been 2 disclosed examples of OGA PET tracers, though existing limitations necessitate further optimization of an OGA PET tracer that can provide information on dose selection and target engagement of OGA inhibitors in the clinic (10–14). To this end, we developed 2 OGA PET ligands with favorable kinetics. The lead compound [11C]BIO-578 was deemed suitable for clinical application.
MATERIALS AND METHODS
Animal studies were performed at either Invicro in the United Kingdom or Karolinska Institutet in Sweden and were reviewed and approved by respective institutional animal care and use committees (or equivalent) in accordance with all institutional and governmental regulations.
Homogenate Binding
Detailed protocols are listed in the supplemental materials (supplemental materials are available at http://jnm.snmjournals.org). In brief, tritiated radioligand binding studies were performed in 96-well plate–based assays with cytosolic brain homogenates for rodent and human brain studies or with whole-brain crude homogenates for human T-cells isolated from healthy volunteer blood in a steady-state reaction performed at room temperature. Reactions were terminated by rapid vacuum filtration using a 96-well plate–based harvester. Filters containing bound ligand were assessed for radioactivity using scintillation counting techniques. Competition binding studies were also performed with the reference standards thiamet G, O-(2-acetamido-2-deoxy-D-glucopyranosylidenamino) N-phenylcarbamate, BIO-735, and BIO-578 (7,15).
Microdose Biodistribution
Three Sprague–Dawley rats per time point were injected by intravenous bolus with 10 μg/kg BIO-735 or BIO-578. After injection, the frontal cortex, striatum, cerebellum, and rest of the brain were excised at baseline and 30, 60, 90, 120, 150, and 180 min. The amount of BIO-735 or BIO-578 was measured in plasma and each brain region by liquid chromatography tandem mass spectrometry.
Labeling with 11C
Synthesis of [11C]BIO-735 or [11C]BIO-578 was performed using either compound 1 or compound 2 as a precursor, respectively. Detailed synthesis protocols are provided in the supplemental materials. To summarize, [11C]CH3I was first produced according to previously published protocols (16). Precursor compound 1 or 2 was combined with anhydrous tetrahydrofuran and [11C]CH3I and heated to 125°C for 8 min. The reaction mixture was diluted, and the final radiolabeled product was isolated by reverse-phase, high-performance liquid chromatography. The collected fraction was diluted in sterile water, passed through a Sep-Pak tC18 cartridge (Waters), washed with sterile water, and eluted with 1 mL of ethanol into 9 mL of sterile saline.
PET Imaging in Rats
A detailed imaging protocol for the rodent study is presented in the supplemental materials. In brief, an adult male Sprague–Dawley rat received 2 PET scans using the tracer [11C]BIO-735. The first scan was a baseline scan, with the tracer (10 MBq, 0.16 μg) administered by intravenous bolus under isoflurane anesthesia. The second scan was performed 4 h later, with the rat first given a 0.3 mg/kg dose of BIO-735 by intravenous bolus and then 5 min later dosed with the tracer [11C]BIO-735 (8 MBq, 0.09 μg) and scanned. Both PET scans were dynamic acquisitions 0–60 min after injection of the tracer. Arterial blood sampling was performed, and a parent plasma input function was derived for both scans.
PET Imaging in Nonhuman Primates (NHPs)
A detailed protocol for NHP studies is presented in the supplemental materials. In brief, each NHP was scanned twice, receiving first a baseline scan and then a pretreatment blocking scan later the same day. The tracer was injected by intravenous bolus. Approximately 7 min before the blocking scans, either BIO-735 or thiamet G was administered intravenously, followed by intravenous administration of the tracer. Dynamic PET scans were acquired for 93 min immediately after intravenous injection of the tracer, with arterial blood sampling at time points throughout the duration of the scan (17).
RESULTS
Selection of Initial Compound
From the Biogen compound collection, 366 OGA inhibitors were filtered to select promising candidates as potential PET tracers (Fig. 1A). Compounds that had a high efflux ratio in the MDR1 Madin–Darby canine kidney cell assay were removed from consideration because of their likelihood of having poor central nervous system (CNS) penetrance, leaving 125 compounds. This was narrowed down on the basis of the CNS PET multiparameter optimization score of the compounds, a computational scoring function designed to select compounds with optimal PET tracer physicochemical properties (18). Further filtering was done by removing compounds that bound plasma proteins (the protein-free fraction cFu_p) greater than 95% to reduce the likelihood the candidate would have high nonspecific binding. Finally, because OGA concentration in the brain typically ranges from 5 to 50 nM, we screened out any compound with a half maximal inhibitory concentration (IC50) greater than 2 nM while ensuring the total density of target receptor Bmax/dissociation constant (Kd) would be greater than 10 (19). The remaining 8 compounds were then inspected to ensure facile introduction of a PET radiolabel, leaving BIO-735 as the lead candidate because of its ability to be labeled with either 11C or 18F (Fig. 1B). A summary of assay results (including plasma protein binding and MDR1 efflux transport) is provided in Supplemental Table 1.

(A) Flowchart of selection process based on starting collection of compounds. (B) Lead compound selected was BIO-735, with potential sites for radiolabeling in red. cFu_p = plasma protein free fraction; IC50 = half maximal inhibitory constant; MDR1 = multidrug resistance protein 1; MPO = multiparameter optimization; Papp = apparent permeability.
In Vitro Screening of BIO-735
The OGA protein sequence is highly conserved in eukaryotes; therefore, cross-reactivity of the tracer molecule is expected in all species used for in vitro and in vivo testing (mouse, rat, NHP, and human) (7). In addition, Bmax in the brain across these species was similar, allowing better comparison of tracer performance (Supplemental Figs. 1 and 2). Mouse brain homogenate binding with [3H]BIO-735 (Supplemental Fig. 3A) was used to determine Kd of 0.6 nM, which agreed with surface plasmon resonance (SPR) Kd (0.92 nM). Further binding studies with rat brain regional homogenates (including the striatum, cortex, hippocampus, and cerebellum) showed consistent Kd (0.6–0.7 nM) but differences in Bmax (Supplemental Fig. 3B). These correlate with known differences in OGA concentration among the regions (13).
Next, competition binding studies with [3H]BIO-735 were performed to determine the inhibition constants of 2 known inhibitors of OGA (O-(2-acetamido-2-deoxy-D-glucopyranosylidenamino) N-phenylcarbamate and thiamet G), as well as unlabeled BIO-735 as the homologous compound (Supplemental Figs. 1D, 3C, and 3D). Binding of [3H]BIO-735 was inhibited by all 3 compounds with affinities for OGA, consistent with published observations, indicating the tracer was binding to the same site on OGA (7,15).
Finally, Kd for BIO-735 was tested in human frontal cortex homogenate (Supplemental Fig. 1A), with Kd (0.6 nM) and Bmax (39 nM) comparable to the results in rat homogenate. In addition, these parameters were tested in human T-cell homogenates (Supplemental Fig. 1B). Human T-cell homogenate was found to have a Bmax of 42 nM, presenting a potential challenge for quantification. Because OGA is expressed in circulating T-cells, it is possible a change in the tracer-free fraction could occur if peripheral OGA is blocked after administration of a nonradioactive drug (Supplemental Fig. 1D). Furthermore, typical input function analysis to calculate the volume of distribution relies on analysis of plasma, which will not account for potential tracer binding to OGA expressed on circulating T-cells. This must be considered given its potential implications in the quantification of the brain PET signal as measured by the volume of distribution (20).
In Vivo Rat Testing of BIO-735
With promising in vitro results for BIO-735, an in vivo pharmacokinetic study under microdosing conditions was performed in rats. A concentration of 10 μg/kg was chosen to avoid saturating OGA binding sites and to study the kinetic behavior of the compound in different regions of the brain (Fig. 2A) (18,21,22). OGA binding was shown to differ from region to region, and the striatum and the cerebellum had the highest and the lowest uptake, respectively. This pattern of BIO-735 distribution is consistent with the relative concentration of OGA in the regions measured (Supplemental Fig. 3B). Plasma kinetics showed rapid clearance of BIO-735, with most cleared by 60 min after injection, although because plasma does not contain OGA-expressing T-cells, clearance will likely be faster than in whole blood. The concentration of BIO-735 in the brain was highest in the striatum, followed by the frontal cortex, and the cerebellum had the lowest uptake.

(A) Results of microdosing study where rats (n = 3 per time point) were administered BIO-735 by intravenous bolus (10 μg/kg) and tissues were analyzed for compound concentration by liquid chromatography tandem mass spectrometry. (B) Coronal PET images of rat administered [11C]BIO-735 as either baseline scan (left) or blocking scan (right) after pretreatment with 0.3 mg/kg BIO-735, summed for 0–60 min.
The tracer candidate BIO-735 was radiolabeled with the PET isotope 11C (half-life, 20.4 min) at high radiochemical purity (94%–95%) and molar activity (30–50 GBq/μmol). The tracer [11C]BIO-735 was injected intravenously (8–10 MBq, 0.09–0.16 μg) into a naïve rat, first as a baseline scan and then after a 0.3 mg/kg blocking dose of BIO-735. The rat underwent a dynamic PET scan 0–60 min after injection, followed by a CT scan for anatomic reference (Fig. 2B).
Coronal images and time–activity curves showed measured uptake of the tracer in all sampled brain regions. Baseline time–activity curves showed that the tracer was rapidly taken up in the brain with little washout during the scan duration, suggesting strong affinity toward its target (Supplemental Fig. 4). Retention of the tracer varied in different brain regions. Regions such as the striatum and the hypothalamus were associated with relatively high tracer uptake and slow off-rate kinetics, whereas some regions, such as the cerebellum, were associated with relatively low tracer uptake and faster off-rate kinetics. The self-blocking scan showed tracer uptake followed by rapid clearance from the CNS, with a reduction in whole-brain SUV 50–60 min after injection from 2.9 at baseline to 0.3 after blocking, suggesting near-total saturation of the target (Supplemental Fig. 4). No regional difference could be seen in tracer uptake during the self-block scan.
PET Imaging of [11C]BIO-735 in NHPs
With good evidence of brain uptake and saturable binding in rats, the tracer [11C]BIO-735 was tested in a cynomolgus NHP. The tracer was synthesized at high radiochemical purity (>99%) and molar activity (35–60 GBq/μmol at the end of synthesis) and either administered intravenously alone as a baseline scan or coinjected with 1 mg/kg BIO-735 as a homologous block (for baseline, 36 MBq, 2.0 μg; for pretreatment, 95 MBq, 3.3 μg). A dynamic PET scan was acquired 0–90 min after injection with the arterial input function and parent fraction analysis. An MR image was also obtained as an anatomic frame of reference, and regions of interest for brain regions were drawn manually (Fig. 3A).

PET/MRI data of NHP scanned with [11C]BIO-735. (A) PET images summed for 10–93 min: from top to bottom, baseline scan, blocking scan after pretreatment with 1 mg/kg BIO-735, and MR image for anatomic reference. (B) Regional time–activity curve for brain subregions after baseline scan (top) and blocking scan (bottom).
The baseline scan showed tracer uptake throughout the brain, with a gradient of SUV across brain regions consistent with the OGA expression level. Uptake was highest in the putamen and lowest in the thalamus (Fig. 3B). The second PET scan followed pretreatment with a 1 mg/kg self-block, which dramatically reduced uptake within all brain regions, allowing quick washout of the tracer. The initial SUV (0–5 min) was increased after treatment with the self-block, suggesting a change in the input function consistent with the blocking of OGA in the periphery and allowing more free radiotracer to be present in the blood and brain. This is likely because the tracer was bound to OGA expressed on circulating T-cells in the baseline scan and then inhibited by pretreatment with the self-block scan. Although there was no observed difference in the plasma parent fraction between the 2 scans (Supplemental Fig. 5), this is likely because of the lack of T-cells (and therefore OGA) in the plasma. This reinforces the need for an appropriate input function of quality to derive the volume of distribution and quantify the signal with confidence.
Although the tracer in NHP showed excellent specific uptake and binding, the time–activity curves for the baseline scan showed no observable clearance from the brain during the 90-min scan after initial uptake. This suggests that once bound, the off-rate for the tracer is very slow, making potential quantification of the volume of distribution challenging. Thus, BIO-735 was deemed suboptimal as a PET tracer candidate and was optimized toward reduced OGA affinity to facilitate release from the target and accelerate clearance without affecting selectivity or specificity.
Optimization of Lead Compound BIO-578
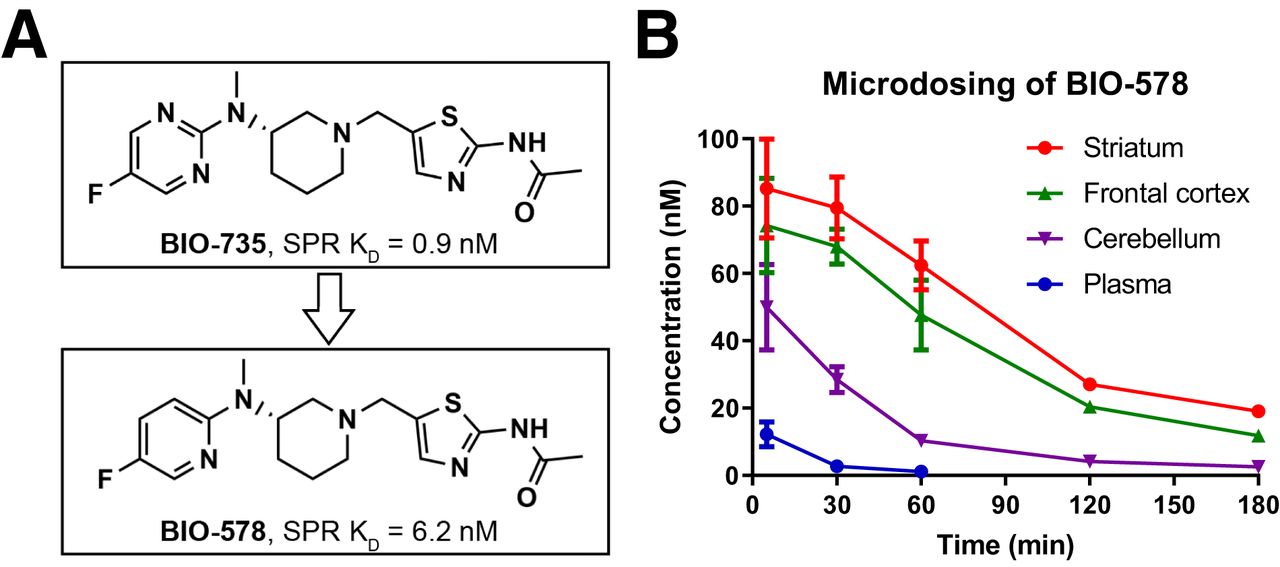
The original structure of BIO-735 was modified by replacing a single nitrogen with carbon (Fig. 4A), moving from pyrimidine to pyridine and reducing the compound’s affinity for OGA without adversely affecting the CNS PET multiparameter optimization score or other key properties (Supplemental Table 1). The new compound, BIO-578, had a CNS PET multiparameter optimization score of 4.7 and SPR Kd of 6.15 nM, about 7-fold higher than that of BIO-735. This was confirmed by homogenate binding in a mouse brain with a Kd of 2.3 nM, about 4 times higher than that of BIO-735 (Supplemental Fig. 2A). The new compound was tested as before, with inhibition constant measurements showing specific and concentration-dependent inhibition of binding to OGA (Supplemental Figs. 2B and 2C).

(A) Molecular structures of BIO-735 and BIO-578, showing replacement of pyrimidine with pyridine and resultant decrease in affinity by SPR. (B) Results of microdosing study where rats (n = 3 per time point) were administered BIO-578 by intravenous bolus (10 μg/kg) and tissues were analyzed by LC-MS/MS.
A microdosed pharmacokinetic study in rats showed that BIO-578 accumulated in the brain with a pattern similar to what was observed for BIO-735, though with faster apparent clearance (Fig. 4B). BIO-578 was shown to have an approximately 4-fold decrease in striatum concentration over 3 h, whereas BIO-735 remained relatively constant.
PET Imaging of Lead Compound [11C]BIO-578 in NHPs
BIO-578 was labeled with 11C, and the tracer [11C]BIO-578 was dosed intravenously (for baseline, 28 MBq, 0.9 μg; for pretreatment, 132 MBq, 1.6 μg). A baseline PET scan was acquired, as well as a 1 mg/kg blocking scan after pretreatment with nonradioactive BIO-735 (Fig. 5A). These were each acquired with the arterial input function and parent fraction analysis, as well as an MR image for anatomic reference. All brain regions measured showed uptake and retention of the tracer. Tracer uptake was also variable in different regions of the brain. High uptake in the putamen and low uptake in the cerebellum were observed, similar to trends observed by other OGA tracers (11). The signal was subsequently blocked after administration of a mass dose of BIO-735, demonstrating selectivity for the target (Fig. 5B). A higher initial SUV (0–5 min), a phenomenon noted in the [11C]BIO-735 scans and a feature of PET tracers specific to OGA, was also observed.

PET/MRI data of NHP scanned with [11C]BIO-578 and pretreated with BIO-735. (A) Representative axial slices of PET/MR images after dosing of [11C]BIO-578 in NHP. PET images were summed from 10 to 93 min: from top to bottom, baseline scan, blocking scan after pretreatment with 1 mg/kg BIO-735, and MR image for anatomic reference. (B) Regional time–activity curve for brain subregions after baseline scan (top) and blocking scan (bottom).
In the baseline scan, all brain regions demonstrated observable clearance over the 90-min scan. With a measurable off-rate, [11C]BIO-578 exhibited a desired profile for a PET tracer. Metabolite analysis demonstrated that the intact parent tracer accounted for approximately 10% of the total radioactivity measured in the plasma 60 min after administration (Supplemental Figs. 6 and 7).
To confirm the in vivo specificity of [11C]BIO-578, a NHP PET study was conducted, using thiamet G as the blocking compound (Fig. 6). A baseline and a 10 mg/kg thiamet G pretreatment PET scan were each acquired (for baseline, 40 MBq, 1.1 μg; for pretreatment, 108 MBq, 1.0 μg). The dose of thiamet G was selected on the basis of published data showing pretreatment leads to an approximately 90% reduction in PET tracer binding to OGA (11). As before, the baseline scan showed uptake throughout the brain (Fig. 6). The thiamet G pretreatment scan showed substantial clearance from all brain regions, indicating that [11C]BIO-578 binding is successfully blocked by thiamet G.

PET/MRI data of NHP scanned with [11C]BIO-578 and pretreated with thiamet G. (A) Representative axial slices of PET/MR images after dosing of [11C]BIO-578 in NHP. PET images were summed for 10–120 min: from top to bottom, baseline scan, blocking scan after pretreatment with 10 mg/kg thiamet G, and MR image for anatomic reference. (B) Regional time–activity curve for brain subregions after baseline scan (top) and blocking scan (bottom).
DISCUSSION
There is a precedence for the development of OGA PET tracers. One of the previously published OGA PET tracers, [18F]MK-8553, has little data disclosed outside of conference proceedings. A more recent tracer, [18F]LSN3316612, showed promise in preclinical imaging studies in rodents and NHPs published by Lu et al. (13) and Paul et al. (11) and was tested clinically in healthy human volunteers (23). Although the scope of the studies did not involve determination of target occupancy of an OGA inhibitor, the tracer showed promising imaging properties to provide information on dosing regimens, leading the authors to conclude that it could be suitable for clinical research on OGA. However, the ligand exhibits a slow off-rate, leading to the slow clearance kinetics observed in both NHP and human studies and complicating efforts to robustly quantify uptake because of the lack of a reference region (24). Furthermore, the relatively long time that it takes the tracer to reach equilibrium necessitates longer time frames for PET acquisition. This, combined with 18F as the labeling isotope, limits the number of PET scans that could theoretically be performed on a subject in a single day. The efforts described here were in pursuit of finding a suitable OGA PET tracer that does not bear these limitations, enabling robust quantification of target occupancy to support drug development efforts.
The first compound tested, BIO-735, demonstrated high affinity toward OGA in both SPR and homogenate binding studies, as well as in vitro properties suggesting blood–brain barrier permeability and low efflux. An in vivo pharmacokinetic study using a microdose of BIO-735 exhibited uptake and slow clearance from the brain, with uptake in brain regions consistent with the previously determined Bmax for those regions. Although the 10 μg/kg dose is approximately 10–20 times higher than the typical mass of the tracer injected during imaging, it was demonstrated that microdose kinetics and uptake were still consistent with a radiolabeled tracer dose. These results suggest that such microdosed pharmacokinetic studies could be valuable for screening other CNS PET tracers without the need to radiolabel them (18,22,25). This is particularly applicable for targets that have a differential expression in different compartments of the brain. We hypothesize that factors such as lower target Bmax or presence of an off-target sink could negatively affect the microdose approximation by affecting tracer kinetics more than the larger microdose. This strategy could be extended to peripheral tissues, though it would be limited to targets of known protein expression and distribution that are naturally expressed in relative abundance.
After radiolabeling with 11C, PET imaging studies were performed in rats and NHPs. However, as with the rat, clearance from the NHP of [11C]BIO-735 in the baseline scan was very slow such that there was no observable decrease in SUV over the 90-min scan duration. This presented significant challenges for quantification and modeling, similar to challenges faced by Paul et al. (11). It was hypothesized that this may result from the high affinity of BIO-735 toward OGA, with a Kd of 0.9 nM by SPR.
After modifications to the original structure, the new compound, BIO-578, displayed a nearly 7-fold reduction in affinity. Results from the microdosed pharmacokinetic study in rats provided evidence of a faster off-rate and clearance from the CNS. A PET imaging study in NHPs with the radiolabeled tracer [11C]BIO-578 confirmed this improved clearance, with the baseline scan showing uptake and binding to OGA, followed by about 50% washout over 90 min, as well as displaceable binding and rapid clearance in a scan after a 1 mg/kg pretreatment with BIO-735.
The PET tracer [11C]BIO-578 demonstrated specific, reversible binding to OGA and kinetics favorable for target occupancy calculations, suggesting that [11C]BIO-578 could serve as a tool for evaluating small-molecule inhibitors of OGA in the clinic. In addition to improved clearance, the tracer’s labeling with 11C results in lower radiation dosimetry than with 18F and allows multiple same-day scans of the same patient, presenting a significant advantage over both [18F]LSN3316612 and [18F]MK-8553.
Also of note was the determination of OGA Bmax in human T-cells, because this has the potential to affect quantification and is not captured in a typical plasma input function workflow. It is also worth considering when developing other tracers for targets that may be expressed in circulating immune cells.
CONCLUSION
Two 11C PET tracers were developed targeting OGA, an enzyme with a known role in the O-GlcNAcylation of tau protein and potentially implicated in tau aggregation in Alzheimer’s disease. Although the off-rate of the first tracer, [11C]BIO-735, was suboptimal for clinical translation, the second tracer, [11C]BIO-578, proved more promising. Testing through a series of in vitro and in vivo rat experiments demonstrated the high affinity and specificity of the tracer toward OGA, whereas in vivo NHP studies confirmed that the tracer is suitable for testing in patients.
DISCLOSURE
Authors are or were used or contracted by Biogen and may hold stock in the company. Work was paid for in full by Biogen. No other potential conflict of interest relevant to this article was reported.
KEY POINTS
QUESTION: Can a PET tracer be designed for OGA that can support target occupancy and dose selection studies of therapeutic OGA inhibitors in clinical trials?
PERTINENT FINDINGS: A PET tracer, [11C]BIO-578, was developed and validated preclinically in rodent and NHP studies. Its optimized kinetics will enable robust calculation of target occupancy in future investigations.
IMPLICATIONS FOR PATIENT CARE: This PET tracer will provide critical data on target occupancy and dose selection during clinical development of OGA inhibitors for the treatment of Alzheimer’s disease.
Footnotes
Published online Jul. 6, 2023.
- © 2023 by the Society of Nuclear Medicine and Molecular Imaging.
Immediate Open Access: Creative Commons Attribution 4.0 International License (CC BY) allows users to share and adapt with attribution, excluding materials credited to previous publications. License: https://creativecommons.org/licenses/by/4.0/. Details: http://jnm.snmjournals.org/site/misc/permission.xhtml.
REFERENCES
- Received for publication February 22, 2023.
- Revision received May 31, 2023.
In this issue


Jump to section
Related Articles
Cited By...
- No citing articles found.