


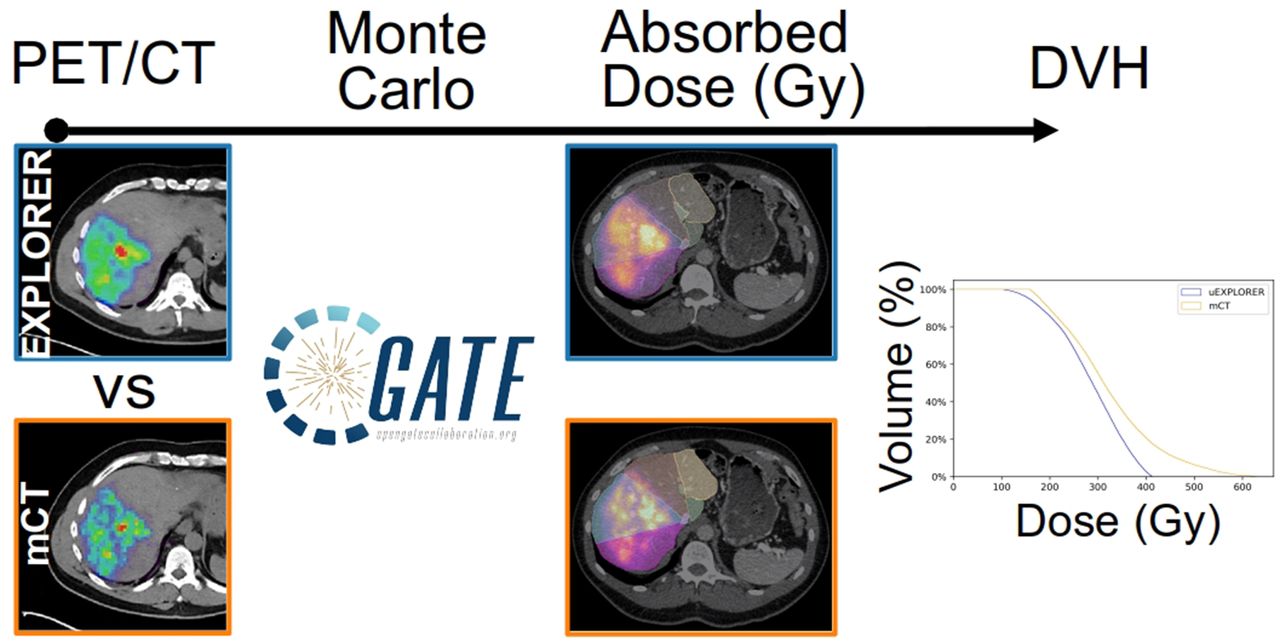
Visual Abstract

Abstract
Transarterial radioembolization (TARE) is a locoregional radiopharmaceutical therapy based on the delivery of radioactive 90Y microspheres to liver tumors. The importance of personalized dosimetry to make TARE safer and more effective has been demonstrated in recent clinical studies, stressing the need for quantification of the dose–response relationship to ultimately optimize the administered activity before treatment and image it after treatment. 90Y dosimetric studies are challenging because of the lack of accurate and precise methods but are best realized with PET combined with Monte Carlo simulations and other image modalities to calculate a segmental dose distribution. The aim of this study was to assess the suitability of imaging 90Y PET patients with the total-body PET/CT uEXPLORER and to investigate possible improvements in TARE 90Y PET-based dosimetry. The uEXPLORER is the first commercially available ultra-high-resolution (171 cps/kBq) total-body digital PET/CT device with a 194-cm axial PET field of view that enables the whole body to be scanned at a single bed position. Methods: Two PET/CT scanners were evaluated in this study: the Biograph mCT and the total-body uEXPLORER. Images of a National Electrical Manufacturers Association (NEMA) image-quality phantom and 2 patients were reconstructed using our standard clinical oncology protocol. A late portal phase contrast-enhanced CT scan was used to contour the liver segments and create corresponding volumes of interest. To calculate the absorbed dose, Monte Carlo simulations were performed using Geant4 Application for Tomographic Emission (GATE). The absorbed dose and dose–volume histograms were calculated for all 6 spheres (diameters ranging from 10 to 37 mm) of the NEMA phantom, the liver segments, and the entire liver. Differences between the phantom doses and an analytic ground truth were quantified through the root mean squared error. Results: The uEXPLORER showed a higher signal-to-noise ratio at 10- and 13-mm diameters, consistent with its high spatial resolution and system sensitivity. The total liver-absorbed dose showed excellent agreement between the uEXPLORER and the mCT for both patients, with differences lower than 0.2%. Larger differences of up to 60% were observed when comparing the liver segment doses. All dose–volume histograms were in good agreement, with narrower tails for the uEXPLORER in all segments, indicating lower image noise. Conclusion: This patient study is compelling for the use of total-body 90Y PET for liver dosimetry. The uEXPLORER scanner showed a better signal-to-noise ratio than mCT, especially in lower-count regions of interest, which is expected to improve dose quantification and tumor dosimetry.
Transarterial radioembolization (TARE) is a locoregional radionuclide therapy based on the delivery of radioactive 90Y microspheres to liver tumors (1,2). TARE is increasingly integrated in multitherapy approaches for both primary and metastatic liver cancer and has shown good potential to improve quality of life or downstage tumors for transplantation (3–6). It has also demonstrated a reduction in time to progression (6), with low toxicity (7,8), and has been adopted as the primary treatment for hepatocellular carcinoma at some institutions (3). The 2 commercially available 90Y microspheres—resin (SIR-Spheres; Sirtex) and glass (TheraSphere; Boston Scientific)—are directly injected into the hepatic arteries through a catheter. The glass and resin microspheres have an average diameter of 20–60 μm and 20–30 μm, respectively, and unit activity of 2,500 Bq and 50 Bq, respectively, the latter requiring a larger amount of resin microspheres to achieve the same administered activity (9). The microspheres are transported mainly by the blood flow and tend to form clusters, thus presenting a very heterogeneous distribution in the liver. This distribution can cause the absorbed dose to locally achieve values of close to 400 Gy, much greater than the total liver target of 120 Gy and threatening sensitive hepatic structures (10–14). One major challenge in making TARE safer and more effective is the lack of accurate methods to assess this heterogeneous dose distribution in the tumor and the rest of the liver after treatment. Because there is mounting evidence that TARE patient outcome correlates with the absorbed dose (15–19), it becomes critical to develop dosimetry methods that allow for quantitative evaluation of this relationship (e.g., progression-free survival vs. absorbed dose in Gy). Quantification of the dose–response relationship is required to optimize and understand the effects of administered activity and the potential need for retreatment or treatment of adverse effects; 3-dimensional (3D) image-based dosimetry is a promising approach to achieve these goals (20).
Significant effort has been put into posttreatment monitoring, which is challenging because of the difficulty of imaging 90Y, a β-emitter (99.98%) with a maximum energy of 2.28 MeV. Although 90Y Bremsstrahlung x-ray photons are routinely imaged with a γ-camera or SPECT, they form images with a very low signal-to-noise ratio and poor spatial resolution. This is due to the low photon emission yield per β-decay and the broad energy spectrum of these x-ray photons, preventing data correction and energy windowing (21). An alternative imaging modality for dosimetry is quantitative PET, possible through the limited 90Y positron emission (0.0032% of decays). The spatial resolution of 90Y PET is much better than 90Y SPECT (21), but 90Y PET dosimetry suffers from high bias and variability in small or low-activity regions (22,23), preventing it from fully capturing the high heterogeneity of the liver dose distribution. The energy deposition at a voxel level (∼3 mm) can nevertheless be easily computed with high accuracy through Monte Carlo simulations, such as the Geant4 Application for Tomographic Emission (GATE) toolkit. GATE is capable of modeling particle transport through matter and storing the energy deposited in a 3D map to compute voxel-based absorbed doses.
Recently, the advent of PET scanners with a long axial field of view and total-body capability has provided a substantial improvement in PET sensitivity over conventional PET scanners (24–26). The uEXPLORER scanner (Fig. 1A) has an axial field of view of 194 cm, allowing the whole body to be scanned at a single bed position, and a large acceptance angle—capabilities that, combined, allow for a relatively flat sensitivity profile across 1 m (Fig. 1B), providing a 16- to 64-fold gain in sensitivity for total-body imaging. For single-organ imaging in the abdominal region positioned within the central meter, the sensitivity gain is expected to be 4- to 10-fold. This may be especially beneficial for PET imaging of 90Y, for which positron yield is 30,000 times lower than that for standard clinical oncology imaging with 18F-FDG.

(A) Photograph of uEXPLORER total-body PET/CT scanner installed at EXPLORER Molecular Imaging Center in Sacramento, CA. (B) Comparison of sensitivity profiles between mCT and uEXPLORER.
This work evaluated the suitability of imaging 90Y PET patients with the total-body PET/CT uEXPLORER scanner (United Imaging Healthcare) installed at the University of California, Davis. We present the very first use (to our knowledge) of total-body PET for TARE dosimetry and an investigation of the possible improvement in dose accuracy expected from the uEXPLORER sensitivity, 18 times higher than that of the conventional PET scanner used in this study according to the National Electrical Manufacturers Association (NEMA) NU 2 standard, the Biograph mCT (Siemens Healthineers) (24,27). The images were used as input for Monte Carlo simulations to perform 90Y liver radioembolization dosimetry and compare conventional and total-body clinical 90Y PET/CT for the first time, to our knowledge.
MATERIALS AND METHODS
System Parameters
The Biograph mCT is a PET/CT scanner with a field of view of 21.8 cm. The scanner has a sensitivity of 9.6 kcps/MBq, a spatial resolution of 4.5 mm at the center (21), and a time-of-flight resolution of 550 ps (27).
The uEXPLORER total-body PET/CT scanner (Fig. 1) has an axial field of view of 194 cm, with a 57° axial acceptance angle. This leads to the highest sensitivity of any clinical PET scanner, 176 kcps/MBq, as measured with the NEMA NU 2 protocol. The spatial resolution is 3.0 mm (28). The time-of-flight resolution was measured to be 505 ps following NEMA NU 2 2018.
Phantom Scan
A NEMA image-quality phantom was used to evaluate the image quality of both PET/CT scanners when imaging a therapeutic dose level of 90Y (1–5 GBq), with the goal of calculating the absorbed dose. A Capintec CRC-55TR dose calibrator was used for 90Y dose measurements after it was calibrated with a National Institute of Standards and Technology–traceable 90Y source (Eckert and Ziegler GmbH) with an accuracy of ±3%. The phantom was filled with 2.51 GBq of 90Y solution with a sphere-to-background ratio of 7.78:1 in the 6 fillable spheres (diameters, 10–37 mm). The phantom was positioned with all spheres at the center of the axial field of view and imaged on day 0 for 30 min using a single bed position, first on the mCT and then on the uEXPLORER, to allow a direct comparison between the two.
Patient Scans
A single-site prospective study was approved by the Institutional Review Board to collect PET/CT images after 90Y liver radioembolization. Two patients were imaged with PET/CT after radioembolization at the University of California–Davis Health.
The first patient (P1) received a total activity of 3.363 GBq of 90Y glass microspheres in 3 consecutive injections, targeting multiple neuroendocrine liver metastases. The patient was scanned 5 h after injection on the uEXPLORER total-body PET scanner (30-min duration) and then on the mCT 1 h later (30 min, 2 bed positions, 43% overlap). The second patient (P2) received a total activity of 0.985 GBq of 90Y resin microspheres to treat metastatic pancreatic cancer. PET/CT images were acquired for 30 min at a single bed position covering the whole liver at 21.8 and 22.6 h after injection on the uEXPLORER and the mCT, respectively.
Image Reconstruction
Both phantom and patient data were reconstructed on the uEXPLORER using parameters adapted from the University of California–Davis clinical oncology protocol (but with an increased isotropic voxel size of 4 mm as opposed to 2.344 mm): ordered-subset expectation maximization, 20 subsets, 4 iterations, time of flight, point-spread function modeling, and no smoothing. This protocol follows the University of California–Davis low-dose image reconstruction parameters designed to reduce noise in low-count imaging such as for 90Y imaging (29,30).
Image reconstruction on the mCT used ordered-subset expectation maximization, time of flight, 21 subsets, 3 iterations, point-spread function modeling, a voxel size of 4.078 × 4.078 × 3.75 mm, and 5-mm gaussian smoothing following a previously published protocol (31) and closely matched the clinical oncology protocol of this scanner except for a 5.0-mm gaussian filter used to reduce noise for low-count 90Y imaging.
The voxel size of the uEXPLORER reconstructions provides the closest possible match to the mCT reconstruction voxel size to reduce bias in the comparison. Given that the uEXPLORER has very high sensitivity and high spatial resolution, uEXPLORER images without smoothing are still less noisy than mCT images (Figs. 2A and 2B), and additional smoothing would likely over-smooth the images, reducing diagnostic imaging performance.

(A and B) Patient images of PET/CT at axial, coronal, and sagittal views from uEXPLORER (A) and mCT (B). uEXPLORER images without smoothing are less noisy than mCT and additional smoothing to uEXPLORER. (C and D) CECT at axial view with Couinaud segments at upper liver containing segments 2, 4a, 7, and 8 (C) and lower liver containing segments 3, 4b, 5, and 6 (D). Inferior vena cava and left and right portal veins can be visualized in both upper and lower liver.
Contrast-Enhanced CT (CECT)
Routine 4-phase abdominal CECT images acquired before treatment were used for liver contouring and segmentation. The late portal-phase image was used to identify the whole liver contour and the vasculature and to define the 8 Couinaud segments, S1–S8 (including segments 4a and 4b) (32,33). Thirteen volumes of interest (VOIs) were created (Figs. 2C and 2D), including the inferior vena cava and the left and right portal veins. The absorbed dose depends largely on the liver masses of P1 and P2 (1,504.8 g and 919.8 g, respectively), and the volumes and masses of all VOIs can be seen in Table 1. The segmentation was verified by a board-certified radiologist with 9 y of experience.
Liver and Liver Segment Volumes and Masses in P1 and P2
90Y Image-Based Dosimetry Using Monte Carlo Simulation
To calculate the absorbed dose from the activity distribution in the VOI, Monte Carlo simulations were performed using GATE 9.0 (34). An attenuation map was generated for each patient or phantom using CECT and CT images, respectively, and material composition in GATE. The PET images were converted into activity distributions and then normalized to provide a probability density map of positron emission. The source and attenuation maps allowed GATE to generate and transport the primary and secondary particles (mostly electrons) and store the deposited energy in a 3D image matrix. The energy deposition matrix was weighted by its density to produce the final 3D absorbed dose distribution in Gy. The 90Y physics were modeled through the standardem_opt4 package with a standard energy cut of 1 mm, consistent with the liver tissue modeled in this work and as recommended for medical applications (35). The 90Y radioactive decay energy distribution was defined by an energy spectrum generated from the Fermi theory for β-decays (36). 90Y decays to 90Zr through β-emission (99.998%) with a maximum energy of 2.28 MeV and mean energy of 930 keV, corresponding to a maximum electron range of 11 mm and a mean range of 2.5 mm in water (21). A low-frequency decay (0.017%) to the first excited state of 90Zr allows transition of the internal pair production to ground state, yielding on average 31.86 positron emissions per million 90Y decays that can be imaged with PET (37).
Phantom Absorbed Dose Calculation
The absorbed dose was estimated for each sphere insert of the NEMA image-quality phantom. To prevent any voxel outside the VOIs from containing a primary event in the Monte Carlo simulation and thus maximize the computation efficiency, a binary mask restricted the PET-based source distribution to voxels corresponding to each VOI. This method allowed the simulations to be performed with a fixed number of primary events followed by scaling to the cumulative activity instead of using the true total number of events, typically very large with therapeutic activities of 1–5 GBq. A total of 107 primaries was chosen to provide a statistical uncertainty of approximately 1% for the 37-mm sphere with a reasonable simulation time of 2 h in an 8-core computer at 3.2 GHz and 64 GB of random-access memory. The resolution of the volumetric dose map generated by GATE was 4-mm isotropic and 4.07 × 4.07 × 3.75 mm for the uEXPLORER and the mCT, respectively. A separate Monte Carlo simulation was performed to produce the ground truth dose map through a mathematic model of the image-quality phantom. The ground truth was calculated with Monte Carlo simulation exactly as for the image-based calculations, but using geometric spheres, a homogeneous radiation source, and 0.25 × 0.25 × 0.25 mm voxels to allow accurate tracking of β-particles with ranges of up to 11 mm. To compensate for the small voxel size, 108 primaries per sphere were used to achieve a statistical uncertainty of approximately 5% for the 37-mm sphere.
Patient Absorbed Dose Calculation
The noise in 90Y-PET images is inherently higher than in 18F images because of the low positron yield combined with a lack of specific reconstruction methods to address the low count statistics (37). This limitation poses a unique challenge in defining the liver volume directly on the PET image, especially when respiratory motion shifts the liver position (38). Segmenting different images separately (e.g., mCT and uEXPLORER) also adds bias to the absorbed dose distributions, which was mitigated using a single VOI generated from the contoured CECT. The PET images were coregistered to the CECT and then projected onto the CECT image grid. Since PET images are used as radiation sources, every count in the image is a probable location of a primary event. To ensure that all primary events were generated only in the liver, the same technique as used for the phantom was applied, in which the liver VOI was used as a binary image mask to restrict primary-event generation to regions within the liver (Fig. 3).

P2 activity distribution with 957 MBq in entire mCT PET image (A) and after applying mask corresponding to VOI to limit generation of events to VOI (B).
Monte Carlo simulations were performed within a voxelized phantom created from the CECT image that provided the anatomic information, mass, and density of tissue in which the β-particles propagate and interact. The activity distribution measured from PET images registered to the CECT volume was used to define the 90Y source with 108 primary events, with a voxel size matching the spatial resolution of the CECT images (0.74 × 0.74 × 1.25 mm and 0.67 × 0.67 × 1.00 mm for P1 and P2, respectively). All voxel-based absorbed doses were calculated from the dose map by averaging the voxel values in the VOI since all voxels share the same mass and density. No ground truth was computed, as no in vivo quantification of the 90Y microspheres distribution can be performed to confirm the 90Y activity distribution measured with PET.
Dose Characterization
The absorbed dose and dose–volume histograms (DVHs) were calculated for each phantom sphere, each liver segment, and the entire liver from the 3D absorbed dose distributions. DVHs for individual segments and the whole liver were used to assess the difference in the dose distributions computed from each PET/CT scanner. A particular range of dose bins was also evaluated, with consideration of only the voxels between 20% and 80% of the maximum absorbed dose (Gy) to build the cumulative DVH (DVH20%–80%). This approach makes the data trends clearer by avoiding errors near extremes where the noise might be increased (37).
With the NEMA spheres, for which ground truth was available, the difference between the true value and the values obtained with the scans was also quantified through the root mean squared error (RMSE) (39): where DVHPET,ø is the image-based absorbed dose and DVHTrue,ø is the true absorbed dose from the ground truth. The RMSE was calculated for the whole volume as well as for the 20%–80% range.
RESULTS
Phantom Analysis
Figure 4A shows the dose differences between the ground truth, the mCT, and the uEXPLORER for all 6 spheres. The mCT scanner at 10- and 13-mm diameters showed negative biases of 14.4 and 14.5 Gy, respectively. The uEXPLORER showed differences of 7.9 and 1.4 Gy, respectively, for these volumes. The lower biases were consistent with the higher sensitivity and spatial resolution of the uEXPLORER, expected to improve the dosimetry accuracy primarily in low-count 90Y-PET regions resulting from small or low-activity regions.

Absolute differences between uEXPLORER and mCT vs. true absorbed doses from ground truth for 6 NEMA spheres (A) and DVH of 37-mm sphere with 20%–80% range of maximum absorbed dose (Gy) (B).
Figure 4B shows the DVH20%–80% of the 37-mm sphere for both the uEXPLORER and the mCT, as well as for the ground truth. The 90Y β-particles may deposit their energy in a neighbor voxel or even outside the sphere, leading to a heterogeneous energy deposition; therefore, DVH20%–80% exhibits a slow decrease rather than being a step function. The 37-mm sphere accounts for a larger number of voxels and thus resulted in a good RMSE agreement with the ground truth for both PET scanners, with no significant difference (0.3%) between the scanners’ RMSEs. Although the RMSE was lower for the uEXPLORER in 4 of 6 spheres, including the 2 smallest spheres, of 10- and 13-mm diameter, it varied widely, with no clear trend between the 2 scanners. The 20%–80% RMSE range did not further improve the analysis, with a 36%–140% variation from the ground truth.
Patient Dosimetry
The total liver-absorbed dose calculated from the PET distribution showed excellent agreement between the uEXPLORER and the mCT, with 108 Gy (difference of 0.2 Gy, or 0.19%) for P1 and 40 Gy (difference of 0.1 Gy, or 0.16%) for P2. Much larger differences were observed when comparing the dose in liver segments, ranging from 6 to 204 Gy (differences from 0.01% to 60.8%) for P1 (Fig. 5A) and 10 to 92 Gy (differences from 0.39% to 35.8%) for P2 (Fig. 5B).

Absorbed doses for P1 (A) and P2 (B). Error bars indicate statistical uncertainty from GATE simulations. IVC = inferior vena cava; LPV = left portal vein; RPV = right portal vein.
Figure 6 shows the DVH20%–80% for segments 6–8 in both P1 and P2. These segments had the highest activities and absorbed doses and, thus, also better count statistics and lower noise, providing the most robust comparison between the 2 scanners. All values of DVH20%–80% were in good agreement, with narrower tails for the uEXPLORER in all segments. As reported previously (39), a narrower tail might be an indicator of lower image noise. This was clearer in P2, who received a lower injected activity and was imaged at a later time point than P1 (5 h and 22 h after injection, respectively) and therefore should have a lower signal-to-noise ratio. Accordingly, the lower image noise of the uEXPLORER agreed with the improved average contrast recovery reported previously (28).

DVH with 20%–80% range of maximum absorbed dose (Gy) for segments 6–8 of P1 (A) and P2 (B).
DISCUSSION
The absorbed doses calculated for the NEMA phantom spheres imaged with the uEXPLORER and mCT scanners agreed well for most of the 4 largest spheres, with an expected fluctuation due to the inherent noise present in 90Y-PET images. In contrast, a larger discrepancy between the calculated doses and the ground truth, 1.0% and 10.2%, was observed with the uEXPLORER and the mCT, respectively, for the 13-mm-diameter sphere. This is a clear indication of the higher spatial resolution and signal-to-noise ratio of the uEXPLORER, which is especially beneficial for dose quantification in small and low-activity regions. This trend was also observed in patient images, in which the narrower tail of the uEXPLORER DVH20%–80% indicates a lower noise level, more apparent for P2, who received a lower injected activity and was scanned at a later time point, resulting in a 2-fold reduction in counts.
The DVH20%–80% for both the phantom and the patients showed a very similar slope in both scanners, and the behavior of the slope indicates the heterogeneity of the dose or, in this case, the activity source. In a homogeneous source, all voxels have the same value, and therefore, the DVH20%–80% would be a step function. In a heterogeneous source, the voxels have different values, resulting in slopes such as those shown in Figures 4B and 6. Hence, the similarities in the DVH slope for both scanners suggest a similar distribution of activity. Similar distributions and heterogeneities obtained from the 2 subsequent PET scans suggest that 90Y PET can be considered a reliable method for posttreatment dosimetry and follow-up.
P1 received 3 selective injections through the right hepatic artery targeting 3 main arterial branches supplying multiple tumors in the right hepatic lobe, resulting in high doses in target segments S5 to S8. Segments S1–S4 and the vessels should contain no or very little activity because of the injection location, meaning that the observed dose is likely due to inaccuracies in PET corrections during reconstruction (e.g., scatter and dead-time correction and lutetium yttrium orthosilicate background subtraction). P2 received a single lobar injection in the right hepatic artery before lobectomy, resulting in a more uniform absorbed dose distribution in segments S5–S8 than in P1 due to a more widespread microsphere distribution. Most of the resin microspheres were directed to the right lobe, but a substantial amount of activity reached the left lobe, possibly because the large number of microspheres led to a reflux into unintended artery branches (9), explaining the high doses in segments 4a and 4b and stressing the need for posttreatment dosimetry. Although P2 was injected with a much lower activity than P1 (25%), the absorbed dose for the entire liver volume was 35% of P1’s liver dose because of the much smaller liver mass (919.8 g and 1,504.8 g, respectively). Low VOI masses (2–26 g, derived from organ volumes), such as those of the vessels, can cause even a very low 90Y activity to generate a high absorbed dose with a high degree of uncertainty. This also explains why the absorbed dose in S5 and S7 was greater for P2 than for P1 despite the lower injected activity. The intraliver discrepancies and the changes in absolute dose values indicate the importance of conducting a segmental dose assessment for 90Y radioembolization instead of evaluating the whole liver dose, which includes the total mass even if not irradiated and decreases the mean absorbed dose. Furthermore, recent studies showed lobules trapping 1–453 microspheres, resulting in a highly nonuniform distribution (14) and creating high doses locally. It is therefore critical to measure dose heterogeneity and move toward high-resolution dosimetry.
CONCLUSION
Personalized dosimetry is of great interest in TARE. A detailed evaluation of the absorbed dose in the liver through the Couinaud liver segments allows a better understanding of the microsphere distribution and an evaluation of the treatment. The whole liver absorbed doses calculated from 2 different PET scans were in high agreement with each other, indicating that both conventional and total-body PET provide good 90Y dosimetry. This agreement builds confidence about using 90Y PET over bremsstrahlung SPECT, with the possibility of assessing microsphere placement and dosimetry after treatment. Performing segmental liver dosimetry not only can indicate the dose–response relationship of the treatment but also can help improve patient care. Understanding the activity may either confirm the planning or elucidate an unexpected distribution and might support an increase of the injected activity when low toxicity is confirmed. The uEXPLORER provides a more detailed activity and absorbed dose distribution, translating into a more accurate visualization and quantification of microsphere clusters. This ability is particularly important when analyzing liver segments or small volumes and tumors. Although uEXPLORER images are visibly clearer, only the relative difference from conventional PET can be computed, since there is no in vivo ground truth to confirm the microsphere distributions. The better accuracy observed in the small spheres of the NEMA phantom and the greater spatial resolution of uEXPLORER made coregistration between the PET and CT images faster and more accurate, indicating the potential of total-body PET for intraliver dosimetry. This potential will be investigated in further patient studies.
DISCLOSURE
Funding for this work was provided by NIH grant R01 CA206187, which is supported by NCI, NIBIB, and the Office of the Director, and by R01 CA249422. No other potential conflict of interest relevant to this article was reported.
KEY POINTS
QUESTION: What is the impact of evaluating the TARE dose distribution at the liver-segment scale, and what is the advantage of using high-sensitivity total-body PET?
PERTINENT FINDINGS: Segmental calculation of the absorbed dose resulted in large discrepancies between the total-body and conventional PET scanners, whereas evaluation of the entire liver exhibited good agreement and the uEXPLORER showed a better signal-to-noise ratio in both phantom and patient evaluations.
IMPLICATIONS FOR PATIENT CARE: The use of PET images opens the possibility of posttreatment follow-up and dosimetry with the calculation of the dose absorbed by Couinaud liver segments, which helps in treatment evaluation through detailed separation of irradiated and nonirradiated volumes.
Footnotes
Published online Nov. 18, 2021.
- © 2022 by the Society of Nuclear Medicine and Molecular Imaging.
REFERENCES
- Received for publication September 1, 2021.
- Revision received November 8, 2021.


