


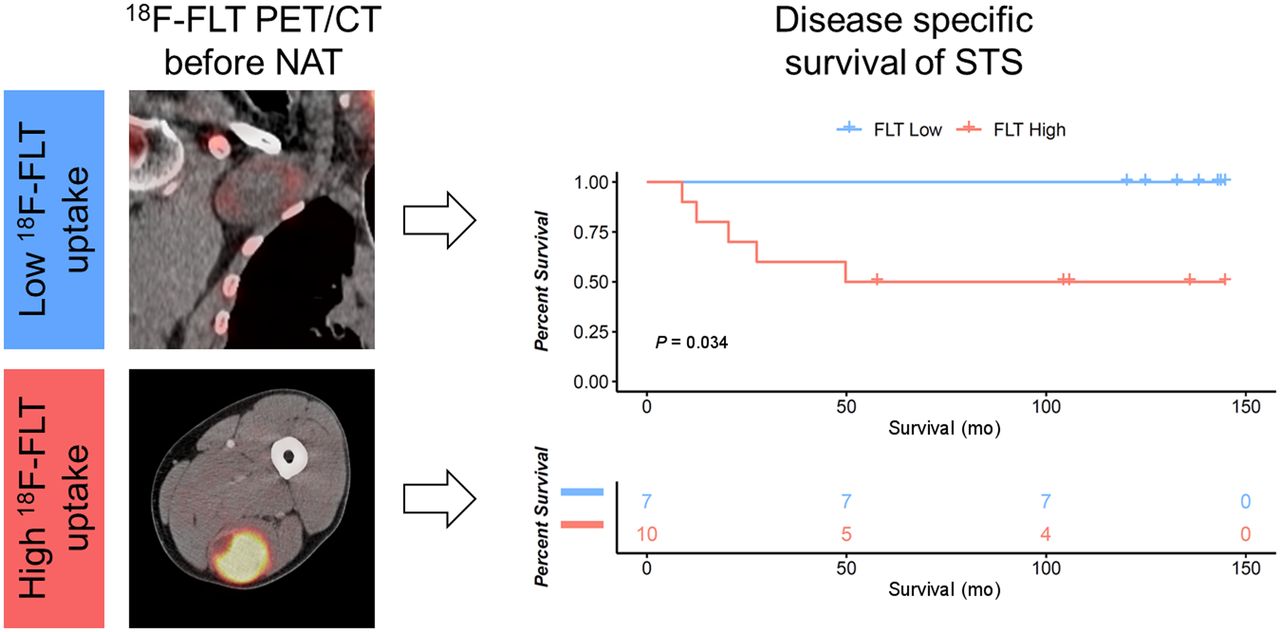
Visual Abstract

Abstract
The purpose of this study was to evaluate 18F-FLT PET/CT as an early prognostic imaging biomarker of long-term overall survival and disease-specific survival (DSS) in soft-tissue sarcoma (STS) patients treated with neoadjuvant therapy (NAT) and surgical resection. Methods: This was a 10-y follow-up of a previous single-center, single-arm prospective clinical trial. Patients underwent 18F-FLT PET/CT before treatment (PET1) and after NAT (PET2). Posttreatment pathology specimens were assessed for tumor necrosis or fibrosis and for Ki-67 and thymidine kinase 1 expression. Maximally selected cutoffs for PET and histopathologic factors were applied. Survival was calculated from the date of subject consent to the date of death or last follow-up. Results: The study population consisted of 26 patients who underwent PET1; 16 of the 26 with primary STS underwent PET2. Thirteen deaths occurred during a median follow-up of 104 mo. In the overall cohort, overall survival was longer in patients with a low than a high PET1 tumor SUVmax (dichotomized by an SUVmax of ≥8.5 vs. <8.5: not yet reached vs. 49.7 mo; P = 0.0064). DSS showed a trend toward significance (P = 0.096). In a subanalysis of primary STS, DSS was significantly longer in patients with a low PET1 tumor SUVmax (dichotomized by an SUVmax of ≥8 vs. <8; P = 0.034). There were no significant 18F-FLT PET response thresholds corresponding to DSS or overall survival after NAT at PET2. Conclusion: 18F-FLT PET may serve as a prognostic baseline imaging biomarker for DSS in patients with primary STS.
Soft-tissue sarcomas (STSs) comprise approximately 1% of adult cancers (1) but constitute a family of more than 50 histotypes (2) that present quite differently in biologic characteristics and clinical behavior.
Histologic tumor grading by the French Federation of Cancer Centers Sarcoma Group (FNCLCC) is regarded as the gold standard for prognostication and guides the clinical management of STS patients (3). The distinction between low, intermediate, and high grade is determined by 3 parameters: differentiation, mitotic activity, and the extent of tumor necrosis. However, the FNCLCC system has several limitations, including lack of applicability to all sarcoma histotypes, inherent difficulty in reproducibly assessing sarcoma differentiation, and undersampling from core-needle biopsy (4,5). In addition, the FNCLCC system was developed on untreated tumors. Grading on post–neoadjuvant therapy (NAT) resections in STS is not advised since tumor necrosis cannot be distinguished from NAT-induced necrosis.
Genomic tests might in the future replace or complement current histologic grading in STS (6). The complexity index in sarcomas is a prognostic gene expression signature that comprises 67 genes involved in pathways of mitosis control and chromosome segregation (7). The complexity index in sarcomas has been identified as a better prognostic factor of metastasis-free survival than the FNCLCC system, irrespective of the STS histotype (7).
Proliferative activity–dependent accumulation of 3′-deoxy-3′-fluorothymidine (18F-FLT) has been demonstrated for a variety of solid and hematologic neoplasms; however, varying degrees of correlation between 18F-FLT uptake and histologic markers of proliferation, such as Ki-67, have been reported (8,9).
In the current study, we correlated 18F-FLT uptake at pre- and post-NAT PET, changes in 18F-FLT uptake, and post-NAT histologic variables (percentage tumor necrosis, Ki-67, and thymidine kinase 1 [TK1] expression) with overall survival and disease-specific survival (DSS) in patients previously enrolled in a prospective single-center, single-arm exploratory study. The hypothesis was that 18F-FLT PET might be used as a prognostic imaging biomarker of DSS in patients with STS.
MATERIALS AND METHODS
Study Design and Patients
Between October 2008 and September 2009, 26 patients with high-grade STS and 1 patient with osteosarcoma were enrolled in a prospective single-center, single-arm exploratory study that investigated the cell proliferation response to NAT as measured by 18F-FLT PET/CT (Institutional Review Board [IRB] trial 07-03-110) (8). This previous study enrolled adult patients (≥18 y) who were scheduled to undergo NAT before surgical resection of a biopsy-proven sarcoma. Exclusion criteria were unresectable disease, performance status preventing the initiation of NAT, systemic therapy within 6 mo of study participation, a synchronous second malignancy, and the inability to tolerate a PET/CT study. For the purpose of the current study, the patient with osteosarcoma was excluded; therefore, the current study population consisted of 26 patients; 19 of the 26 (73%) had primary disease, and 7 (27%) had recurrent or residual disease. Two of the 19 patients with primary disease had a contemporary history of a secondary malignancy (hepatocellular carcinoma and breast cancer).
All 26 patients underwent 18F-FLT PET/CT before initiation of NAT, and 20 patients (77%), after completion of NAT. Six patients did not undergo 18F-FLT PET/CT after NAT (PET2): two of these patients exhibited a low SUVmax at 18F-FLT PET/CT before treatment (PET1) (SUVmax, 1.7 and 2.0), two had a further diagnostic workup after PET1 that revealed unresectable disease, one had a synchronous secondary malignancy at the time of PET 1 (hepatocellular carcinoma), and one declined to undergo PET2.
The median interval between treatment initiation and PET1 and between PET1 and PET2 was 0.7 wk (interquartile range [IQR], 0.1–1.5 wk) and 11 wk (IQR, 10–16.7 wk), respectively. The patient demographics and clinical characteristics are summarized in Tables 1 and 2.
Clinical and Pathologic Characteristics (n = 26)
Treatment Characteristics (n = 26)
Follow-up of patients previously enrolled in IRB trial 07-03-110 was approved by the UCLA IRB, and the necessity for outcome-specific consent was waived by the IRB for the current trial (IRB study 20-001899).
18F-FLT PET/CT Imaging and Analysis
Of the 46 18F-FLT PET/CT scans, 43 (93%) were performed on a Siemens Biograph 64 TruePoint PET/CT scanner and 3 (7%) on a Siemens Emotion Duo PET/CT scanner approximately 1 h after a median injected activity of 247.9 MBq (IQR, 229.4–255.3 MBq). Intravenous and oral contrast media were administered in 33 scans (72%) and 36 scans (78%), respectively.
Several SUV parameters were assessed on PET 1 and PET2: SUVmax, SUVpeak, SUVmean, and SUV for total-lesion FLT with a 40%, 50%, 60%, and 80% cutoff of SUVmax. Because SUVmax proved to be equal or superior to the other PET parameters, we selected SUVmax for further analyses. 18F-FLT PET/CT images were interpreted by 1 reader. The reader was aware of the sarcoma diagnosis but not of the treatment regimen or other clinical and outcome data.
Posttreatment pathology specimens were assessed by tumor necrosis or fibrosis and by Ki-67 and TK1 expression as described previously (8).
Treatment
Twenty-three of 26 patients (88%) underwent NAT followed by complete surgical resection. Ten patients (38%) underwent neoadjuvant ifosfamide-based treatments, 5 patients (19%) had gemcitabine-based therapy, 1 patient (4%) underwent treatment with doxorubicin (75 mg/m2), 1 patient (4%) was treated with paclitaxel (175 mg/m2) and bevacizumab, and 1 patient (4%) was treated with ridaforolimus as part of a phase II clinical trial. Standard chemotherapy administrations were previously reported (8). Gastrointestinal stromal tumors (n = 3; 12%) were treated with imatinib at a dose of 400 mg orally per day. Two patients (8%) received neoadjuvant external-beam radiation only. Ten patients (38%) underwent neoadjuvant chemoradiation therapy. Adjuvant and recurrent treatment regimens are listed in Table 2.
Histopathology
Pathology specimens were reviewed by a pathologist with expertise in sarcoma pathology, as reported previously (8).
Statistics
Quantitative variables are presented as median and IQR or as mean and SD when appropriate. Statistics were performed using R, version 4.0.2 (R Core Team 2020). SUV cutoffs were delineated using maximally selected rank statistics as implemented in the maxstat R package (http://cran.r-project.org/web/packages/maxstat/index.html). Maximally selected rank statistics evaluated the log-rank comparisons of survival along the continuous absolute SUVmax spectrum. Selected cutoffs represent the defined highest threshold for statistical discrimination between values along the SUVmax spectrum. Dichotomization via median SUVmax was not included because the maximally selected SUVmax of 8.5 was equivalent to the median SUVmax of 8.7 with low (n = 7) and high (n = 10) groups for both. Changes in SUVmax between PET1 and PET2 were dichotomized at a threshold of 60%. Post-NAT tumor necrosis, Ki-67, and TK1 expression were dichotomized at thresholds of at least 95%, 50%, and 18%, respectively. Survival was calculated from the date of subject consent to the date of death or last follow-up. Deaths included in the survival analysis were categorized as disease-specific death or all-cause mortality, which entailed non–disease-specific death and unknown causes of death. Survival was estimated using the method of Kaplan and Meier. A P value less than 0.05 was considered to indicate statistical significance.
RESULTS
Outcome Assessment
The cutoff for last follow-up was January 21, 2021. The median follow-up was 104 mo (maximum, 144.8 mo). The median overall survival was 106 mo (95% CI, 31.9–not yet reached [NYR]).
Eleven patients (42%) had no evidence of disease, 10 patients (38%) died of disease, 2 (8%) were alive with disease, and 3 (12%) died of another cause. The median follow-up in patients alive at the last follow-up date was 104 mo (IQR, 27.8–141.1 mo).
Imaging Characteristics
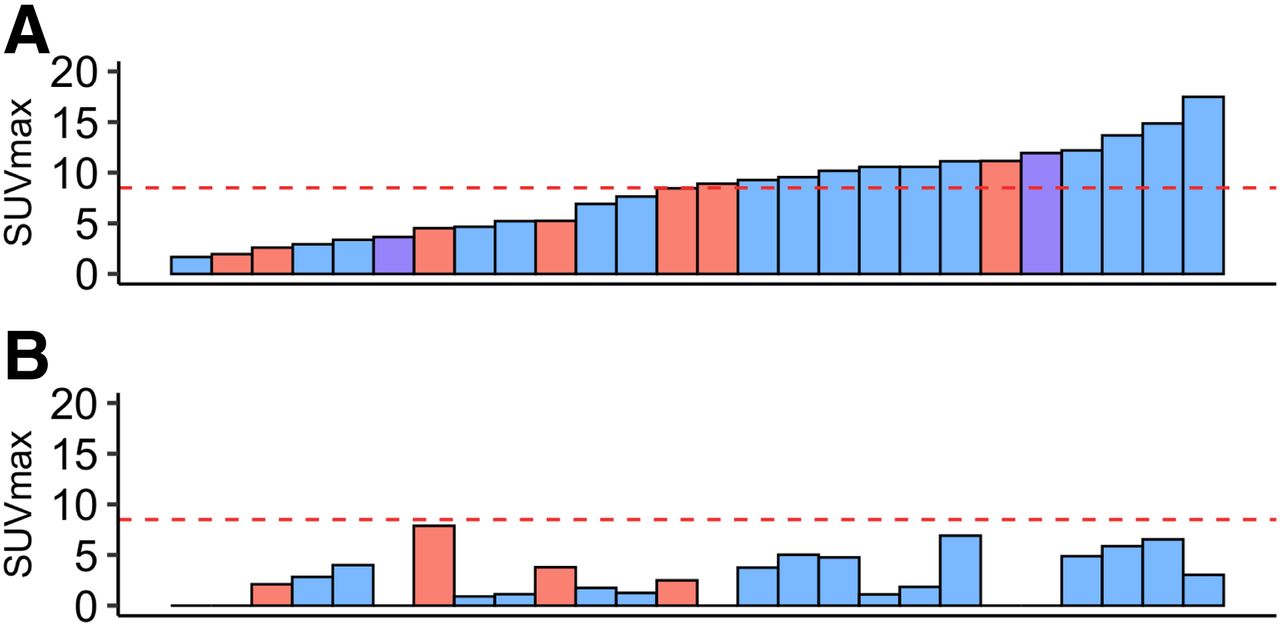
The tumor SUVmax of all patients averaged 6.6 ± 3.7 (median, 7.1; range, 1.7–16.1) and 3.6 ± 2.1 (median, 3.4; range, 0.9–7.9) at PET1 and PET2, respectively (Fig. 1).

Waterfall diagram of SUVmax at PET1 (A) and PET2 (B). Primary tumors are depicted in blue, recurrent or residual tumors in red, and patients with history of secondary malignancy in purple. Red line indicates maximally selected SUVmax cutoff of 8.5 to dichotomize patients into low and high baseline 18F-FLT uptake.
The tumor SUVmax of primary STS averaged 8.1 ± 4.3 (median, 8.7; range, 1.7–17.5) and 2.8 ± 2.4 (median, 2.3; range, 0–6.9) at PET1 and PET2, respectively.
The tumor size of all patients averaged 8 ± 5 cm (median, 6.4 cm; range, 1.2–20.6 cm) at baseline and decreased to 6.9 ± 3.4 cm (median, 6.1 cm; range, 1.7–14.5 cm) at PET2.
Imaging Biomarkers
PET1
Overall survival was significantly longer in patients with a low than a high tumor SUVmax (dichotomized by an SUVmax of ≥8.5 vs. <8.5: NYR vs. 49.7 mo; P = 0.0064) (Fig. 2A). DSS showed a trend toward significance (NYR vs. 49.7 mo; P = 0.096) (Fig. 2B).
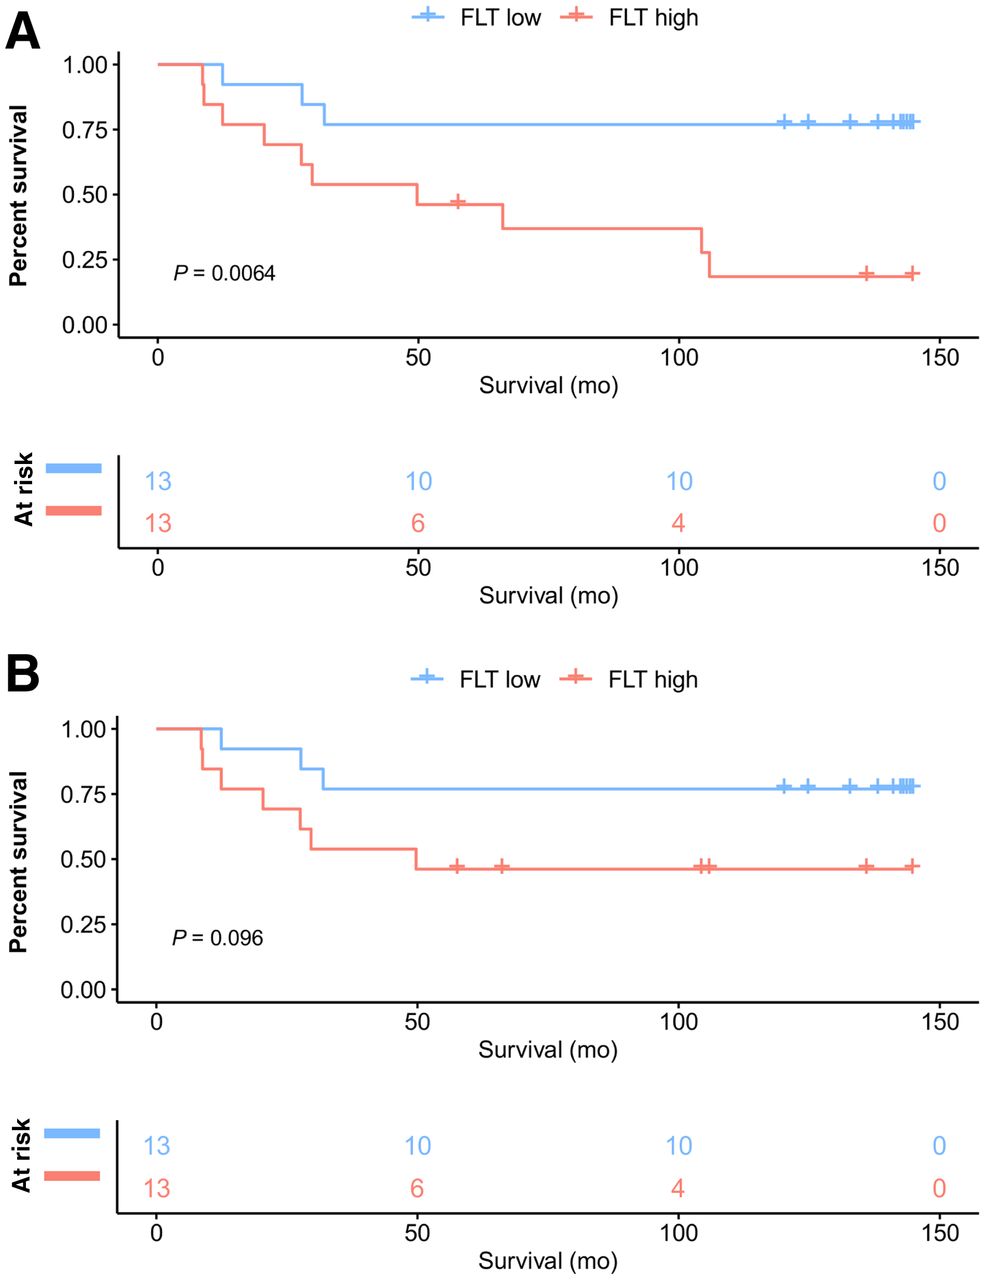
Kaplan–Meier curves for overall survival (A) and DSS (B) in all patients (n = 26) dichotomized by SUVmax of ≥8.5 vs. <8.5 at PET1.
In a subanalysis of primary STS (17/26 patients), DSS was significantly longer in patients with a low than a high tumor SUVmax (dichotomized by an SUVmax of ≥8 vs <8: NYR vs. NYR; P = 0.034) (Fig. 3).
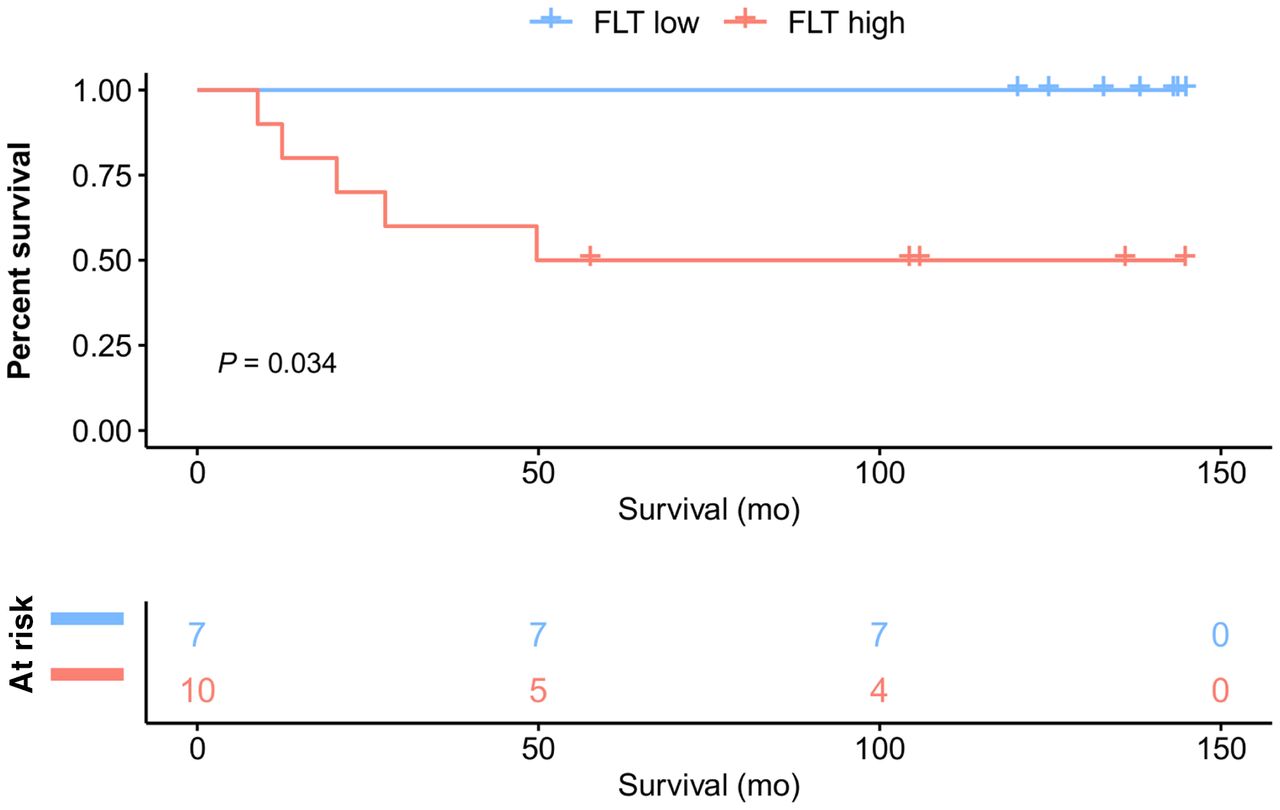
Kaplan–Meier curves for DSS in primary STS (17/26 patients) dichotomized by SUVmax of ≥8.5 vs. <8.5 at PET1.
PET2 and Changes Between PET1 and PET2
In primary-STS patients who underwent PET2 (n = 16/17), neither absolute PET2 tumor SUVmax (dichotomized by an SUVmax of ≥5 vs. <5: NYR vs. 20.4 mo; P = 0.25) nor decreases in SUVmax of at least 60% between PET1 and PET2 (NYR vs. NYR; P = 0.56) were significantly correlated with DSS survival.
Histopathologic Biomarkers
DSS in primary-STS patients (16/26 patients) with a histopathologic response in the resected specimens after NAT (n = 3) did not significantly differ from that in patients without a post-NAT histopathologic response (n = 13) (dichotomized by tumor necrosis and fibrosis of ≥95% vs. <95%: NYR vs. NYR; P = 0.86).
Ki-67 expression was available in 14 of 17 primary-STS patients. DSS showed a trend toward being prolonged in patients with a low (n = 11) versus a high post-NAT Ki-67 expression (n = 3) (dichotomized by an Ki-67 of ≥50% vs. <50%: 27.5 mo vs. NYR; P = 0.057) (Supplemental Fig. 1; supplemental materials are available at http://jnm.snmjournals.org).
TK1 expression was available in 14 of 17 primary-STS patients. DSS did not significantly differ between patients with a low post-NAT TK1 expression (n = 4) and those with a high post-NAT TK1 expression (n = 10) (dichotomized by an TK1 of ≥18% vs. <18%: NYR vs. NYR; P = 0.25).
DISCUSSION
In this post hoc analysis of patients with STS, low pretreatment 18F-FLT uptake served as an early prognostic imaging biomarker of long-term survival. The prognostic value of 18F-FLT uptake at initial diagnosis has been reported for several malignancies, such as lymphoma (10), non–small cell lung cancer (11), and pancreatic cancer (12). Here, we report the first—to our knowledge—long-term outcomes predicted by baseline 18F-FLT uptake in STS patients who underwent NAT.
Because 18F-FLT uptake in other tumors has frequently been associated with the proliferation rate of cancer cells, therapy-induced alterations in intratumoral 18F-FLT uptake have been proposed as an early imaging biomarker for therapy response and outcome (6–8). However, in this study 18F-FLT uptake after NAT and changes in 18F-FLT uptake across treatment did not significantly correlate with improved survival.
Recent literature surrounding the application of 18F-FLT illustrates that 18F-FLT accumulation is not solely a correlate of tumor cell proliferation rate (13,14). 18F-FLT is a substrate for TK1, a proximal mediator of the pyrimidine salvage pathway that functions in parallel with the de novo pathway to produce deoxythymidine triphosphate for DNA replication and repair (15). Thus, 18F-FLT avidity is influenced by the relative activity of de novo and salvage pathways, which are in turn regulated by substrate abundance, gene expression, and oncogene or tumor suppressor activity (15,16). Uptake of 18F-FLT is not solely isolated to tumor cells and is impacted by the active proliferation of T cells after removal of cytotoxic T-lymphocyte–associated antigen 4 checkpoint inhibition (17). More recently, 18F-FLT uptake in tumors has been shown to be elevated alongside interferon signaling–driven thymidine phosphorylase expression in preclinical xenograft models (18,19). Given that innate and adaptive immune cells are a dominant source of interferon, 18F-FLT uptake could also reflect intratumoral immune cell infiltration and elevated cytokine signaling.
An additional potential reason for discordant 18F-FLT PET findings after NAT in the current study might be the late timing of PET2 12 wk after the start of NAT. The low 18F-FLT uptake at PET2 might in part not represent a cytotoxic treatment effect but viable tumor with low 18F-FLT uptake due to restricted tracer delivery, internalization, and trapping. All considered, future studies investigating 18F-FLT should integrate clinical observations with a detailed molecular and cellular assessment of biopsy tissue, which could enable the identification of molecular mechanisms driving PET probe accumulation.
Several potential limitations of our study merit consideration. First, this was a small pilot study; therefore, it was not adequately powered to detect small differences. For example, patients with a low post-NAT Ki-67 (≤50%) and a low post-NAT TK1 (≤18%) showed a trend toward a prolonged DSS, but the significance of this finding needs further evaluation. Second, imaging cutoffs were not predefined but maximally selected. Third, patients with a variety of sarcoma subtypes were included in this study.
CONCLUSION
The current study demonstrates that low 18F-FLT uptake at initial diagnosis correlates with long-term survival in primary STS and may be useful in determining treatment strategies. 18F-FLT uptake at post-NAT PET does not improve outcome prediction.
DISCLOSURE
No potential conflict of interest relevant to this article was reported.
KEY POINTS
QUESTION: Can 18F-FLT PET/CT be used as a prognostic imaging biomarker of DSS in patients with STS?
PERTINENT FINDINGS: We report the first long-term outcomes (median follow-up, 104 mo) predicted by 18F-FLT PET/CT before initiation of NAT in patients with STS.
IMPLICATIONS FOR PATIENT CARE: Pretreatment tumor grading guides clinical decision making and prognostication of STS patients. However, given that standard histopathologic grading of STSs has its limitations, new biomarkers are needed to improve clinical management and prognostication and to serve as predictive factors for treatment response.
Footnotes
Published online Sep. 30, 2021.
- © 2022 by the Society of Nuclear Medicine and Molecular Imaging.
REFERENCES
- Received for publication April 26, 2021.
- Revision received August 5, 2021.
In this issue


Jump to section
Related Articles
Cited By...
- No citing articles found.