


Visual Abstract

Abstract
16α-18F-fluoro-17β-estradiol (18F-FES) is a PET tracer characterizing the expression of the estrogen receptor (ER). Because therapy can interfere with the kinetics and biodistribution of 18F-FES, the aim of this study was to describe the biodistribution of 18F-FES in patients with metastatic ER-positive (ER+) breast cancer undergoing treatment with rintodestrant (G1T48), a novel selective ER degrader. Methods: Eight patients underwent 18F-FES PET/CT imaging at baseline, 4–6 wk during treatment with rintodestrant (interim), and after treatment. After intravenous administration of 200 MBq (±10%) of 18F-FES, a 50-min dynamic PET/CT scan of the thorax was obtained, followed by a whole-body PET/CT scan 60 min after injection. Blood samples were drawn for measuring whole blood and plasma activity concentration and the parent fraction of 18F-FES. Volumes of interest were placed in the aorta ascendens and in healthy tissues on both dynamic and whole-body PET scans. SUVs and target-to-blood ratios (TBRs) were calculated. Areas under the curve (AUCs) of input functions and time–activity curves were calculated as a measure of uptake in different regions. Results: 18F-FES concentration in whole blood (and plasma) significantly (P < 0.05) increased at interim with median AUCs of 96.6, 116.6, and 110.3 at baseline, interim, and after treatment, respectively. In ER-expressing tissues, that is, the uterus and the pituitary gland, both SUV and TBR showed high 18F-FES uptake at baseline, followed by a decrease in uptake at interim (uterus: SUV −50.6% and TBR −58.5%; pituitary gland: SUV −39.0% and TBR −48.3%), which tended to return to baseline values after treatment (uterus: SUV −21.5% and TBR −37.9%; pituitary gland: SUV −14.2% and TBR −26.0%, compared with baseline). In other healthy tissues, tracer uptake remained stable over the 3 time points. Conclusion: The biodistribution of 18F-FES is altered in blood and in ER-expressing healthy tissues during therapy with rintodestrant. This indicates that rintodestrant alters the kinetics of the tracer, possibly affecting interpretation and quantification of 18F-FES uptake. Of note, 6 d or more after treatment with rintodestrant ended, the biodistribution returned to baseline values, consistent with recovery of ER availability after washout of the drug.
Estrogen receptor–positive (ER+) breast cancer is the most common diagnosed breast cancer type among women worldwide (1,2). Patients with ER+ tumors can be treated with ER-targeted therapy, also known as endocrine therapy. Endocrine therapies include selective ER modifiers (SERMs) and degraders (SERDs) (3). These therapies decrease ER availability by binding to the ER to interfere with estrogen binding or degrading the ER, thus effectively eliminating ER expression.
The most frequently prescribed SERD in clinical practice is fulvestrant. However, its use is compromised by its poor bioavailability coupled with its intramuscular route of administration. Therefore, novel oral SERDs are being developed, including rintodestrant (G1T48), which can be administered at (relatively) higher doses with less patient discomfort (4).
For effective treatment of patients it is important to accurately describe and evaluate the mode of action of these novel ER-targeted therapies. PET/CT using ER-targeting tracers, such as 16α-18F–fluoro-17β-estradiol (18F-FES), is a promising approach to investigate this (5,6). 18F-FES uptake, as measured 60 min after tracer administration using SUVs, correlates strongly with ERα expression (as compared with ER expression in tumor biopsies), with an overall sensitivity and specificity of 84% (95% CI, 73%–91%) and 98% (95% CI, 90%–100%), respectively (7). In addition to clinical studies to identify patients likely to respond to endocrine therapy, 18F-FES PET appears to be an interesting tool for response prediction and dose finding for SERMs or SERDs (3,5,8–12). For patients receiving SERMs or SERDs, such as tamoxifen or fulvestrant, respectively, it is known that a decrease in 18F-FES uptake after start of therapy correlates with response to these drugs (10,12). In addition, this during-therapy 18F-FES PET imaging strategy can also help in dose-finding studies with novel ER-targeting drugs to establish the optimal dose to achieve maximum ER blockade (7).
However, to reliably assess changes in ER availability during endocrine therapy, it is essential to investigate the biodistribution of the tracer, that is, its uptake in blood pool and healthy tissues (with and without target expression) under various conditions (with and without therapy). In the case uptake changes during treatment, one can conclude that the given therapy interferes with the kinetics of the tracer. Therefore, the aim of this prospective substudy was to describe the biodistribution of the 18F-FES tracer in patients with metastatic ER+ breast cancer undergoing treatment with rintodestrant.
MATERIALS AND METHODS
Postmenopausal female patients with histologically proven metastatic ER+/human epidermal growth factor receptor 2 (HER2)− breast cancer were prospectively included in this study (substudy of a phase I trial, NCT03455270) at the Amsterdam University Medical Centers – location VUmc. Patients had progressive disease after having received a maximum of 3 lines of cytotoxic chemotherapy and 3 lines of endocrine therapy in the metastatic setting. Patients were excluded when they received treatment with ER modulators (i.e., tamoxifen or fulvestrant) no more than 5 wk before inclusion as these drugs interfere with the availability of ER. All patients provided written informed consent in accordance with the regulations of the Medical Ethics Review Committee (METc no. 2018/085) of the Universitair Medisch Centrum Groningen.
Treatment
Eligible patients received rintodestrant orally once a day. A 3 + 3 dose escalation design was used to determine the recommended phase 2 dose (based on the pharmacokinetic, antitumor activity, and toxicity profile of the drug) (4). The starting dose in the first cohort was 200 mg, which could be escalated each time with 200 mg in the following cohorts, that is, cohort 2, 400 mg; cohort 3, 600 mg; and the like. The dose could be maximally escalated up to 2,000 mg/d. Patients would receive rintodestrant until clinically or radiographically progressive disease had been determined or there was unacceptable toxicity.
PET Imaging
PET scans were obtained on an Ingenuity TF PET/CT scanner (Philips). Patients underwent dynamic and whole-body 18F-FES PET/CT imaging at 3 different time points: at baseline, 4 wk during treatment with rintodestrant (interim), and after treatment (scans were acquired within 10 d of the last dose of rintodestrant). All patients were instructed to fast for 4 h before the start of the scan to avoid high tracer uptake in the hepatobiliary and gastrointestinal tracts as these are the metabolization and elimination routes of the tracer. For each scan, patients received 2 venous cannulae, 1 for tracer injection and 1 for blood sampling. First, a low-dose CT scan of the thorax was obtained for attenuation correction. Next, a 50-min dynamic 18F-FES PET scan of the thorax (18.4 cm axial field of view) was obtained, starting directly after intravenous administration of 200 (±10%) MBq of 18F-FES. Subsequently, a whole-body low-dose CT scan was acquired for attenuation correction, followed by a whole-body 18F-FES PET scan at 60 min after injection (skull vertex to mid-thigh), with 2–3 min per bed position depending on patient weight (2 min for 61–90 kg and 3 min for >90 kg).
PET data were normalized and corrected for dead time, randoms, scatter, and decay. In combination with CT-based attenuation correction, both scans provided images with a final voxel size of 4 × 4 × 4 mm and a spatial resolution of 5–7 mm in full width at half maximum. Dynamic PET scans were reconstructed using a 3-dimensional row action maximum-likelihood reconstruction algorithm (13) into 27 frames (1 × 10, 4 × 5, 3 × 10, 3 × 20, 2 × 30, 7 × 60, 2 × 150, 3 × 300, and 2 × 600 s). The whole-body scans were reconstructed using the BLOB-OS-TF reconstruction algorithm (14).
Blood Sampling
Before tracer administration, a venous blood sample was taken to determine estradiol and sex-hormone binding globulin (SHBG) levels, as these could potentially affect 18F-FES uptake (15). After tracer administration, venous blood samples were collected at 5, 10, 20, 30, 40, 55, and ±90 min after injection. Before each sample, 2–5 mL of blood were drawn, followed by drawing a 7-mL sample and flushing of the cannula with 2.5 mL of saline afterward.
Blood was collected in a heparin tube and centrifuged for 5 min at 4,000 revolutions per minute (Hettich universal 16, Depex B.V.). Plasma was separated from blood cells, and 1 mL was diluted with 2 mL of 0.15 M HCl and loaded onto an activated tC2 Sep-Pak cartridge (Waters). The solid-phase extraction was washed with 5 mL of water. These combined fractions were defined as the polar radiolabeled metabolite. Thereafter, the tC18 Sep-Pak cartridge was eluted with 1.5 mL of methanol followed by 1.5 mL of water. This eluate was defined as the nonpolar fraction and was analyzed using high-performance liquid chromatography. The stationary phase was a Phenomenex Gemini C18, 10 × 250 mm, 5 μm, and the mobile phase was acetonitril/0.1% ammonium acetate in a mixture of 55/45 at a flow of 3 mL/min.
Whole-blood and plasma activity concentration and the parent fraction of 18F-FES were measured. These data were used to correct the image-derived (whole-blood) input function to acquire a metabolite-corrected plasma input function.
Data Analysis: Dynamic and Whole-Body 18F-FES PET Data
Volumes of interests (VOIs) were defined on PET and CT images using software developed in house (Accurate tool, Ronald Boellaard) (16). For the whole-body scans, fixed-size spheric VOIs with a diameter of 1, 2, or 4 cm (depending on the size of the organ) were placed in various healthy organs, that is, white matter in the brain, pituitary gland, lung, breast, bone, muscle, liver, spleen, subcutaneous fat, kidney, and uterus. Furthermore, if applicable up to 5 metastatic bone lesions were defined using a 40% isocontour of the max voxel value (17). PET activity concentration from these VOIs, both averaged SUVs and target-to-blood ratios (TBRs), were calculated according to Equations 1 and 2, respectively.
 Eq. 1
Eq. 1
 Eq. 2
Eq. 2
Fixed-size VOIs were also defined in healthy organs that were visible on the dynamic 18F-FES scans, that is, lung, breast, bone, muscle, and liver. For these VOIs, time–activity curves were generated, which were corrected for administered dose and body weight to generate SUV curves.
Image-derived input functions (IDIFs) were generated from dynamic 18F-FES scans, using the early frames (0–2.5 min) in which the first pass of the bolus was best visualized. A fixed-size VOI of 1.5 cm was placed in 5 consecutive axial planes within the lumen of the ascending aorta on the PET scan. The low-dose CT scan was used as a reference for anatomic localization. These VOIs were then projected onto all image frames to generate a whole-blood IDIF. All IDIFs were calibrated using the radioactivity concentrations in the venous blood samples. In addition, IDIFs were corrected for both plasma-to-blood ratios and metabolites to obtain metabolite-corrected plasma input functions. Furthermore, SUV input curves were generated by normalizing the IDIFs for administered dose and body weight. The area under the input curves (AUCs) was calculated to more precisely describe the uptake over the duration of the dynamic scan.
Statistical Analysis
Statistical analyses were performed using SPSS Statistics 26 (IBM Corp.). For blood sampling data, tracer uptake in the blood pool and healthy organs and median and interquartile ranges (IQRs) were reported. For assessing changes in clinical parameters and tracer uptake in blood pool and healthy organs between the various scanning time points, the Wilcoxon signed-rank test was used (paired testing). Differences were considered significant for a P value of less than 0.05 for observing trends in data.
RESULTS
Patients
Eight female patients with metastatic ER+ breast cancer with an average (±SD) age of 63 (±7.35) y (Supplemental Table 1; supplemental materials are available at http://jnm.snmjournals.org) were included. Patients received various doses of rintodestrant depending on the cohort in which they were included, ranging from 400 to 1,000 mg per day (Supplementals Table 1 and 2). A total of 20 dynamic and whole-body 18F-FES PET/CT scans were obtained and evaluable: 8 scans were obtained at baseline, 7 scans at interim, and 5 scans after treatment. All patients scanned after treatment had discontinued treatment due to progressive disease with an average (±SD) treatment duration of 4.5 (±2.6) mo (Supplemental Table 1). After treatment, 3 scans were acquired at ≤2 d and 2 scans were acquired at ≥6 d after end of treatment (EoT). For 2 patients, the interim scans were obtained at 6 wk (instead of 4 wk) due to logistical issues.
The median injected 18F-FES doses were 187 (IQR, 181–196), 187 (IQR, 180–195), and 183.2 (IQR, 177.4–188.2) MBq (Wilcoxon test, P > 0.23) at baseline, interim, and after treatment, respectively. Median body weight at baseline, interim, and after treatment was 77 (IQR, 65–105), 81 (IQR, 66–114), and 81 (IQR, 64–108), respectively (Supplemental Table 2). Body weight decreased significantly (maximum decrease in weight: 7.4%) between baseline and after treatment (P = 0.04). This decrease was accompanied by a significant increase in total body fat between baseline and after treatment (P = 0.04), with total body fat volumes of 28.1 (IQR, 19.2–43.6), 32.1 (IQR, 19.5–50.0), and 32.2 L (IQR, 18.8–52.1) at baseline, interim, and after treatment, respectively. However, the percentage injected dose of 18F-FES in total body fat did not vary over the various time points (P > 0.05), with values of 24.2% (IQR, 19.7–28.4), 26.2% (IQR, 20.9–31.4), and 24.2% (IQR, 18.9–31.6) at baseline, interim, and after treatment, respectively.
Blood Sampling
Blood sampling data demonstrated that median estradiol levels in blood showed no difference over the various time points (P > 0.18), whereas SHBG levels changed after start of therapy: 66.5 (IQR, 26.0–121.5), 95.0 (IQR, 45.0–232.0), and 97.0 (IQR, 53.0–210.0) nmol/L at baseline, interim, and after treatment, respectively. SHBG levels showed a significant increase in values between baseline and interim (P < 0.02) and baseline and after treatment (P < 0.04; Supplemental Fig. 1).
Blood sampling data (Fig. 1) showed that median whole-blood activity concentrations, corrected for administered dose and patient weight, varied between SUVs of 1.4–1.5, 1.5–2.0, and 1.5–1.8 at baseline, interim, and after treatment, respectively (Fig. 1A). SUV increased at interim and tended to normalize to baseline values after treatment. The plasma–to–whole-blood ratios remained constant over the 3 different time points, ranging between 1.3 and 1.7 (Fig. 1B). The parent fraction of 18F-FES in plasma showed a similar pattern over the 3 different time points: a rapid decrease to ≈20% in the first 20 min after injection (Fig. 1C) was observed. After the first 20 min, the parent fraction of 18F-FES decreased quite slowly over time from 16% to 10%.
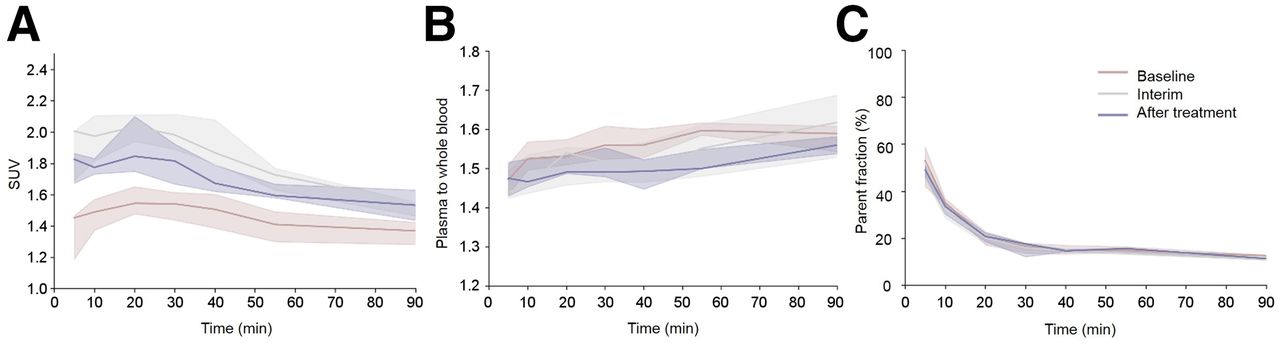
Venous blood sampling data of all patients obtained at the 3 different time points. (A) SUV whole blood data. (B) Plasma-to-whole blood ratios. (C) Parent fraction of 18F-FES in plasma. Data represent median of all values, with their corresponding IQRs.
Tracer Uptake in Blood Pool
Median areas under the curve (AUCs) of the whole blood IDIFs (corrected for administered dose and body weight) at baseline, interim, and after treatment were 96.6 (IQR, 86.3–123.3), 116.6 (IQR, 112.5–144.9), and 110.3 (IQR, 97.9–132.1), respectively (Fig. 2A, Supplemental Table 3), showing increased levels of the tracer in blood at interim (Wilcoxon test, P < 0.05). These findings were in accordance with the AUCs of the whole-plasma IDIFs (Fig. 2B, P < 0.05). Median AUCs of the metabolite-corrected plasma input functions also showed an increase at interim: 54.6 (IQR, 52.7–75.0), 63.6 (IQR, 57.6–77.8), and 63.6 (IQR, 53.4–90.9) at baseline, interim, and after treatment (Fig. 2C). However, these differences at interim were not significant. For the whole-blood, plasma, and metabolite-corrected plasma input curves, no differences in AUCs could be seen in patients scanned ≤2 d versus ≥6 d after EoT (Supplemental Table 3).
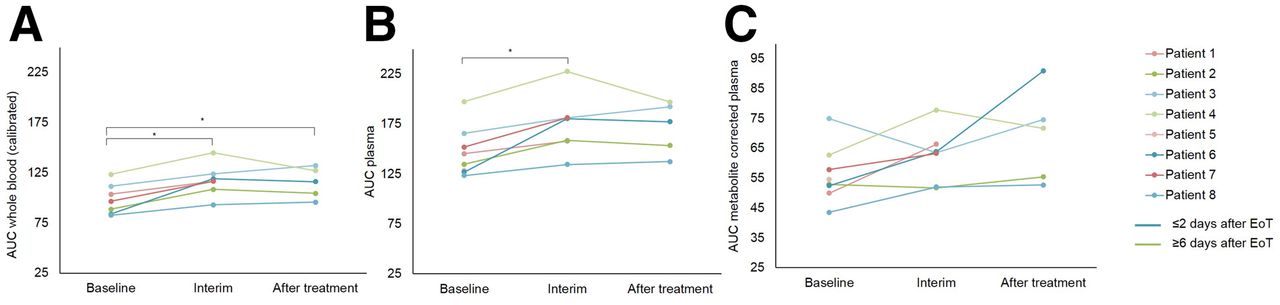
Tracer uptake in blood pool of each patient at 3 different time points. Whole blood calibrated with venous samples (A), plasma (B), and metabolite-corrected plasma (C) input curves. All curves have been corrected for administered dose and weight. At time of progression, patients were scanned ≤2 d (blue curves) or ≥6 d (green curves) after EoT. * P < 0.05
Visual Assessment of 18F-FES Uptake
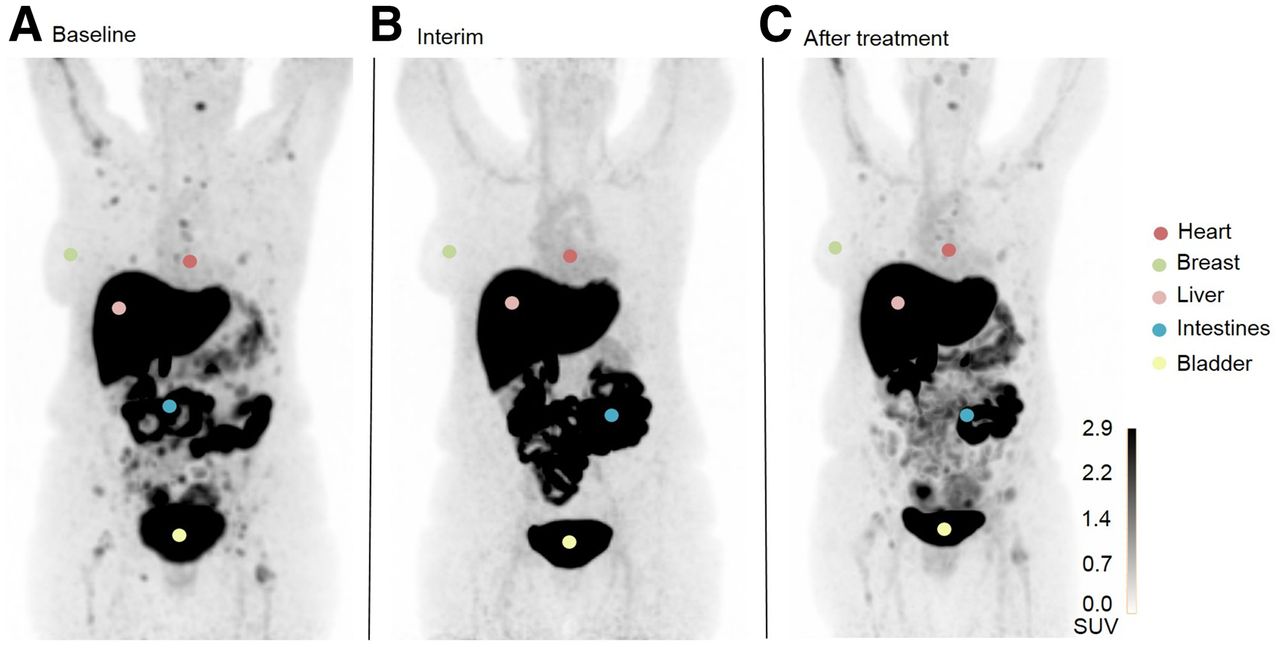
Using the whole-body PET scans, 18F-FES uptake in most healthy organs (except ER-expressing tissues such as the uterus and pituitary gland) was visually similar at all the imaging time points, with high tracer uptake in the liver, gallbladder, intestines, kidneys, and bladder (Fig. 3). At baseline, high 18F-FES uptake could be seen in the uterus and pituitary gland, which decreased at interim. However, 18F-FES uptake could be seen again in patients scanned several days after EoT. Patients scanned ≤2 d after EoT showed uptake similar to that seen at interim. In breast tissue, 18F-FES uptake remained visually similar at all time points.

Visual assessment of 18F-FES uptake in various healthy tissues in 1 patient at baseline (A), interim (B), and after treatment (C). This patient underwent interim scanning 10 d after EoT. Uterus, an ER-expressing organ, is not visible in these images as it is located behind bladder. Images are maximal-intensity projections.
Visual assessment of metastatic lesions showed 18F-FES uptake at baseline in 6 of 8 patients. At interim, no lesions could be visualized in 7 of 7 patients (Fig. 3). However, after treatment, lesions could be visualized again but only in patients scanned ≥6 d after EoT (2/5 patients).
Quantification of 18F-FES Uptake
Using the dynamic scans, we generated SUV time–activity curves for healthy breast, lung, liver, muscle, and bone as these were located in the field of view of the dynamic scan (Fig. 4, Supplemental Table 4). For all these tissues, no changes in AUCs could be observed over the 3 different time points (Wilcoxon test, P > 0.05).
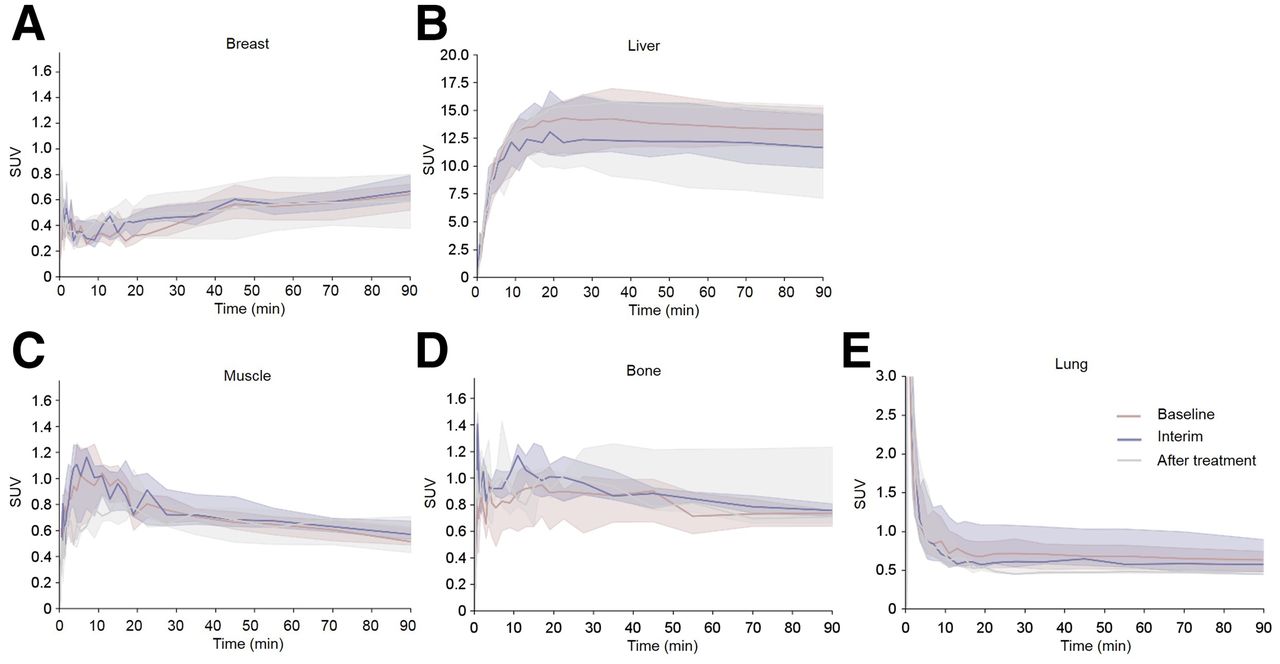
SUV time–activity curves (derived from dynamic scans) for various healthy tissue regions ([A] breast, [B] liver, [C] muscle, [D] bone. and [E] lung) of all patients at 3 different time points. Curves represent median of all values, with their corresponding IQRs.
Using whole-body scans, we assessed tracer uptake in healthy tissues using SUV and TBR (Supplemental Figs. 2 and 3). For SUV and TBR, in most healthy tissues including the bone, breast, kidney, liver, lung, muscle, subcutaneous fat, and spleen, 18F-FES uptake remained similar over the 3 different scanning time points. Quantification of tracer uptake in the uterus and pituitary gland confirmed the qualitative findings: for both SUV and TBR, 18F-FES uptake decreased at interim (uterus: SUV −50.6% and TBR −58.5%; pituitary gland: SUV −39.0% and TBR −48.3%; compared with baseline). No correlation could be found between the various doses of rintodestrant that patients received and changes in tracer uptake in these tissues (Spearman ρ correlation, P > 0.6), possibly suggesting that even at the lowest dose, the blockade of these tissues was near 100% or at least sufficiently high to reduce 18F-FES uptake below the level of detection. Interestingly after treatment, 18F-FES uptake increased to baseline values in patients scanned several days after EoT (uterus: SUV −2.4% and TBR −21.7%; pituitary gland: SUV −9.6% and TBR −12.0%; compared with baseline) whereas it remained reduced in patients scanned shortly after EoT (uterus: SUV −34.3% and TBR −48.7%; pituitary gland: SUV −30.0% and TBR −47.2%; compared with baseline).
At baseline, metastatic bone lesions showed significantly higher tracer uptake than did healthy bone: median SUVs of 1.6 (IQR, 1.4–2.1) and 0.7 (IQR, 0.5–0.8) and TBR values of 1.2 (IQR, 1.1–1.6) and 0.5 (IQR, 0.4–0.5) for lesions and healthy bone, respectively (Supplemental Fig. 4; P < 0.003). However, at interim, lesions could not be detected whereas tracer uptake in healthy bone could be quantified. After treatment, lesions could be visualized again but only in patients scanned ≥6 d after EoT. Similar to baseline, these lesions showed high tracer uptake compared with healthy bone: SUVs of 1.9 (IQR, 1.4–2.0) and 0.7 (IQR, 0.7–0.8) and TBR values of 1.1 (IQR, 0.8–1.2) and 0.5 (IQR, 0.4–0.5) for lesions and healthy bone, respectively (P < 0.003).
DISCUSSION
In this study, dynamic and whole-body 18F-FES PET/CT imaging was performed at baseline, interim and after treatment to determine the effect of rintodestrant on the biodistribution of the 18F-FES tracer.
Blood Sampling and Input Data
Blood sampling and input data showed that whole-blood and plasma activity concentrations of the tracer increased at interim and tended to return to baseline values after treatment. The increase in tracer activity concentrations is most likely the result of rintodestrant, which interferes with ER availability for binding 18F-FES (4). Therefore, more free tracer will be available in the circulation, resulting in higher whole-blood and plasma activity concentrations. However, other effects caused by the therapy could also potentially lead to these increased tracer concentrations in blood. We also found increased levels of SHBG. SHBG is a plasma glycoprotein that plays an important role in the transport and bioavailability of steroid hormones, including estradiol (18). It is known that therapies that increase the estradiol levels in circulation lead to an increase in SHBG levels (19,20). We did not observe a change in estradiol levels during therapy; however, it might be possible that the SHBG levels increased as a response to therapy with rintodestrant. Peterson et al. (15). showed that SHBG levels are inversely associated with 18F-FES uptake and subsequent higher levels of circulating 18F-FES in blood, as also observed in our study.
The tracer metabolism was similar for all time points. The parent fraction of 18F-FES rapidly decreased in the first 20 min after injection, indicating rapid metabolization of the tracer, in accordance with previous studies (5,21). After these 20 min, blood levels of radioactivity decreased quite slowly or remained fairly constant. Plasma–to–whole-blood ratios were constantly high over time, for all 3 time points. It is known that 35%–45% of the 18F-FES tracer is plasma protein–bound and that red cell binding is low, which might explain these constant high ratios over time (21).
Visual Assessment and Quantification of 18F-FES Uptake in Healthy Tissues
As seen in previous publications, our study confirmed physiologic high tracer uptake in the hepatobiliary, gastrointestinal, and urinary tract (5,22). This pattern was consistent over all time points. Additionally, in metastatic lesions and in ER-expressing healthy tissues (i.e., uterus and pituitary gland) high 18F-FES uptake could be seen at baseline, which is in accordance with previous studies (22,23). Tracer uptake decreased at interim, most likely due to the down-regulatory effect of rintodestrant or the ER-blocking effect of the drug. Interestingly, after treatment 18F-FES uptake returned to near baselines levels, specifically in patients scanned ≥6 d after EoT. In these cases, it is reasonable to assume that most of the administered drug is eliminated (half-life of rintodestrant: ≈16 h) (4) and that the ERs in lesions and in the uterus and pituitary gland are accessible for the tracer again. Indeed, in patients who were scanned shortly after EoT the uptake was still reduced, supporting that ER availability is still compromised due to the presence of the drug. These changes in 18F-FES uptake could not be observed in breast tissue, which is also known to have ER expression. Breast tissue constantly showed low 18F-FES uptake over the different time points. Compared with other ER-expressing tissues, for instance the uterus, the ER density in breast is significantly lower (24). Therefore, it can be expected that changes in uptake, potentially caused by therapy, are less prominent. In other healthy tissues, hardly any changes in tracer uptake could be detected, probably because in these tissues ER receptor expression is minimal or absent and thus the 18F-FES uptake is aspecific (24,25).
For quantification of tracer uptake in healthy tissues at the various imaging time points, AUCs of the SUV input functions (derived from the dynamic scans) and TBR and SUV (derived from the whole-body scans) were used. In general, in all healthy tissues (except the uterus and pituitary gland), AUCs, TBR, and SUV showed that tracer uptake remained similar over the different time points. TBR seems to be slightly more sensitive than SUV for assessing changes in biodistribution, probably as it also takes into account changes in tracer concentration in the blood pool (which do occur during therapy as can be seen in the sampling data and input functions).
Visualization of lesions was only possible at baseline and after treatment, the latter only in patients scanned ≥6 d after EoT, most likely related to recovery of the ER availability after washout of the drug as mentioned earlier. Overall, bone lesions showed higher 18F-FES uptake than healthy bone. These lesions are expected to have high ER expression causing more targeted uptake of the tracer, which is also more affected by ER degradation during treatment with rintodestrant. In healthy tissue the uptake is lower, consistent with aspecific uptake.
Limitations
Although the sample size may seem small, the strength of this study is that we collected dynamic and whole-body scans at 3 time points per patient, allowing a direct comparison of changes in biodistribution in a repeated measure design within 1 patient. As we investigated tracer uptake in healthy tissues, we expect that there will be limited variation between patients, which has been shown in similar previous PET biodistribution studies with comparable small sample sizes and which is also found in our study. Moreover, most quantitative PET study sample sizes are small, especially in the case in which an intensive scanning protocol is required, as was the case in this study.
Future Directions
18F-FES imaging performed before the start of therapy can identify ER+ disease to select patients for ER-targeted therapy. Complete blockage or degradation of the ER during treatment can be demonstrated by the absence of visual uptake in lesions. However, for quantification of more subtle changes in 18F-FES uptake as a measure for ER availability and predictor of response to therapy with SERMs/SERDs, caution should be taken because our data show that during therapy the kinetics and biodistribution of the tracer are altered, possibly affecting interpretation.
CONCLUSION
The biodistribution of the 18F-FES tracer is altered in blood and healthy tissues with high ER expression during therapy with rintodestrant. This indicates that rintodestrant alters the kinetics of the tracer, which could affect interpretation and quantification of 18F-FES uptake. Of note, ≥6 d after ending treatment with rintodestrant, the biodistribution returned to baseline values, consistent with recovery of ER availability after washout of the drug.
DISCLOSURE
This study was financially supported by G1 Therapeutics Inc. No other potential conflict of interest relevant to this article was reported.
KEY POINTS
QUESTION: How is the biodistribution of the 18F-FES tracer and is it altered in patients with metastastic ER+ breast cancer undergoing treatment with rintodestrant?
PERTINENT FINDINGS: The biodistribution of the 18F-FES tracer is altered in blood and in healthy tissues with high ER expression during therapy with rintodestrant. This indicates that rintodestrant affects the kinetics of the tracer, possibly affecting interpretation and quantification of 18F-FES uptake.
IMPLICATIONS FOR PATIENT CARE: Changes in ER availability due to therapy that result in partial blockage or degradation of ER can potentially be quantified with 18F-FES uptake. However, caution should be taken when doing so, because our data show that during therapy the kinetics and biodistribution of the tracer are altered, potentially affecting the interpretation.
ACKNOWLEDGMENTS
We thank the patients for participating in this study. We also thank the members of the Department of Oncology and Radiology and Nuclear Medicine of Amsterdam UMC – location VUmc for tracer production and data acquisition.
Footnotes
Published online Aug. 26, 2021.
- © 2022 by the Society of Nuclear Medicine and Molecular Imaging.
REFERENCES
- Received for publication April 26, 2021.
- Revision received August 11, 2021.
In this issue


Jump to section
Related Articles
Cited By...
- No citing articles found.