


Visual Abstract

Abstract
Current methods of staging liver fibrosis have notable limitations. We investigated the utility of PET in staging liver fibrosis by correlating liver uptake of 68Ga-labeled fibroblast activation protein inhibitor (FAPI) with histology in a human-sized swine model. Methods: Five pigs underwent baseline 68Ga-FAPI-46 (68Ga-FAPI) PET/MRI and liver biopsy, followed by liver parenchymal embolization, 8 wk of oral alcohol intake, endpoint 68Ga-FAPI PET/MRI, and necropsy. Regions of interest were drawn on baseline and endpoint PET images, and SUVmean was recorded. At the endpoint, liver sections corresponding to regions of interest were identified and cut out. Fibrosis was histologically evaluated using a modified METAVIR score for swine liver and quantitatively using collagen proportionate area (CPA). Box-and-whisker plots and linear regression were used to correlate SUVmean with METAVIR score and CPA, respectively. Results: Liver 68Ga-FAPI uptake strongly correlated with CPA (r = 0.89, P < 0.001). 68Ga-FAPI uptake was significantly and progressively higher across F2 and F3/F4 fibrosis stages, with a respective median SUVmean of 2.9 (interquartile range [IQR], 2.7–3.8) and 7.6 (IQR, 6.7–10.2) (P < 0.001). There was no significant difference between 68Ga-FAPI uptake of baseline liver and endpoint liver sections staged as F0/F1, with a respective median SUVmean of 1.7 (IQR, 1.3–2.0) and 1.7 (IQR, 1.5–1.8) (P = 0.338). Conclusion: The strong correlation between liver 68Ga-FAPI uptake and the histologic stage of liver fibrosis suggests that 68Ga-FAPI PET can play an impactful role in noninvasive staging of liver fibrosis, pending validation in patients.
Liver fibrosis is the consequence of chronic liver injury of any etiology that affects 1.5 billion people worldwide (1,2). End-stage liver fibrosis (i.e., cirrhosis) is the global leading cause of liver-disease–related deaths and the most important risk factor for developing liver cancer (1). Fibrosis is the only histologic feature that predicts long-term outcomes, and serial assessments of fibrosis are of key prognostic importance in patient outcomes and assessing treatment response (3). Although liver transplant remains the only available cure for decompensated end-stage liver fibrosis, earlier stages of liver injury and fibrosis are treatable and reversible (4,5).
Current methods of assessing liver fibrosis have notable limitations. Laboratory markers are unreliable (6,7), and liver biopsy (the current gold standard) carries morbidity and mortality risks and is prone to undersampling and variability in sampling and interpretation (8–13). MR elastography is the best validated noninvasive tool and estimates liver stiffness as a surrogate for the histologic fibrosis stage (14–18). MR elastography has lower sensitivity for detection of lower stages of fibrosis, can be nondiagnostic because of liver iron overload or operator error, and cannot differentiate fibrosis from concurrent liver inflammation, as both processes increase liver stiffness (18–20). Hence, there remains a clear unmet need for a noninvasive, quantitative, and accurate tool for staging liver fibrosis.
Fibroblast activation protein (FAP) is a cell surface peptidase expressed in disease processes with matrix remodeling, such as by the fibrogenic liver stellate cells (21,22). Radiolabeled FAP inhibitors (FAPIs) have been used with PET to target FAP in vivo as an imaging tool (23,24). Advantages of PET include quantitative evaluation of radiotracer uptake by SUV and relatively operator-independent, simple whole-liver imaging. Hence, the goal of this study was to prospectively investigate the correlation between liver 68Ga-FAPI-46 (68Ga-FAPI) uptake on PET and the gold standard histologic stage of liver fibrosis in a human-sized swine model of alcohol-induced liver fibrosis.
MATERIALS AND METHODS
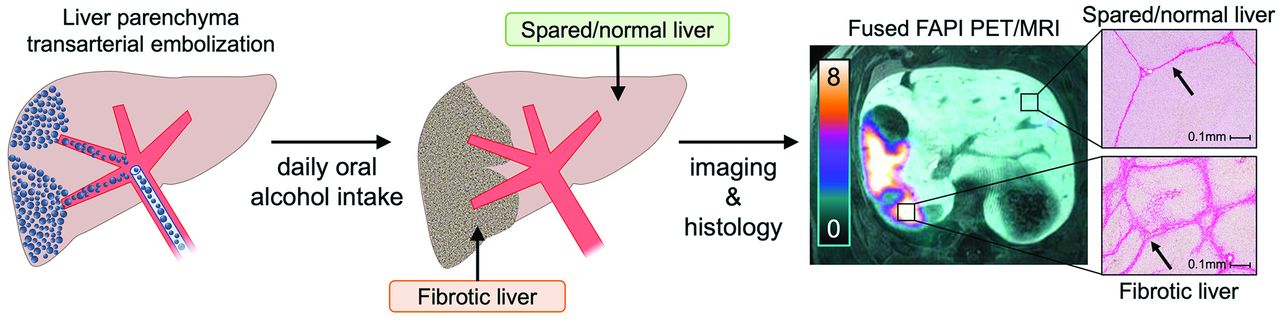
This study was conducted under protocols approved by the local Institutional Animal Care and Use Committee in accordance with published guidelines of the National Institutes of Health and U.S. Department of Agriculture. Figure 1 summarizes the study design. The swine model used in this study has been demonstrated to successfully achieve liver fibrosis (25,26) and is detailed in the supplemental materials (available at http://jnm.snmjournals.org). Five human-sized, age-matched male Wisconsin Miniature Swine™ underwent same-day PET/MRI and core-needle liver biopsy to establish baseline histologic and imaging characteristics of the liver. Increasing volumes of ethanol were then added to their daily diets over a 7-d period, followed by transarterial liver embolization with an emulsion of ethanol and ethiodized oil. The animals continued oral alcohol intake for 8 more weeks, after which they underwent endpoint PET/MRI and necropsy.

Study overview: after baseline PET/MRI, animals underwent period of gradual increase in oral alcohol intake, followed by liver parenchymal transarterial embolization. After 8 wk of oral alcohol intake, they underwent endpoint imaging followed by necropsy and tissue analysis.
Imaging
Images were acquired under general anesthesia in the supine position on a whole-body PET/MRI scanner (Signa PET/MR; GE Healthcare). Continuous dynamic PET data of the liver were acquired for 92 min; 68Ga-FAPI was administered intravenously 1 min after the initiation of data acquisitions. The average dose was 4.3 MBq (range, 3.5–4.6 MBq) per kilogram of body weight. Attenuation-corrected dynamic PET images were reconstructed with 15 s/frame for the first 5 min and 3 min/frame for the rest of the acquisition. An additional static image was generated at 60 min after radiotracer injection (using PET data at 60–69 min). Images were reviewed and analyzed by a dual board-certified nuclear medicine physician/radiologist with fellowship training in abdominal imaging and nuclear medicine, using MIM Encore (R), version 7.1.2 (MIM Software Inc.). Image analysis was performed before histologic tissue assessment to minimize bias.
Baseline Image Analysis
Circular regions of interest (ROIs) were placed on the liver parenchyma on MRI, avoiding major vessels: 1 in the right lobe and 1 in the left lobe, with a minimum diameter of 1.5 cm. Each ROI was propagated across 1 slice cranially and 1 slice caudally, yielding a cylindric ROI with a minimum volume of 4 cm3. To minimize bias, ROIs were propagated directly by the software into both dynamic and static PET images. The SUVmean for each ROI was recorded, yielding 10 data points at baseline (2 per animal).
Endpoint Image Analysis
Because of the heterogeneous nature of the fibrosis achieved by this model (dictated by preferential liver arterial flow carrying different volumes of embolic emulsion to different liver regions), 4 ROIs for each animal were placed on the static PET images. To achieve adequate assessment across the uptake spectrum, 2 of the ROIs were placed on the most avid areas and 2 on relatively less avid areas. Second, ROIs were placed in areas that could be localized on harvested livers using anatomic landmarks (e.g., gallbladder fossa and major vessels). This approach yielded 20 data points at the endpoint (4 per animal).
Tissue Procurement and Histology
Baseline core samples were obtained from each liver lobe. Livers were harvested at the endpoint, and lobar surfaces were marked with ink to preserve the landmarks needed for imaging–histology colocalization. Livers were sectioned using a bread-loafing technique in the axial plane to resemble the slices on PET/MRI, and all slices were fixed in formalin. Using anatomic landmarks, liver areas corresponding to the ROIs on endpoint images were identified, and wedge sections from these regions were cut out.
All tissue samples were processed with Masson trichrome stain, picrosirius red stain, and anti-FAP immunohistochemistry. Histologic review and analysis were performed by a board-certified fellowship-trained hepatobiliary pathologist, unaware of the imaging results and the time points of tissue procurement. Two histologic standards were used as references: METAVIR fibrosis score (27,28) and collagen proportionate area (CPA) (29–35). The METAVIR score is an ordinal 5-point scale (F0–F4); in humans, F0 is absence of fibrosis and F4 is end-stage fibrosis/cirrhosis. Given that normal swine liver has thin, organized bands of fibrosis, for the purposes of this study F0 and F1 were grouped into 1 category (F0/F1) and assigned to normal swine liver (Fig. 2). CPA is the proportion of collagen deposition area relative to the total tissue area (reported in %) on picrosirius red–stained slides. CPA analysis was performed only for endpoint wedge sections and not for baseline tissues, because of the relatively small amount of tissue procured through core needle biopsy at baseline.

Modified METAVIR score to stage swine liver fibrosis: because of presence of thin bands of fibrosis in normal swine liver and absence of this finding in normal human liver, METAVIR score used for staging human liver fibrosis was modified, such that a new stage (F0/F1) corresponds to normal swine liver with expected thin bands of fibrosis. Representative Masson trichrome–stained histologic slides of swine liver demonstrate extent of fibrosis at each stage.
Statistical Analysis
Liver FAPI uptake time–activity curves were generated by plotting the pooled ROI SUVmean against time for different stages of fibrosis. Box-and-whisker plots were generated to compare liver 68Ga-FAPI uptake and CPA across different histologic stages of liver fibrosis, using the Kruskal–Wallis rank sum test. Linear regression was used to correlate liver 68Ga-FAPI uptake with CPA, applying the Pearson correlation coefficient. To account for the correlation among repeated measurements and their nonmonotone change over time, a linear mixed-effects model was used with pig- and ROI-specific random effects and a piecewise linear time trend. Time–activity curves were compared using an F test on longitudinal measurements assuming normally distributed errors. P values of less than 0.05 were considered statistically significant. A post hoc power analysis for testing F2 versus F0/F1, and F3/F4 versus F0/F1, under the current sample size was performed.
RESULTS
All animals completed the study procedures. Baseline PET imaging of animal 2 was terminated at 69 min after injection, when the animal had to be removed from the scanner to reestablish the airway and ensure animal safety. For animal 3, PET data at 37–42 min were discarded because of a shift in the animal’s position inside the scanner during that period, but imaging was completed successfully. Time–activity curves demonstrated incrementally higher delayed 68Ga-FAPI uptake in stage F2 and F3/F4 sections (P < 0.001, Fig. 3). Uptake was stabilized at 60 min, the time point at which the static images were generated for purposes of quantitative analysis and imaging–histology correlation.

Pooled-data time–activity curves demonstrate similar pattern of 68Ga-FAPI uptake by both normal liver at baseline and F0/F1 sections at endpoint. Conversely, there is incremental increase in delayed 68Ga-FAPI uptake by liver sections histologically staged as F2 and as F3/F4 (P < 0.001).
Figure 4 is an example of imaging–histology correlation in the same animal at baseline and at the endpoint; the embolized region of the liver demonstrated fibrosis with avid 68Ga-FAPI uptake. Table 1 summarizes the 68Ga-FAPI uptake and the corresponding METAVIR score and CPA for all liver sections. All baseline liver samples were normal (stage F0/F1). At the endpoint, of the total 20 liver sections, 9 were staged as F0/F1, 3 as F2, 1 as F3, and 7 as F4. Given that only 1 specimen was staged as F3, it was grouped with the F4 specimens (i.e., group F3/F4) to provide for a meaningful quantitative analysis.

Imaging–histology correlation at baseline and endpoint. (A) Baseline axial PET/MR images of animal 5 demonstrate homogeneous liver parenchyma and mild 68Ga-FAPI uptake. (B and C) Core biopsy of left liver lobe (at ×100 magnification) demonstrates expected thin bands of fibrosis (B, arrow), with very faint staining on FAP immunohistochemistry (C, arrow). (D) At endpoint, geographic region in right lobe demonstrates hypoenhancement on MRI and increased 68Ga-FAPI uptake (arrows). (E–H) Liver sections obtained from avid (abnormal) and nonavid (normal/spared) regions (at ×40 magnification) demonstrate expected thin bands of fibrosis in normal/spared region (E, arrow), with minimal staining on FAP immunohistochemistry (F, arrow), and, conversely, thickened bridging bands of fibrosis in abnormal region (G, arrow), with positive staining on FAP immunohistochemistry (H, arrow). IHC = immunohistochemistry.
Summary of Liver 68Ga-FAPI Uptake on PET and Histologic Analysis of Liver Tissue Core Biopsy and Wedge Sections in All Subjects at Baseline and at Endpoint
There was a strong linear correlation between liver 68Ga-FAPI uptake and histologic CPA (r = 0.89, P < 0.001, Fig. 5A). There was no significant difference between the uptake of baseline liver and endpoint liver sections staged as F0/F1, with a respective median SUVmean of 1.7 (interquartile range [IQR], 1.3–2.0) and 1.7 (IQR, 1.5–1.8) (P = 0.338). Conversely, 68Ga-FAPI uptake was significantly higher across the F2 and F3/F4 stages and directly correlated with the histologic fibrosis stage, with a respective median SUVmean of 2.9 (IQR, 2.7–3.8) and 7.6 (IQR, 6.7–10.2) (P < 0.001, Fig. 5B). There was also a significant increase in CPA across fibrosis stages, with a median CPA of 14% (IQR, 13%–16%) for F0/F1, 33% (IQR, 31%–36%) for F2, and 49% (IQR, 47%–61%) for F3/F4 (all P < 0.001, Fig. 5C). The post hoc power of testing F2 versus F0/F1, and F3/F4 versus F0/F1, under the current sample size was calculated as, respectively, 44% and 99.99%.

(A) Linear regression demonstrates strong correlation between liver 68Ga-FAPI uptake and histologic CPA (r = 0.89). (B) Box-and-whisker plot of liver 68Ga-FAPI uptake for METAVIR fibrosis stage groups demonstrates no significant difference between baseline liver uptake and endpoint uptake in liver sections staged as F0/F1 (P = 0.338); however, there is significant and incrementally higher 68Ga-FAPI uptake across F2 and F3/F4 stages, with minimal overlap between different stages (P < 0.001). (C) Box-and-whisker plot of histologic CPA for each METAVIR fibrosis stage group at endpoint, demonstrating significant and incrementally increased CPA with increasing fibrosis stage (P < 0.001). CPA was not performed for baseline tissues because relatively small amount of tissue was procured through core needle biopsy at baseline. *Statistical significance.
DISCUSSION
We demonstrated that liver 68Ga-FAPI uptake strongly correlates with 2 accepted histologic metrics of liver fibrosis across the observed fibrosis stages in a human-sized swine model. Other molecular imaging agents have also been investigated for this purpose. Increased liver uptake of 18F-alfatide in more advanced stages of fibrosis in a mouse model has been reported (36). However, normal liver uptake of 18F-alfatide appears to be substantial enough to render this agent suboptimal for discerning lower stages of fibrosis (36,37). A study of 11C-aminoglycerol PET in a rat model demonstrated an inverse correlation between liver radiotracer uptake and fibrosis stage. Key limitations of this approach include a very short radiotracer half-life and overlap of uptake intensity between fibrosis stages (38). Last, 18F-FDG PET plays only a limited role in evaluation of liver fibrosis, mainly due to altered liver glucose metabolism in the setting of chronic liver disease (39).
68Ga-FAPI PET can offer several key potential advantages for evaluation of liver fibrosis. In our human-sized swine model, 68Ga-FAPI differentiated between various stages of disease. Furthermore, considering minimal uptake in normal human liver (40,41), 68Ga-FAPI may detect early changes of fibrosis, which would be advantageous over elastography. Additional advantages of 68Ga-FAPI PET over elastography would be whole-liver evaluation, minimal opportunity for operator error, and robustness against factors that contribute to or confound liver stiffness measurement, most notably concurrent liver inflammation (16). Although a more novel 3-dimensional MR elastography technique has demonstrated potential to address this limitation (42), this concept has not been validated in clinical practice. However, considering the ability of MRI to accurately assess several key aspects of diffuse liver disease, such as fat, iron, and stiffness (43,44), it is likely that combined 68Ga-FAPI PET and MRI/MR elastography may provide complementary information to paint a more complete picture of the state of liver disease. Potential disadvantages of 68Ga-FAPI PET include radiation exposure and radiotracer availability. However, human dosimetry of 68Ga-FAPI has demonstrated a whole-body exposure that is similar to that of 18F-FDG (41,45). There remain challenges and unknowns that should be addressed as part of further validation of the utility of 68Ga-FAPI PET in assessment of liver fibrosis. Although 68Ga-FAPI uptake directly correlated with the stage of fibrosis in the presented model, this correlation was observed in the setting of active fibrosis in which the animals continued alcohol intake daily. Whether this observation is reproducible in other chronic disease processes, such as in viral hepatitis and nonalcoholic steatohepatitis, is of significant scientific and clinical relevance and requires further validation.
This study had some limitations. Although the sample size was small, a post hoc power analysis demonstrated its adequacy, which was also on a par with a previous report (46). Furthermore, this model generated patchy or geographic areas of fibrotic and normal liver, a pattern that is different from the pattern of disease in humans. However, this feature allowed for an internal negative control. Another limitation of a swine model is the presence of thin fibrotic bands in normal liver, explaining 68Ga-FAPI uptake by normal liver. Hence, the potential of 68Ga-FAPI PET to differentiate between F0 and F1 stages of disease would have to be investigated in human subjects. Our data yielded only 1 specimen with F3 liver fibrosis; hence, we were unable to evaluate the ability of 68Ga-FAPI PET to discern between F3 and F4 stages. Although worth investigating, the significance of this limitation is unknown, as often in clinical practice or in the research setting, F0 and F1 stages as well as F3 and F4 stages are grouped for treatment or prognostic purposes. Last, despite the careful approach to achieve accurate and unbiased imaging–histology correlation through masking and using only anatomic landmarks to obtain tissue samples that correspond to ROIs, sampling error or variability cannot be completely eliminated. This variability and limitation are not unique to this study and are also present in current clinical practice, as well as in nearly all studies that have evaluated liver fibrosis. We anticipate that once 68Ga-FAPI PET for assessment of liver fibrosis is further investigated and potentially validated in humans, it will largely overcome the aforementioned limitations of the current techniques and enhance our ability to understand disease progression and evolution among those with chronic liver disease.
CONCLUSION
The strong correlation between liver 68Ga-FAPI uptake and the histologic stage of liver fibrosis suggests that 68Ga-FAPI PET can play an impactful role in noninvasive staging of liver fibrosis, pending validation in patients. This technique can be used not only in the clinical setting but also for clinical trials (e.g., drug development) or for validation of other novel techniques for assessment of diffuse liver disease.
DISCLOSURE
This work was supported in part by the Biomedical and Genomic Research Group Discretionary Fund (University of Wisconsin–Madison). Sarvesh Periyasamy is supported by the National Cancer Institute (F30CA250408) and the National Institute of General Medical Sciences (T32GM140935). Ali Pirasteh is supported by GE Healthcare (departmental research support), TheraCea, and Sanofi Genzyme (consultant). Sarvesh Periyasamy is supported by Johnson & Johnson, HEPTA Medical, and Vector Surgical (consultant). Kyle Schachtschneider is supported by Guerbet, Janssen Research & Development, NeoTherma Oncology, TriSalus Life Sciences (research support), and Sus Clinicals, Inc. (consultant). Lawrence Schook is supported by Guerbet, Janssen Research & Development, NeoTherma Oncology, TriSalus Life Sciences (research support), and Sus Clinicals, Inc (chief scientific officer). Ron Gaba is supported by Guerbet, Janssen Research & Development, NeoTherma Oncology, TriSalus Life Sciences (research support), and Sus Clinicals, Inc (consultant). Adnan Said is supported by Intercept Pharmaceuticals and Exact Sciences (research support). Paul Laeseke is supported by Johnson & Johnson/Ethicon/NeuWave (consultant), HistoSonics (consultant, shareholder, and research agreement), Elucent (consultant and shareholder), Siemens (research agreement), and McGinley Orthopedic Innovations (shareholder). Dhanansayan Shanmuganayagam is supported by Wisconsin Miniature Swine (Coinventor). No other potential conflict of interest relevant to this article was reported.
KEY POINTS
QUESTION: Is there potential for 68Ga-FAPI PET in staging liver fibrosis?
PERTINENT FINDINGS: This animal study demonstrated a direct correlation between quantitative liver 68Ga-FAPI uptake on PET and both histologic measures of liver fibrosis, that is, the ordinal METAVIR score and the quantitative CPA.
IMPLICATIONS FOR PATIENT CARE: Pending further validation in patients, 68Ga-FAPI PET is a promising tool for noninvasive liver fibrosis staging.
Footnotes
Published online Apr. 21, 2022.
- © 2022 by the Society of Nuclear Medicine and Molecular Imaging.
REFERENCES
- Received for publication December 23, 2021.
- Revision received April 7, 2022.


