


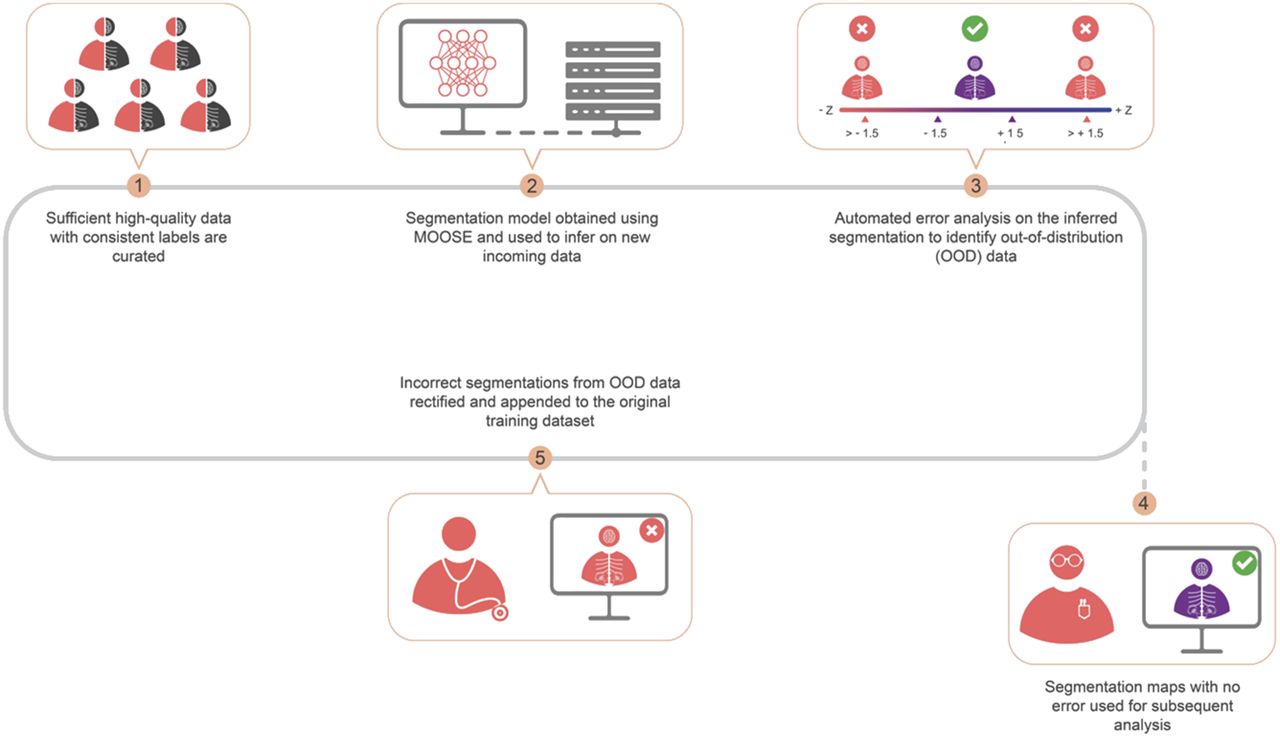
Visual Abstract
Abstract
We introduce multiple-organ objective segmentation (MOOSE) software that generates subject-specific, multiorgan segmentation using data-centric artificial intelligence principles to facilitate high-throughput systemic investigations of the human body via whole-body PET imaging. Methods: Image data from 2 PET/CT systems were used in training MOOSE. For noncerebral structures, 50 whole-body CT images were used, 30 of which were acquired from healthy controls (14 men and 16 women), and 20 datasets were acquired from oncology patients (14 men and 6 women). Noncerebral tissues consisted of 13 abdominal organs, 20 bone segments, subcutaneous fat, visceral fat, psoas muscle, and skeletal muscle. An expert panel manually segmented all noncerebral structures except for subcutaneous fat, visceral fat, and skeletal muscle, which were semiautomatically segmented using thresholding. A majority-voting algorithm was used to generate a reference-standard segmentation. From the 50 CT datasets, 40 were used for training and 10 for testing. For cerebral structures, 34 18F-FDG PET/MRI brain image volumes were used from 10 healthy controls (5 men and 5 women imaged twice) and 14 nonlesional epilepsy patients (7 men and 7 women). Only 18F-FDG PET images were considered for training: 24 and 10 of 34 volumes were used for training and testing, respectively. The Dice score coefficient (DSC) was used as the primary metric, and the average symmetric surface distance as a secondary metric, to evaluate the automated segmentation performance. Results: An excellent overlap between the reference labels and MOOSE-derived organ segmentations was observed: 92% of noncerebral tissues showed DSCs of more than 0.90, whereas a few organs exhibited lower DSCs (e.g., adrenal glands [0.72], pancreas [0.85], and bladder [0.86]). The median DSCs of brain subregions derived from PET images were lower. Only 29% of the brain segments had a median DSC of more than 0.90, whereas segmentation of 60% of regions yielded a median DSC of 0.80–0.89. The results of the average symmetric surface distance analysis demonstrated that the average distance between the reference standard and the automatically segmented tissue surfaces (organs, bones, and brain regions) lies within the size of image voxels (2 mm). Conclusion: The proposed segmentation pipeline allows automatic segmentation of 120 unique tissues from whole-body 18F-FDG PET/CT images with high accuracy.
- multiorgan segmentation
- total-body PET
- systems medicine
- artificial neural networks
- automated segmentation
Living organisms maintain steady internal physiologic conditions through dynamic, self-regulating multiorgan systemic interactions (1), also known as homeostasis. In healthy subjects, any notable deviation from homeostasis is avoided with the aid of systemic feedback loops (2). Chronic pathologies are conceived as sustained disturbances in homeostasis for which systemic communications cannot compensate (3). Molecular imaging modalities, such as PET, can provide essential insights into diverse biologic processes within the human body by using highly specific radiotracers that track molecular function in vivo (4). Assuming that homeostasis is associated with a balanced, albeit variable, glycolytic pattern, PET can help characterize bespoke feedback loops and deviations that lead to pathologies. However, until recently, whole-body PET imaging protocols were typically limited to only a portion of the patient’s body (e.g., neck to upper thigh) because of the relatively narrow axial field of view (15–25 cm) of PET systems. This limitation required multiple bed positions to be acquired sequentially to cover the axial field of investigation. Nonetheless, this acquisition mode failed to fully harness the multisystemic physiologic information provided by PET imaging (5).
With the recent advent of PET/CT systems with a large axial field of view (>70 cm) (6–8), the opportunity arose to acquire total-body PET images with only 1–2 bed positions, facilitating multiorgan system analysis. Such systemic analysis might allow the investigation of multiorgan interactions in various pathologies, such as those associated with cancer (9), cachexia (10,11), metabolic syndrome (12), or the more recent severe acute respiratory syndrome coronavirus 2 (13). However, the amount of data generated by this new generation of PET/CT systems is too large to be adequately analyzed without automated processing pipelines.
In response, we developed a multiple-organ objective segmentation (MOOSE) tool, an open-source software framework based on data-centric artificial intelligence (AI) principles (14) (Supplemental Fig. 1; supplemental materials are available at http://jnm.snmjournals.org) to allow fully automated generation of a subject-specific total-body 18F-FDG PET/CT tissue map consisting of over 100 different tissue types. We named our software pipeline MOOSE120. MOOSE120 is free, open-source software. All codes related to MOOSE120 are available online, and all models for our application are publicly available. A complete description of the processing pipeline is available on our GitHub page (https://github.com/QIMP-Team/MOOSE). The development of such a software tool dramatically increases the amount of information that can be efficiently extracted from PET data. Further, such a tool provides a means to observe normal physiology and pathologic conditions globally, permitting systems-level investigations into human physiology. For example, when applied in a clinical setting, this approach will allow physicians to automatically generate a list of SUVs for all organs of interest, which might provide auxiliary information during the diagnostic process. In addition, the automated generation of a complete set of organ-specific SUVs lends itself well to AI-supported diagnostic screening, allowing organ SUV ratios to be compared across subjects and alerting the physician about potential secondary pathologies.
MATERIALS AND METHODS
All the data in this study were acquired in accordance with the Declaration of Helsinki. Written informed consent was obtained from all subjects before the examinations. Table 1 details the institutional review boards and approval numbers for the various datasets.
Institutional Review Boards and Approval Numbers for Various Datasets
Overall Segmentation Strategy
Our approach is based on the latest state-of-the-art nnU-Net segmentation framework (15). More importantly, we propose a data-centric approach (14,16) in which the network model is fixed and the data are iteratively augmented to increase the performance of the AI system. As such, the model’s performance is continuously monitored. As new data deviating from the training dataset’s characteristics enter the processing stream, the model is retrained to enhance performance.
Data
Two different types of datasets were used for the development of a software tool able to segment both cerebral (83 regions) and noncerebral (37 tissues) structures.
For training and evaluation of noncerebral structures, 50 whole-body low-dose CT datasets were used. Among these 50 datasets, 30 CT images were acquired from healthy volunteers (14 men and 16 women; mean age ± SD, 47 ± 13 y) using the uEXPLORER (United Imaging Healthcare) total-body PET/CT system (17). The remaining 20 datasets belonged to a retrospective patient cohort from a TruePoint TrueView (Siemens Healthineers) PET/CT system (14 men and 6 women; mean age, 67 ± 12 y). The noncerebral tissue atlas consists of 13 abdominal organs, 20 bone segments, subcutaneous fat, visceral fat, psoas muscle, and skeletal muscle (Supplemental Table 1; Supplemental Fig. 2).
An expert segmentation panel comprising 4 physicians and 4 medical students (final year) was responsible for the manual segmentation of all noncerebral structures, except for subcutaneous and visceral fat and skeletal muscle, which were outlined using an established thresholding method (18). The physicians were responsible for segmenting the abdominal organs and psoas muscle, whereas the students generated the bone segments. From the 50 datasets, 40 were used for training, and 10 were used for testing (hold-out dataset).
For training and evaluation of cerebral structures, we used 34 18F-FDG PET/MRI brain datasets (10 test–retest healthy controls [5 men and 5 women; mean age, 27 ± 7 y] and 14 nonlesional epilepsy patients [7 men and 7 women; mean age, 29 ± 9 y]) (19,20). The cerebral atlas consisted of 83 brain subregions (Supplemental Table 1) automatically created from PET data in combination with T1-weighted MR images and the Hammersmith atlas (21). In short, subject-specific T1-weighted MR images were normalized to Montreal Neurological Institute space using SPM 12 (22). The obtained (inverse) transform was then used to spatially transform brain regions of the Hammersmith atlas into the individual subject’s native space, yielding 83 subject-specific cerebral subregions, which were transferred to coregistered PET image volumes. Of the 34 datasets, 24 and 10 were used for training and testing, respectively.
Reference Standard Generation
To address intervariability issues in organ segmentation, the simultaneous truth and performance level estimation (STAPLE) algorithm (23) was used to generate reference volumes for further performance assessment. Each reference volume represents a probabilistic estimate of the true segmentation as well as a measure of multioperator segmentation performance (STAPLE variance). The STAPLE method was not used for reference segmentations derived using automatic (brain atlas) or semiautomatic (thresholding) methods.
U-Net–Based Semantic Segmentation
The nnU-Net implementation of the generic U-Net architecture is a self-configuring method for deep learning–based biomedical image segmentation. This implementation exhibits strong performance by retaining the original U-Netlike architecture while automating the complex process of manual hyperparameter configuration (15).
In our implementation, the nnU-Net was trained separately for the following 4 structure classes: 13 abdominal organs and psoas muscle, 20 bone structures, 83 brain regions, and fat (subcutaneous and visceral) and skeletal muscle. Noncerebral tissues were segmented using CT data, whereas cerebral regions were segmented using 18F-FDG PET images.
Assessment of Deviation from Training Dataset Distribution
It is unlikely that any training dataset will be sufficient to fully capture the variability encountered in clinical routine. Accordingly, a data-centric approach is necessary, permitting continuous monitoring of segmentation performance so that data that substantially deviate from the original training data distribution (i.e., out-of-distribution [OOD] data) are detected. Erroneous segmentation results obtained for such data will then require manual correction by a human expert. Once corrected, these data can be appended in suitable quantities to the initial training dataset for retraining purposes.
Since continuous operator-based monitoring of segmentation performance is untenable in clinical routine, we developed an automated error analysis routine that detects OOD datasets on the basis of morphometric analysis of organ shapes (e.g., elongation, volume, area, and maximum and minimum bounding box diameter), which were determined for each STAPLE-derived segmentation of structures, and a normative morphologic feature database was generated. On segmentation of a new dataset, morphologic features for each segmented structure were calculated and compared with the normative morphology database, yielding a distance (z score) in similarity space for each structure. The z score reflects the difference between the shapes of the segmented structure in comparison to its normative value obtained from the training datasets. In our implementation, we chose a z score of 1.5 as the cutoff for OOD labeling.
Algorithm Performance Versus Training Sample Size
A primary performance assessment of the MOOSE automated segmentation was performed for all structures using the Dice score coefficient (DSC) (24). A DSC of 1.0 with respect to STAPLE indicates perfect overlap, and 0 indicates no overlap. In addition, the average symmetric surface distance (ASSD) (25) was used as a secondary metric, representing the average distance (in mm) between surface voxels of the standard and the automated segmentation.
To assess the segmentation performance as a function of training sample size, we calculated for each noncerebral structure the DSC and the ASSD using the segmented volumes derived using 10 (D10), 20 (D20), and 40 (D40) training datasets, respectively. A similar analysis was performed for cerebral regions with 8, 16, and 24 datasets. In both instances, cases were randomly selected from the whole datasets (50 cases for noncerebral structures and 34 cases for cerebral structures). The testing (hold-out) dataset included 10 cases that were not part of the training sets in both instances.
Algorithm Performance Versus Training Dataset Variability
To investigate the effect of training dataset variability on segmentation performance, we performed a series of training and test runs using various mixtures of 2 datasets that differed significantly with respect to arm position (either arms down or arms crossed on chest, Supplemental Fig. 3). We created 4 subsets of training datasets, each with a total sample size of 20. The first dataset consisted of 20 low-dose CT images with arms down (SMS20). The other 3 training datasets included mixtures of images: MIX2-18 (18 arms down, 2 crossed), MIX5-15 (15 arms down, 5 crossed), and MIX10-10 (10 arms down, 10 crossed). Networks trained on these 4 training datasets were then used to segment 10 test datasets that included only images with crossed arm positions (X10). The following 4 (training test) scenarios were investigated: SMS20→X10, MIX2-18→X10, MIX5-15→X10, and MIX10-10→X10. Segmentation results were assessed separately for bone structures of the arm (radius, ulna, carpal, metacarpal, and fingers) and for all other bone structures (that did not differ positionally). This analysis provided information on the necessary variability in the training dataset required to segment OOD data accurately.
Algorithm Performance for Clinical OOD Datasets
We applied the trained network to 2 small pathologic cohorts that were not part of the initial training set: 3 lymphoma cases and 3 mesothelioma lung cancer cases. The intent was to assess the performance of MOOSE on clinical datasets that differ significantly from the training data distribution. Evaluation of the segmentation quality was based on similarity space analysis (z scores). OOD datasets with incorrect segmentations were manually corrected, and the corrected segmentations were then appended to the original training datasets for retraining purposes.
Statistical Assessment
A paired t test was applied to determine whether DSCs differed significantly between the various training sample sizes and to investigate the effect of training dataset variability (either fully OOD or mixed) on DSCs. In addition, a correlation analysis (Pearson ρ) was performed to investigate the relationship between STAPLE variance and the DSCs associated with the best (D40) training sample size. A similar analysis was also performed using the ASSD metric.
Software Tool Implementation
Our processing pipeline is based on the Python and C++ programming languages, with the nnU-Net framework representing the segmentation backbone, built using PyTorch, version 1.6.031 (26). Similarity space was implemented using the morphometric capabilities of SimpleITK, version 2.1.0 (27), and erroneous segmentation results were cleaned manually using 3D Slicer, version 4.11.20210226 (28).
RESULTS
Effect of Training Data Size on Segmentation Performance
Most noncerebral tissues (81%) were segmented with high accuracy (DSC > 0.90), as seen from Figure 1. DSC analysis generally showed an excellent overlap between STAPLE-derived reference and organ segmentations based on D10, D20, and D40. This excellent overlap was confirmed through ASSD analysis, yielding average distances of 1.40 ± 1.29, 1.05 ± 1.26, and 0.68 ± 0.52 mm for D10, D20, and D40, respectively. However, the performance of the automated segmentation was suboptimal for a small group of organs (Fig. 1), with low median DSCs and high SDs (Supplemental Fig. 4A), such as the adrenal glands (DSC, 0.72), pancreas (DSC, 0.85), and bladder (DSC, 0.86). Subsequent correlation analysis of the STAPLE variance and the DSCs derived from the D40 training set is shown in Supplemental Figure 4B. The graph indicates an overall highly significant negative correlation (ρ = −0.79, P = 0.002), with the 3 identified regions showing high STAPLE variance. This significant correlation with the STAPLE variance was also reproduced using the ASSD metric (ρ = 0.60, P = 0.042; Supplemental Fig. 5), indicating that accurate segmentation of this subset of regions is challenging even for human experts.

Median DSCs of abdominal organs (10 test datasets) were obtained from models based on 3 separate training subsets: D40 (circle), D20 (square), and D10 (triangle). Inverted triangle (pink) indicates 0.90 mark. Red background highlights organs characterized by low median DSCs (<0.90) and high SDs (Supplemental Fig. 4).
The segmentation performance for bone structures was similar to that for the abdominal organs (Fig. 2). Again, one notes an excellent overlap between the reference structure volumes and those obtained using the automated segmentation based on D10, D20, and D40 (ASSDs of 1.63 ± 3.01, 1.61 ± 3.14, and 0.83 ± 0.76 mm, respectively), except for a small number of bone structures with either low mean DSCs or high SDs (Supplemental Fig. 6). These structures were the carpal bones, metacarpal bones, and phalanges of the toes. Removal of these organs resulted in a similar segmentation performance between D20 and D40 (P = 0.07), with segmentation based on D10 remaining significantly worse than D20 (P = 0.016) and D40 (P = 0.010).

Median DSCs of bone structures (10 test datasets) as obtained from models based on 3 separate training subsets: D40 (circle), D20 (square), and D10 (triangle). Inverted triangle indicates 0.90 mark. Red background highlights bones characterized by low median DSCs (<0.90).
Although the median DSCs of brain subregions derived from PET images were relatively low (only 29% of brain segments had median DSCs > 0.90; Supplemental Fig. 7), ASSDs showed subvoxel differences between the template regions and the automated segmentation, with similar performance across the D10 (0.52 ± 0.35 mm), D20 (0.53 ± 0.41 mm), and D40 (0.46 ± 0.27 mm) datasets.
Effect of Training Dataset Variability on Segmentation Performance
The results of dataset variability analysis are shown in Figure 3. The figure indicates that segmentation of structures that substantially deviate from the expected position in the training datasets was suboptimal. However, by including at least 2 cases that match the deviant position to the training dataset, performance improved significantly. Specifically, DSCs for bones of the arm were significantly lower for the fully OOD scenario (SMS20→X10) (DSC, 0.87 ± 0.12) than for the 3 scenarios that included 10% (MIX2-18→X10) (DSC, 0.92 ± 0.06; P = 0.04), 25% (MIX5-15→X10) (DSC, 0.940 + 0.003; P = 0.01), and 50% (MIX10-10→X10) (DSC, 0.91 + 0.04; P = 0.04) of cases that matched the deviant position. In addition, the coefficient of variation for DSCs derived from the 3 mixed training datasets was significantly lower (6.6% [P = 0.01], 3.3% [P = 0.03], and 4.3% [P = 0.01]) than that for DSCs derived from the fully OOD training dataset (13.5%). In comparison, the performance of all 4 scenarios for bone structures that were matched in position between the training and test datasets was similar, with DSCs of more than 0.95 (Fig. 3).

(A) Bar graph demonstrating similar performance of different models for bone segmentation other than forearm bones. Green bar depicts homogeneous training dataset (SMS-20), whereas mixed training datasets (MIX2-18, MIX5-15, and MIX10-10) are represented by red bars. (B) Bar graph showing segmentation performance of forearm bones. Significant performance improvement is seen in mixed training datasets (red bars) compared with homogeneous training dataset (green bar). (C) Forearm bone analysis of individual subject. Images demonstrate that forearm bones are incorrectly segmented in case of SMS20 (green background) model, whereas all mixed models accurately segmented forearm bones (red background).
Detection of OOD Segmentation Errors
Application of similarity space analysis identified segmentation errors in clinical datasets that included various anatomic pathologies, representing OOD datasets for specific organs. This was clearly demonstrated by applying the initially trained neural network to 2 distinct OOD datasets (lymphoma and mesothelioma) that were not part of the initial training set. Specifically, all lymphoma patients presented with splenomegaly, which led to its incorrect classification as a liver and spleen (Fig. 4A). After manual correction (time required, ∼3 min per case), we appended 2 corrected datasets to the original training set to retrain the neural network. The retrained neural network correctly segmented the abnormally enlarged spleen in the third lymphoma patient, which was used as a hold-out dataset (Fig. 5).

(A) Error analysis in similarity space for representative lymphoma patient. Horizontal bars depict distance in similarity space, with blue bars characterizing organs with z score of <1.5. Figure shows z scores of >1.5 for liver, kidneys, and bladder (red bars). Corresponding organ segmentations are displayed to right for liver (z = 1.9) and heart (z = 9.9), indicating suboptimal segmentation results that require manual correction. (B) Error analysis in similarity space for representative mesothelioma patient with z scores of >1.5 for liver, heart, bladder, and lung. Incorrect organ segmentations are shown to right for liver (z = 2.8) and heart (z = 8.4). VCI = vena cava inferior.

(A) Organ segmentation of hold-out lymphoma test dataset using training dataset that did not include splenomegaly cases. (B) Organ segmentation of same patient after inclusion of 2 (different) lymphoma datasets and model retraining using expanded training dataset. Updated model was able to recognize new image pattern, resulting in correct segmentation of both liver and spleen.
Similarly, the large tumor mass in the lungs of mesothelioma patients was incorrectly classified as part of the liver, heart, and bladder (Fig. 4B). Again, similarity space analysis identified the incorrect segmentation and labeled the dataset as representing an OOD image pattern (Fig. 6A). After manual correction of 2 of 3 patients, these 2 cases were again appended to the training dataset, and the neural network was retrained using the extended training set. Once again, we determined an improvement in the segmentation performance of the third (uncorrected) dataset (Fig. 6).

(A) Organ segmentation of hold-out mesothelioma test dataset using training dataset that did not include mesothelioma cases. (B) Organ segmentation of same patient after inclusion of 2 (different) mesothelioma datasets and model retraining using expanded training dataset. Updated model recognized new image pattern, resulting in correct segmentation of heart.
DISCUSSION
Hybrid molecular imaging modalities such as 18F-FDG PET/CT allow the investigation of multiorgan systemic interactions through which living organisms maintain homeostasis and allostasis. The resulting images are not mere pictures—they represent a rich pallet of multidimensional data (29). By systemically parcellating these datasets into respective organ and tissue classes, one can, in theory, study system-level interactions in detail between the various homeostatic and allostatic networks, allowing a better understanding of pathologic abnormalities in vivo. Nevertheless, manual segmentation of various tissues in the human body is not tenable, either in research applications or in clinical routine.
To bridge this gap, we developed a fully automated segmentation pipeline, MOOSE, that allows the creation of subject-specific multitissue 18F-FDG PET/CT atlases (Supplemental Fig. 2). These tissue maps enable the extraction of subject-specific functional information from molecular imaging data with minimal additional effort for further analysis. We based the segmentation pipeline on the latest state-of-the-art nnU-Net architecture (15) and demonstrated that robust training of the convolutional neural network could be achieved with as few as 20 datasets, provided that sufficient variability in the training dataset is present. In addition, our results support the concept of data-centric AI, which focuses primarily on data quality rather than quantity.
In general, MOOSE performed reasonably well in segmenting most of the noncerebral tissues while exhibiting poorer segmentation performance on selected organs such as thyroid, adrenal gland, and bladder. Our correlation analysis revealed a significant negative correlation between the STAPLE variance and the DSCs derived from the D40 training set (Supplemental Fig. 4B). This result suggests that, because of a combination of small organ size, low contrast, and increased noise levels present in low-dose CT images, accurate segmentation of bespoke structures is challenging even for human experts.
AI, PET Imaging, and Systems Biology
The ultimate objective of the developed multiorgan and tissue segmentation methodology is to promote the concept of whole-person research (30) and systems biomedicine (31) through whole-body 18F-FDG PET/CT imaging. With the advent of PET/CT systems that have a large axial field of view, most or all organs can be simultaneously imaged, therefore allowing an improved evaluation of interactions between organs in both healthy and diseased states. We envision that through automated extraction of rich physiologic information inherent in PET/CT data (e.g., organ SUVs), disease-specific metabolic fingerprints can be derived that uniquely characterize diverse pathologies affecting system-level organ interaction (Supplemental Fig. 8). Such an analysis might uncover metabolic dependencies among sets of organs and provide novel insights into metabolic pathway dysregulation associated with disease progression. Moreover, given the fact that noncerebral tissues are segmented directly from CT data, this technique is insensitive to variations in PET tracer uptake patterns, thus allowing the study of diverse system-level functional processes using a multitude of function-specific radiotracers.
Training of Neural Networks Using Sparse Datasets
It is commonly assumed that the performance of a neural network increases with the size of the training set. Therefore, most non–health-care image classification applications are trained on vast numbers of training cases (e.g., ImageNet (32)). However, creating large training datasets in the medical field is problematic, as manual curation of medical images is highly time-consuming and heavily dependent on domain-specific human expert knowledge. In this study, 50 medical image datasets were manually segmented (into 120 objects for each dataset) by medical professionals. This process required significant personal effort by each expert and took several months to complete. Such an effort cannot be expected to be repeated numerous times when additional silos of data (possibly with a different distribution) become available.
In recognition of this methodologic constraint, we investigated the effect of both training sample size and training sample variability on segmentation performance. Our results demonstrate that segmentation performance is dependent primarily on whether the training dataset allows the correct identification of several unique image patterns, each characterized by a mean spatial pattern and the associated variance (Figs. 4⇑–6). This insight also explains why more cases are usually preferred, as it is likely that a greater number of unique image patterns can be captured using a larger dataset. However, the number of images needed per unique pattern is not evident. Our results suggest that accurate segmentation of abnormal image patterns is viable, provided that the training data include a small number (2–4) of cases that establish a distinct image pattern with the associated morphologic variance.
A Data-Centric Approach to Segmentation
Over the long run, any clinically viable medical image segmentation method will require a system in which incoming data are constantly used to adjust model parameters to accommodate changing data distributions. To meet this requirement, the implemented data-centric approach executes 2 operations: first, it actively monitors segmentation performance followed by the users’ input to correct the erroneous segmentation, and second, it periodically updates model parameters through retraining of the neural network using an updated training set (which includes the manually corrected OOD data).
In particular, segmentation performance is continuously monitored in similarity space, and feedback on segmentation accuracy is provided to the physician in the form of tissue-specific z scores that signal potential deviations from tissue shape and position in the normative training data distribution. On the basis of this analysis, all tissues that are judged to be OOD (z > 1.5) are flagged, and the physician is prompted for corrective action. This approach ensures adequate segmentation of all tissues present in abnormal datasets and provides important curated data for future retraining of the neural network. Moreover, this strategy addresses potential segmentation problems right when they occur in the processing pipeline, when corrective actions can be performed most efficiently and with the least effort.
The presented segmentation framework bears its challenges. First, this methodology mandates a high-performance workstation, which might be cost-prohibitive. Our network training was performed on a dedicated server (Intel Xeon Silver 4216 central processing unit running at 2.10 GHz, 32 central processing unit cores, 256 GB of random-access memory, and a single Nvidia GeForce graphics processing unit), allowing the generation of a single total-body 18FDG PET/CT tissue-map from an individual whole-body PET/CT dataset in about 30 min. Moreover, once OOD datasets are collected, the neural network needs to be retrained, which took approximately 2 d to complete using the above server configuration. Finally, there is some unavoidable subjectivity in identifying OOD datasets, as the cutoff defining OOD data is based on heuristics.
CONCLUSION
We present here a fully automated, data-centric segmentation pipeline for the creation of a total-body 18F-FDG PET/CT tissue map. The generated map is modular and consists of 120 tissues and bone structures, enabling the automated extraction of image information for both cerebral and noncerebral regions, potentially providing added information about secondary abnormalities during the diagnostic process.
DISCLOSURE
This work was supported in part by National Institutes of Health research grant R01CA29422 and the IBM University Cloud Award. No other potential conflict of interest relevant to this article was reported.
KEY POINTS
QUESTION: How can we efficiently extract diagnostic information from whole-body 18F-FDG PET/CT data?
PERTINENT FINDINGS: Our automated approach to multiorgan segmentation of whole-body 18F-FDG PET data builds on the nnU-Net methodology driven by data-centric principles and supports accurate segmentation of 37 extracerebral and 83 cerebral regions. Over 92% of the noncerebral tissues were segmented with a DSC of more than 0.90, whereas 89% of the cerebral areas had a DSC of more than 0.80.
IMPLICATIONS FOR PATIENT CARE: The developed software tool increases the amount of information extracted from standard, whole-body PET/CT datasets and provides a means to perform system-level investigations into human physiology.
ACKNOWLEDGMENTS
We thank Jakub Gawrylkowicz and Sebastian Gutschmayer for their support in packaging the software, Clemens Spielvogel for helpful discussions throughout the project, Kilian Kluge for organizing the mesothelioma datasets, and Irene Buvat for providing the lymphoma datasets to verify our hypothesis.
Footnotes
Published online Jun. 30, 2022.
- © 2022 by the Society of Nuclear Medicine and Molecular Imaging.
REFERENCES
- Received for publication February 24, 2022.
- Revision received May 16, 2022.
In this issue


Jump to section
Related Articles
Cited By...
- Quantitative Total-Body Imaging of Blood Flow with High-Temporal-Resolution Early Dynamic 18F-FDG PET Kinetic Modeling
- Quantitative Total-Body Imaging of Blood Flow with High Temporal Resolution Early Dynamic 18F-Fluorodeoxyglucose PET Kinetic Modeling
- Is Automatic Tumor Segmentation on Whole-Body 18F-FDG PET Images a Clinical Reality?
- Deep Semisupervised Transfer Learning for Fully Automated Whole-Body Tumor Quantification and Prognosis of Cancer on PET/CT
- SEGMENTATION OF DYNAMIC TOTAL-BODY [18F]-FDG PET IMAGES USING UNSUPERVISED CLUSTERING
- Antihormonal-Treatment Status Affects 68Ga-PSMA-HBED-CC PET Biodistribution in Patients with Prostate Cancer
- Facial Anonymization and Privacy Concerns in Total-Body PET/CT
- Facial Anonymization and Privacy Concerns in Total-Body PET/CT
- Whole-Body PET Imaging: A Catalyst for Whole-Person Research?