


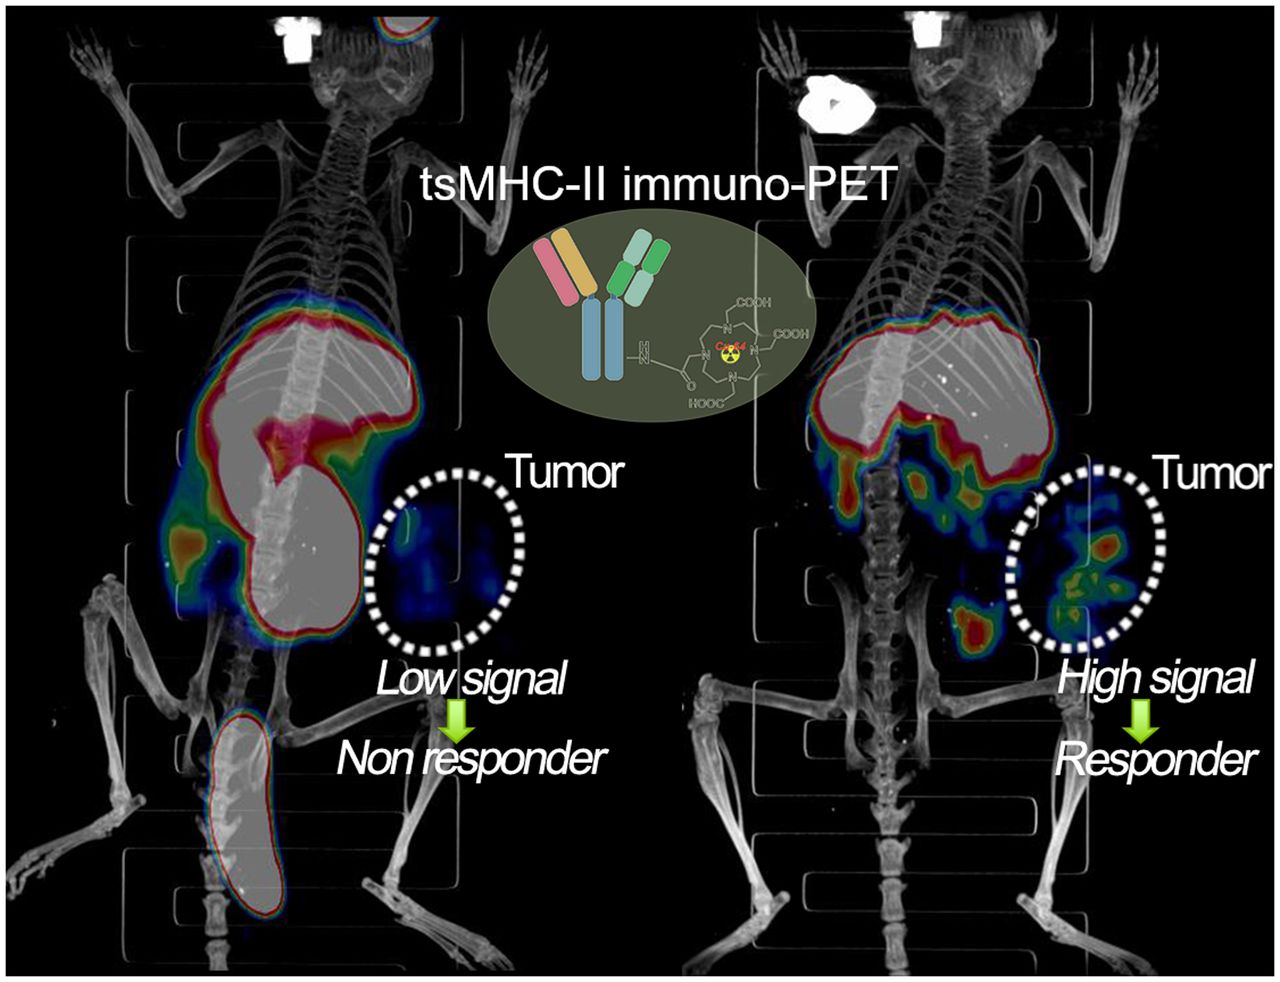
Visual Abstract
Abstract
Despite the advance of immunotherapy, only a small subset of patients gains long-term survival benefit. This fact represents a compelling rationale to develop immuno-PET imaging that can predict tumor response to immunotherapy. An increasing number of studies have shown that tumor-specific major histocompatibility complex II (tsMHC-II) is associated with improved responses to targeted immunotherapy. The aim of this study was to investigate the potential of tsMHC-II protein expression and its dynamic change on treatment with interferon γ (IFNγ) as a new target for immuno-PET to predict response to immunotherapy. Methods: Major histocompatibility complex II (MHC-II) antibody was radiolabeled with DOTA-chelated 64Cu to derive an MHC-II immuno-PET tracer. Two melanoma models (B16SIY, B16F10) that are respondent and nonrespondent, respectively, to PD1/PD-L1 checkpoint inhibitor were used. Both tumor models were treated with anti-PD1 and IFNγ, enabling observation of dynamic changes in tsMHC-II. Small-animal PET imaging, biodistribution, and histologic studies were performed to validate the correlation of tsMHC-II with the tumor response to the immunotherapy. Results: Fluorescence-activated cell sorting analysis of the 2 tumors supported the consensual recognition of tsMHC-II correlated with the tumor response to the immunotherapy. The in vivo PET imaging revealed higher basal levels of tsMHC-II in the responder, B16SIY, than in the nonresponder, B16F10. When treated with anti-PD1 antibody in animals, B16SIY tumors displayed a sensitive increase in tsMHC-II compared with B16F10 tumors. In IFNγ stimulation groups, the greater magnitude of tsMHC-II was further amplified when the IFNγ signaling was activated in the B16SIY tumors, as IFNγ signaling positively upregulates tsMHC-II in the tumor immunity. Subsequent histopathologic analysis supported the correlative characteristics of tsMHC-II with tumor immunity and response to cancer immunotherapy. Conclusion: Collectively, the predictive value of tsMHC-II immuno-PET was validated for stratifying tumor immunotherapy responders versus nonresponders. Monitoring sensitivity of tsMHC-II to IFNγ stimulation may provide an effective strategy to predict the tumor response to immunotherapy.
The discovery of immune checkpoint molecules used by cancer cells to evade the patient’s immune system has spurred development of immune checkpoint inhibitors (ICIs) to disrupt inhibitory ligand–receptor interactions (1). The primary ICI molecules, cytotoxic T-lymphocyte antigen 4, programmed cell death 1 (PD1), and programmed cell death ligand 1 (PD-L1), facilitate a blockade strategy that unleashes antitumor T cells to recognize and eradicate tumor cells across multiple types of cancer. ICI-modulated immunotherapy, which is now Food and Drug Administration–approved for the treatment of a broad range of tumor types, has revolutionized the cancer treatment landscape. Unfortunately, only a small subset of patients gains long-term survival benefit from the ICI therapy, whereas a sizable number of patients do not experience a durable clinical response (2,3). The variable success of ICI-modulated therapy provides a compelling rationale for the development of predictive tools to identify ICI-responder versus ICI-nonresponder patients to optimize resource use, improve clinical outcomes, and avoid unnecessary toxicity.
A predictive biomarker for ICI therapy is PD-L1 expression; current clinical practice relies on excisional biopsies to sample patient tumors and test for PD-L1 (4). Since the assay requires invasive sampling of tumor tissue and is compromised by sampling errors and tumor heterogeneity, it is not ideal. In addition, immune checkpoint molecule expression is dynamic and can be upregulated by host immune response and inflammatory cytokines. Given the recently emerged reports that patients without PD-L1 expression also respond to PD1/PD-L1 axis targeted ICI therapy (5), new biomarkers that accurately predict ICI therapy outcome are needed.
PET imaging, which permits noninvasive whole-body visualization of tumor and immune cell characteristics, provides unique insights into the mechanisms of action, and failure, of ICI immunotherapy (6). For instance, 18F-FDG PET/CT can potentially predict patient response to ICI therapy (7–9). Routinely used in oncology for staging and monitoring cancer patients, 18F-FDG PET has proven useful. However, a major challenge in delineating immunotherapy response with 18F-FDG PET is that the uptake of 18F-FDG can be complicated by glucose metabolism modulators, which are not specific to immunotherapy. Another approach is to use immuno-PET that combines PET radioisotopes with targeting antibodies to image immune checkpoint biomarkers. This approach enables noninvasive assessment of immune checkpoint biomarker expression levels in both primary tumors and metastatic lesions (6,10). The expression of immune checkpoint molecules may correlate with therapeutic response, thereby improving patient selection for ICI therapy. The availability of ICI molecules, including targeting antibodies, engineered fragments, or binders for the PD1/PD-L1 immune checkpoint axis, has fueled development of ICI-targeted PET tracers (4,11–13). As an additional advantage, imaging of tumor-associated immune components with immuno-PET may offer useful information about the patient’s tumor microenvironment (14,15).
Tumor-specific major histocompatibility complex II (tsMHC-II) expression has been reported to associate with the prognosis of PD1/PD-L1 immunotherapy, and major histocompatibility complex II (MHC-II) molecules are required for tumor antigen presentation. The downregulation of MHC-II in numerous malignancies implicates immune system control of cancer progression and evolution (16,17). The expression of tsMHC-II is a critical biomarker for tumor antigen presentation in melanoma and may predict anti-PD1/PD-L1 therapy response (18). The promising role of MHC-II neoantigens in tumor immunity provided a compelling rationale for us to develop an MHC-II immuno-PET tracer that detects tsMHC-II and to investigate its predictive value for tumor response to immunotherapy. PET imaging was attempted to image MHC-II expressed on myeloid cells, as myeloid cells are associated with the tumor microenvironment for immune response prediction (19). We geared the effort to develop PET imaging for noninvasive assessment of tsMHC-II expression and validate its predicative value to immune responses (14,20,21).
MATERIALS AND METHODS
DOTA Conjugation and Radiolabeling
MHC-II antibody (0.2 mL; 7 mg/mL) was added to 200 μL of DOTA-N-hydroxysuccinimide-ester phosphate-buffered saline (PBS) solution (0.15 mg; 0.75 mg/mL). NaOH (10 μL; 0.1 M) was added to adjust to a pH of approximately 8–9. The reaction mixture was stirred in the dark at 0°C for 6 h. The crude product was purified by PD-10 chromatography. The DOTA-MHCII fraction was collected and used for radiolabeling. Conjugation of DOTA on MHC-II antibody was confirmed by mass spectrometry.
For radiolabeling of 64Cu-acetate, 64CuCl2 (185 MBq in 0.1 M HCl) was combined with 300 μL of 0.1 M ammonium acetate (pH 5.6), stirred in a vortex mixer, and incubated for 15 min at room temperature. DOTA-MHCII (50 μL) in PBS (200 μL) was mixed with 64Cu-acetate (37–74 MBq) and incubated at 30°C for 60 min. 64Cu-DOTA-MHCII was purified by PD-10 chromatography, with a radiochemical yield of approximately 55%–70%. The calculated specific activity was 92.5–118.4 MBq/mg.
Murine B16 Melanoma Models
Murine B16F10 melanoma cells (American Type Culture Collection) and B16SIY cells engineered from B16F10 to express SIYRYYGL (SIY) antigen were treated similarly, that is, with Dulbecco modified Eagle medium supplemented with 10% fetal bovine serum. The cells were cultured in 5% CO2 at 37°C and used at 75% confluence.
All animal studies were approved by the Institutional Animal Care and Use Committee of the Houston Methodist Research Institute. To generate the murine melanoma models, 1 × 10⁶ cells were harvested and suspended in 100 μL of Matrigel (Corning) diluted 1:1 with PBS and subcutaneously injected into the left flank of mice. Each melanoma model, B16F10 or B16SIY, was challenged with vehicle, anti-PD1, or interferon γ (IFNγ). Briefly, the anti-PD1 group received 3 consecutive intraperitoneal injections of antimouse PD1 antibody (120 μg/mouse) every other day, after which the tumor was about 100–200 mm3. Anti-PD1 mice (bearing tumors of ∼600 mm3) were used for PET imaging and the subsequent biodistribution study. For IFNγ stimulation, mice with tumors of approximately 600 mm3 were each given a single intraperitoneal injection of 10 μg of recombinant mouse IFNγ at 24 h before PET imaging. Basal level tsMHC-II expression in mice was based on PET images when tumors reached approximately 600 mm3.
Small-Animal PET/CT Imaging and Biodistribution Study
Small-animal PET/CT was performed and the scans analyzed using a Siemens Inveon PET/CT imaging system. Approximately 3.7 MBq of 64Cu-DOTA-MHCII (33 μg of antibody) were intravenously injected into tumor-bearing mice (n = 6) via the tail vein. In-line PET and CT scans were acquired at 24 and 48 h after injection, and images were obtained using the manufacturer’s 2-dimensional ordered-subsets expectation maximum algorithm. Two control PET imaging studies were performed to validate the specificity of the radiotracer with the following blocking agents: nonradiolabeled MHC-II antibody and nonradiolabeled rat IgG2b isotype control. Details on the blocking study and PET/CT image processing are given in the supplemental materials (available at http://jnm.snmjournals.org). After the scans were obtained at 48 h after injection, the mice were killed to evaluate radiotracer biodistribution between major organs. The radioactivity that had accumulated in each tissue was measured using a 2470 Wizard2 automatic γ-counter (Perkin Elmer) and was calculated as radioactivity divided by tissue weight and decay-corrected injected dose to be expressed as percentage injected dose (%ID)/g.
Histopathologic, Western Blotting, and Flow Cytometry Assays
Tumor tissues were collected after terminal PET/CT scans and fixed overnight in 4% paraformaldehyde, followed by processing, paraffin embedding, and sectioning into 4- to 5-μm tissue sections. The sections were deparaffinized in xylene and a series of ethanol solutions and then were treated with 0.3% hydrogen peroxide for 20 min, followed by incubation in 5% horse serum block for 10 min before the addition of MHC-II primary antibody. Detection was performed with a horseradish peroxidase–conjugated respective secondary system followed by diaminobenzidine and counterstaining with hematoxylin solution. For immunofluorescence staining, the sections were immunofluorescence-stained with Texas red antirat IgG. Images were captured using an inverted fluorescence microscope.
Tumor tissues from a separate cohort (n = 6) were collected for Western blotting of tsMHC-II expression. Briefly, fresh tumor samples were collected, homogenized, and lysed in 0.1 Triton X-100 buffer. The lysed samples were electrophoresed in sodium dodecyl sulfate polyacrylamide electrophoresis gels (Bio-Rad) after protein quantification by a bicinchoninic acid protein assay according to the manufacturer’s protocol, with equivalent protein amounts loaded for each group. Proteins were blotted onto polyvinylidene difluoride membranes by wet transfer. The membranes were probed with MHC-II antibody and secondary antibody and were developed using enhanced chemiluminescence reagent; images were acquired using the ChemiDoc (Bio-Rad Laboratories) gel documentation system.
Another cohort (n = 6) was used to analyze tumors by flow cytometry. The tumor tissues were freshly harvested and ground into small bits in 2% fetal bovine serum–supplemented RPMI1640 medium. The cell suspension was filtered through a 40-μm cell strainer, washed with 1% bovine serum albumin–supplemented PBS, and centrifuged at 500g for 5 min. The cell pellet was collected and resuspended for subsequent antibody staining. A 100 μL/tube volume of 106 cells suspended in 1% bovine serum albumin in PBS was incubated with fluorescent monoclonal antibodies specific to antimouse MHC-II (fluorescein isothiocyanate antimouse MHC-II, catalog no. 107606; BioLegend), PD-L1 (phycoerythrin antimouse PD-L1, catalog no. 124308; BioLegend), and CD-45 (allophycocyanin antimouse CD45, catalog no. 103112; BioLegend) at room temperature for 30 min. The tubes were washed twice with 1 mL of 1% bovine serum albumin in PBS and centrifuged at 500g for 5 min. The stained cell data were acquired and analyzed using a BD LSRFortessa flow cytometer.
Statistics
Quantitative data were expressed as mean ± SD. Means were compared using the Student t test. The 95% confidence level was chosen to determine the significance between groups, and a P value of less than 0.05 was considered statistically significant.
RESULTS
We first sought to validate the correlation of tsMHC-II with its immune response in melanomas. Fluorescence-activated cell sorting analysis revealed the basal level and dynamic change in tsMHC-II expression in 2 distinct murine melanomas, B16F10 and B16SIY, low and high responders, respectively (14,20,21). The leukocyte-associated biomarker, CD45, was used to segregate tumor cells (CD45-negative) from other immune cells (CD45-positive). The CD45-negative/MHC-II–positive population was considered the tsMHC-II population. The fluorescence-activated cell sorting result showed a mildly higher (P = 0.0382) basal level of tsMHC-II in immune-responder B16SIY (46.8% ± 5.1%) than in immune-nonresponder B16F10 (33.3% ± 3.6%) (Fig. 1). Importantly, the tsMHC-II in B16SIY increased (81.6% ± 9.8%) after stimulation by the immunity activator, IFNγ, which also increased tsMHC-II in B16F10 (51.0% ± 5.8%); however, the increase was less than in B16SIY. In contrast, treatment of tumors with anti-PD1 antibody increased tsMHC-II over basal levels in B16F10 (48.1% ± 5.4%) and B16SIY (60.9% ± 6.8%). Meanwhile, tsMHC-II expression levels in anti-PD1–treated mice remained higher in B16SIY than in B16F10. Of note, the increase in tsMHC-II was more profound after IFNγ stimulation than after anti-PD1 treatment in the immunity-responding B16SIY tumor, whereas the difference between IFNγ stimulation and anti-PD1 treatment in the non–immunity-responding B16F10 tumor was absent. These data confirmed the positive correlation of tsMHC-II with tumor immune response. More importantly, compared with immunity nonresponders, upregulation of tsMHC-II in immunity-responder tumors was more sensitive to immunity perturbation, particularly IFNγ stimulation.
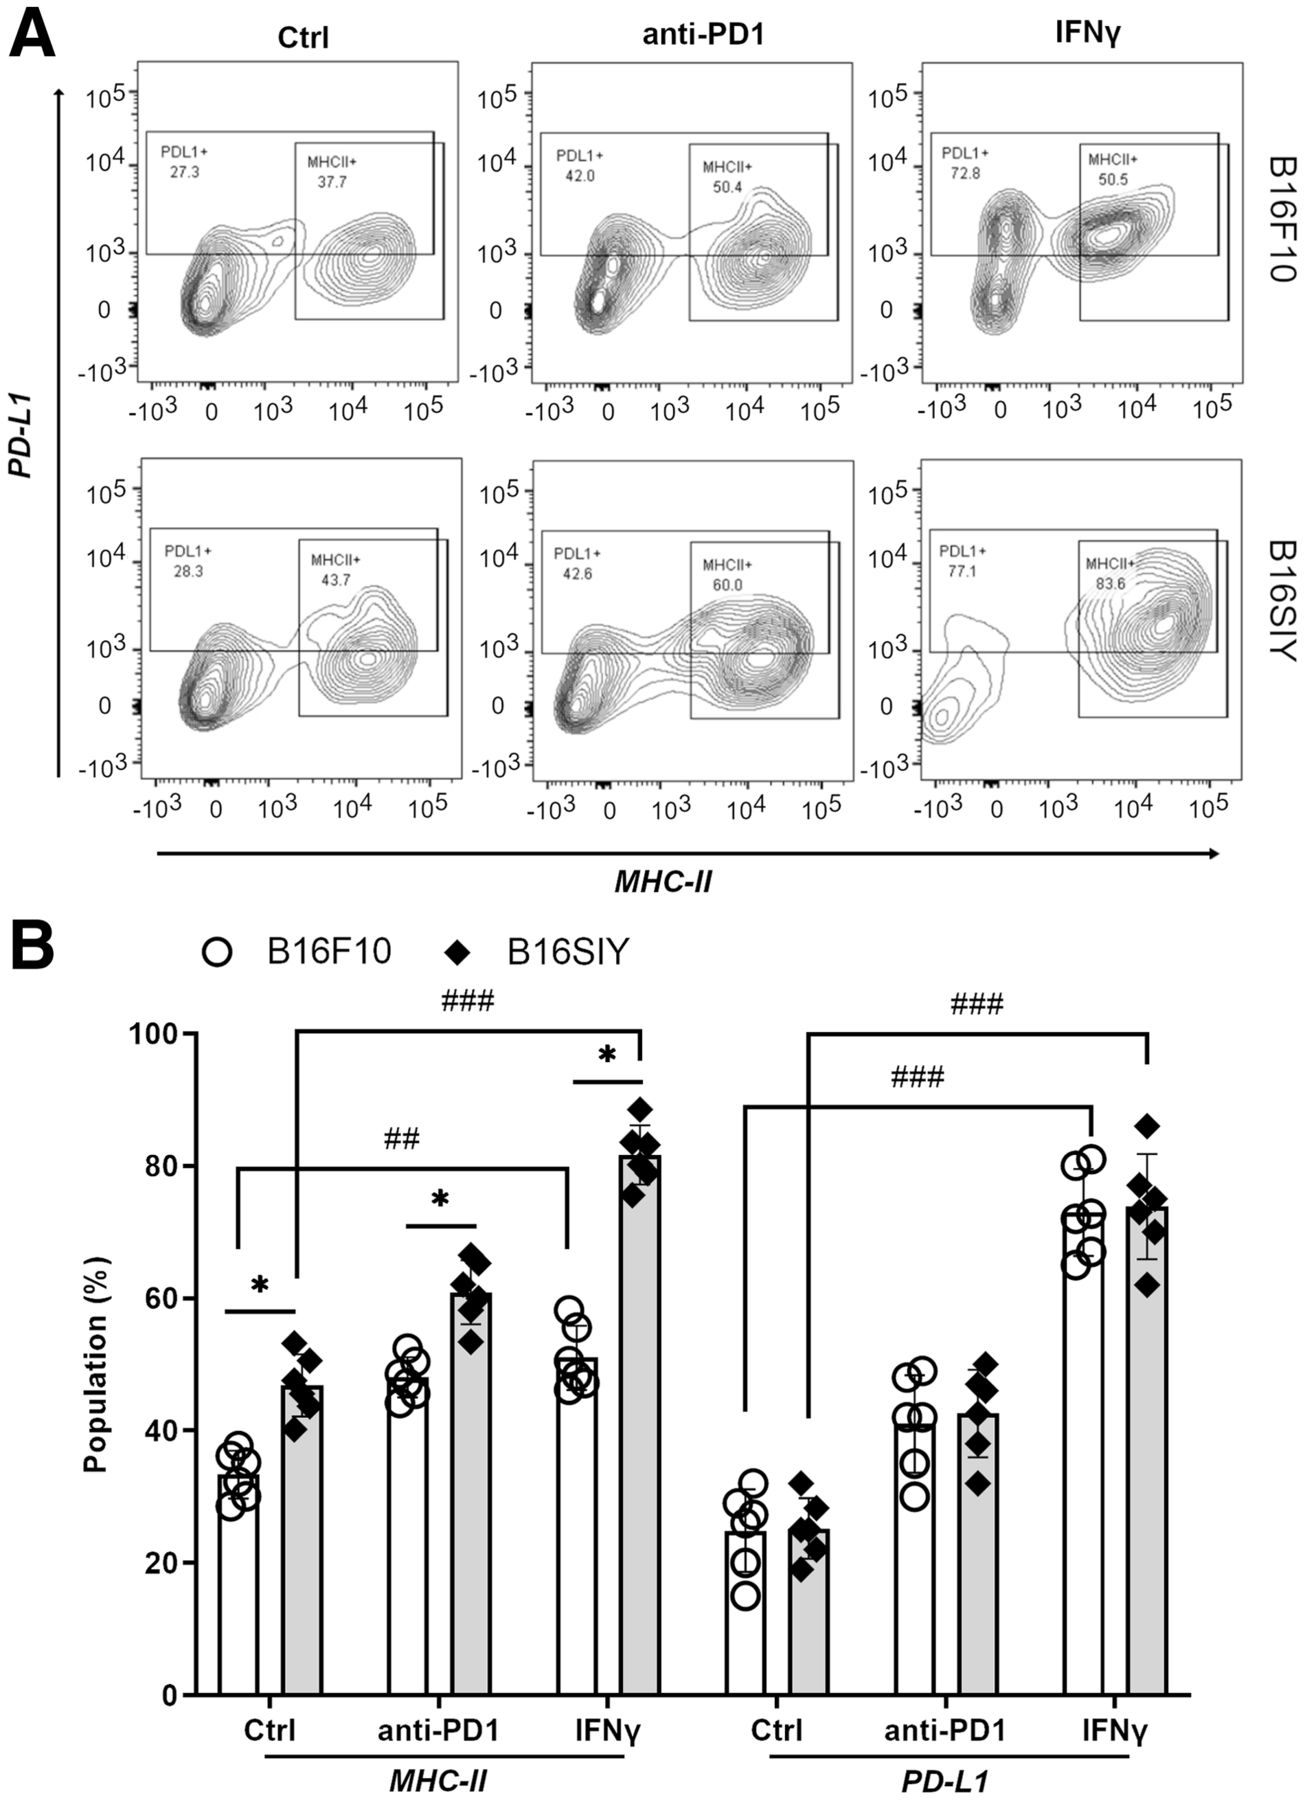
(A) Fluorescence-activated cell sorting analysis of tsMHC-II and PD-L1 population in B16F10 and B16SIY tumors and population changes when treated with anti-PD1 and IFNγ immunity stimulants. (B) Summary of fluorescence-activated cell sorting assay (n = 6 for each cohort). Statistical analysis for MHC-II: B16F10 control vs. B16SIY control (P = 0.0382), B16F10 PD1 vs. B16SIY PD1 (P = 0.0158), B16F10 IFNγ vs. B16SIY IFNγ (P = 0.0112), B16F10 control vs. B16F10 IFNγ (P = 0.0026), and B16SIY control vs. B16SIY IFNγ (P = 0.0001). Statistical analysis for PD-L1: B16F10 control vs. B16F10 IFNγ (P = 0.0001) and B16SIY control vs. B16SIY IFNγ (P = 0.0001). *P < 0.05. ##P < 0.01. ###P < 0.001. Ctrl = control.
In addition, PD-L1 expression in tumors was analyzed in the same cohort. Both basal expression and change in PD-L1 were similar between B16F10 and B16SIY in several ways: first, baseline expression of PD-L1 was 24.3% ± 4.2% in B16F10 and 29.4% ± 5.6% in B16SIY; second, the PD-L1 expression was similarly increased to 38.8% ± 5.6% and 40.8% ± 6.2% for B16F10 and B16SIY tumors, respectively; and third, notably, when stimulated with IFNγ, increased PD-L1 expression in B16F10 and B16SIY correlated similarly with tsMHC-II expression, at 69.7% ± 9.8% and 74.7% ± 10.1%, respectively. However, between B16F10 tumors and B16SIY tumors, there was no distinctive change in PD-L1 expression in either the baseline (P = 0.34) or the anti-PD1/INFγ–stimulated groups. Comparison of tsMHC and PD-L1 in B16F10 and B16SIY (Fig. 1B) revealed that tsMHC-II manifests as a sensitive correlation with tumor response to the immunotherapy, whereas a similar correlation was not found in the assessment of PD-L1 expression in tumor. Therefore, we reasoned that tsMHC-II and its preferential induction by IFNγ immune perturbation have better predictive value for therapeutic inhibition of the PD1/PD-L1 axis.
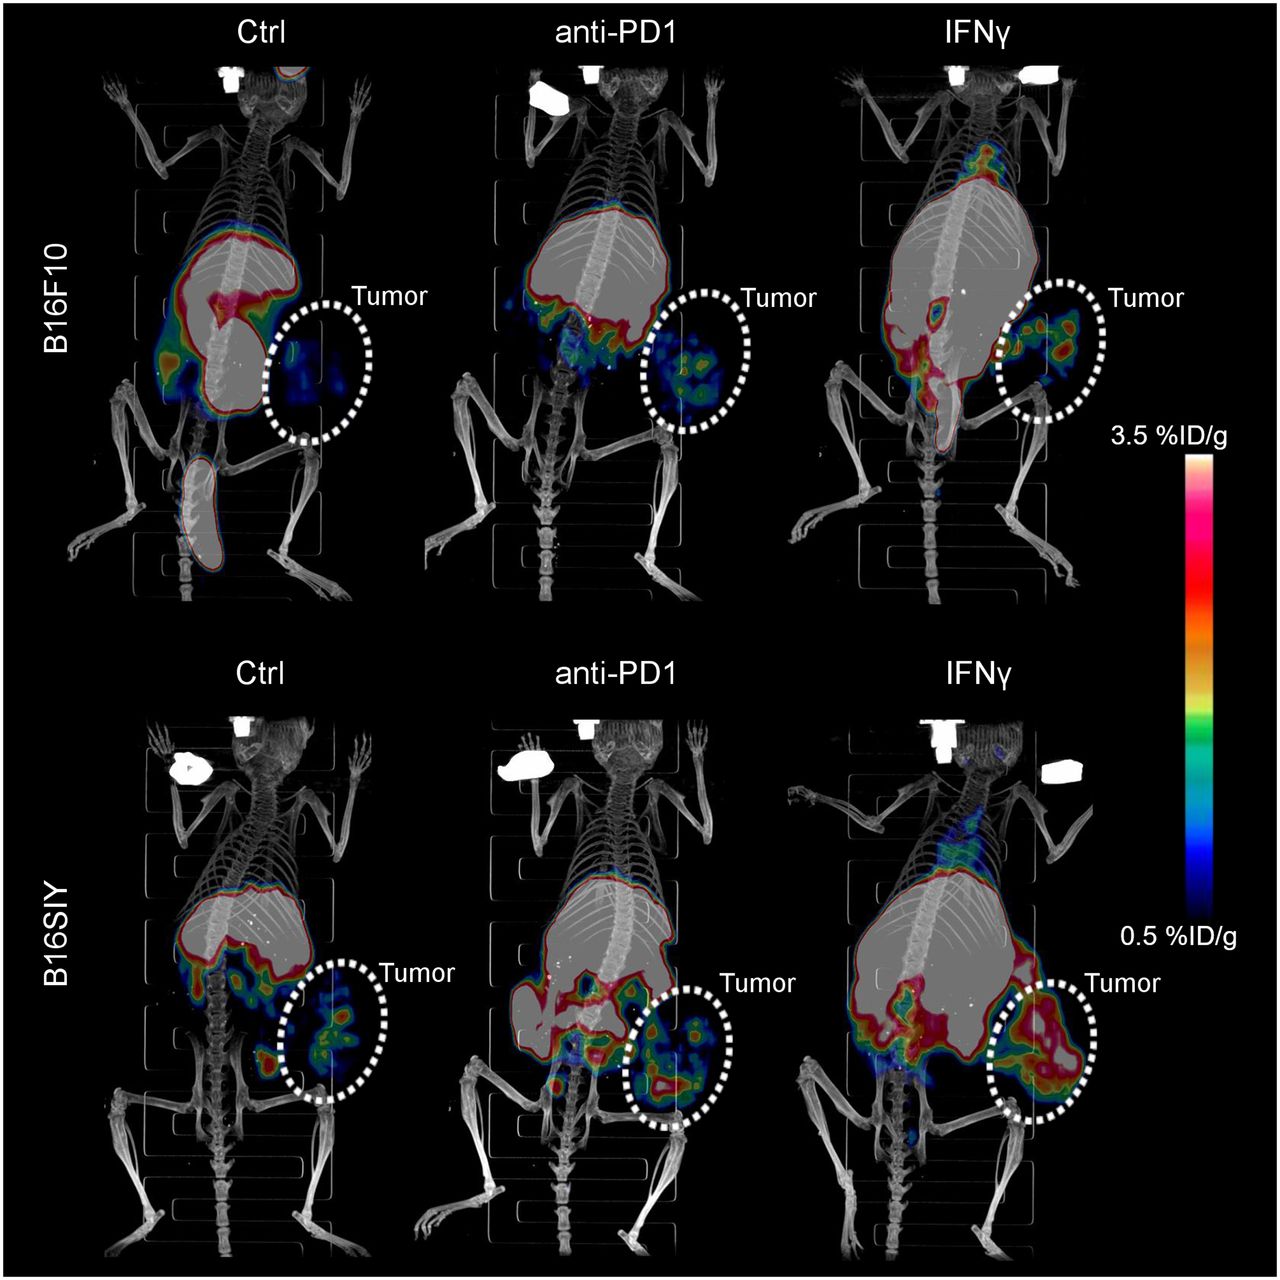
To noninvasively image the tsMHC-II, murine MHC-II antibody was chemically modified with DOTA chelator. After conjugation, the reaction was quenched and analyzed using mass spectrometry to confirm that chelator conjugated on MHC-II antibody, following the literature procedure (22). Immunofluorescence staining and Western blot assays revealed no significant change in the immunoreactivity of the antibody toward the MHC-II target on chemical conjugation (Supplemental Figs. 1–3). Afterward, the DOTA-conjugated MHC-II antibody was radiolabeled with 64Cu isotope to obtain a MHC-II immuno-PET tracer (64Cu-DOTA-MHCII) for noninvasive in vivo imaging of tsMHC-II in murine B16F10 and B16SIY tumor models. Higher baseline 64Cu-DOTA-MHCII uptake was observed in B16SIY than in B16F10 tumors (Fig. 2). After IFNγ stimulation, 64Cu-DOTA-MHCII uptake increased more in immune-responder B16SIY than in nonresponder B16F10 tumors, whereas anti-PD1 treatment increased tumor uptake, with a magnitude that was less prominent than that of IFNγ.

Three-dimensionally rendered maximum-intensity projection of PET/CT images of control, anti-PD1–treated, and IFNγ-stimulated B16F10 and B16SIY tumor-bearing mice 48 h after injection of 64Cu-DOTA-MHCII. Circled areas are tumor site. Ctrl = control.
Region-of-interest analysis of tumor uptake (Fig. 3A) confirmed the distinctive tsMHC-II expression pattern in the 2 tumor models: first, 64Cu-DOTA-MHCII uptake was 2.75-fold higher (P = 0.0082) in B16SIY tumors (1.1 ± 0.2 %ID/g) than in B16F10 tumors (0.4 ± 0.1 %ID/g) in control groups; second, likewise, B16SIY exhibited higher uptake of 64Cu-DOTA-MHCII in tumor (1.8 ± 0.3 %ID/g) than did B16F10 (0.7 ± 0.2 %ID/g) when treated with anti-PD1 antibody (P = 0.0035); and third, IFNγ stimulation further amplified 64Cu-DOTA-MHCII uptake in B16SIY tumor (3.2 ± 0.4 %ID/g). This uptake was 2.9-fold higher than that in B16F10 (1.1 ± 0.2 %ID/g) (P = 0.0002). By comparing the tumor uptake of 64Cu-DOTA-MHCII tracer in control groups with IFNγ-stimulated groups, the dynamic change in tsMHC-II expression was derived. We saw that the change in tsMHC-II induced by IFNγ in B16SIY (P = 0.0003) was greater than that in B16F10 (P = 0.034). A similar change by anti-PD1 treatment in real time was also analyzed. However, no significant change was observed in B16F10 (P = 0.0862), and a less potent difference was observed in B16SIY (P = 0.0092).

(A) Region-of-interest quantification of tumor-accumulated 64Cu-DOTA-MHCII in PET images (n = 6 per group). Unpaired Student t test was performed to compare B16F10 control vs. B16SIY control (P = 0.0082), B16F10 PD1 vs. B16SIY PD1 (P = 0.0035), B16F10 IFNγ vs. B16SIY IFNγ (P = 0.0002), B16F10 control vs. B16F10 IFNγ (P = 0.034), and B16SIY control vs. B16SIY IFNγ (P = 0.0003). (B) Tumor uptake of 64Cu-DOTA-MHCII in biodistribution study at 48 h after injection. Unpaired Student t test was performed to compare B16F10 control vs. B16SIY control (P = 0.0002), B16F10 PD1 vs. B16SIY PD1 (P = 0.0003), B16F10 IFNγ vs. B16SIY IFNγ (P = 0.0002), B16F10 control vs. B16F10 IFNγ (P = 0.0044), and B16SIY control vs. B16SIY IFNγ (P = 0.0001). (C) Biodistribution study of 64Cu-DOTA-MHCII in B16F10 tumor model. (D) Biodistribution study of 64Cu-DOTA-MHCII in B16SIY tumor model (n = 6). *P < 0.05. **P < 0.01. ***P < 0.001. #P < 0.05. ##P < 0.01. ###P < 0.001. GI = gastrointestinal.
Biodistribution analysis further confirmed distinctive tumor uptake of the 64Cu-DOTA-MHCII tracer in B16F10 and B16SIY at baseline, as well as under the anti-PD1– and IFNγ-treated conditions (Fig. 3B). IFNγ stimulation and anti-PD1 treatment upregulated systemic MHC-II in both tumor models (Figs. 3C and 3D). The distinctive imaging pattern of tumor uptake of the 64Cu-DOTA-MHCII tracer in B16F10 and B16SIY confirmed that noninvasive imaging of tsMHC-II at baseline and an IFNγ-induced dynamic change may be used to distinguish immune-responder from nonresponder tumors.
The specificity of the tracer was thoroughly tested using additional controls (Supplemental Figs. 4–6). A blocking study using excessive nonradiolabeled MHC-II antibody showed an obvious reduction in tumor-uptake signal, a finding that supported the specific binding of 64Cu-DOTA-MHCII tracer in the PET imaging. In addition, a blocking study with excessive nonradiolabeled IgG was performed and showed no dramatic effect on tumor uptake. It ruled out significant nonspecific uptake of the radiotracer resulting from Fc receptor. When we closely examined the biodistribution change in the radiotracer in blocking studies, excessive blocking with nonradiolabeled MHC-II antibody seemed to diminish the accumulation of radiotracer in liver and spleen. But the changes were not deemed significant within the current dataset. As for blocking using IgG isotype, no significant change was observed in biodistribution of the radiotracer.
Western blot assay showed a higher tsMHC-II expression at baseline in B16SIY than in B16F10 tumors in the control samples (Figs. 4A and 4B). Anti-PD1–treated and IFNγ-stimulated B16SIY versus B16F10 tumors expressed more tsMHC-II. Notably, the tsMHC-II expression was increased when induced by anti-PD1 treatment and IFNγ stimulation, and the dynamic change was prominently higher in B16SIY tumor than in B16F10 tumor. A similar tsMHC-II expression pattern was also observed in the immunohistochemistry assay (Fig. 4C).

Western blot of tsMHC-II expression (A) and dot density quantified by ImageJ (B) in control, anti-PD1–treated, and IFNγ-treated B16F10 and B16SIY tumors. Expression level was normalized by GAPDH across various groups. (C) Immunohistochemistry staining of MHC-II in tumors. Ctrl = control.
We further performed immunofluorescence staining to examine the origin of the MHC-II–positive cells. Most MHC-II–positive cells are CD45-negative (Fig. 5A), supporting the conclusion that different MHC-II expression patterns were due to tumor cells. When the quantified MHC-II fluorescence was normalized by the CD45-negative cell numbers, a positive correlation of tsMHC-II with the response of tumor to immunotherapy was derived, as was consistent with the results obtained in the in vivo PET imaging and in the fluorescence-activated cell sorting analyses (Fig. 5B). By noninvasive imaging, the histopathologic study supported that immune-responsive tumors exhibit a high level of tsMHC-II expression even at baseline, that expression is sensitive to immune perturbation and can be preferentially elevated by IFNγ stimulation, and that tsMHC-II immuno-PET noninvasively assesses the basal tsMHC-II and its dynamic change on immunity stimulation—which provided a promising predictive value for distinguishing tumor responders to immunotherapy from nonresponders.
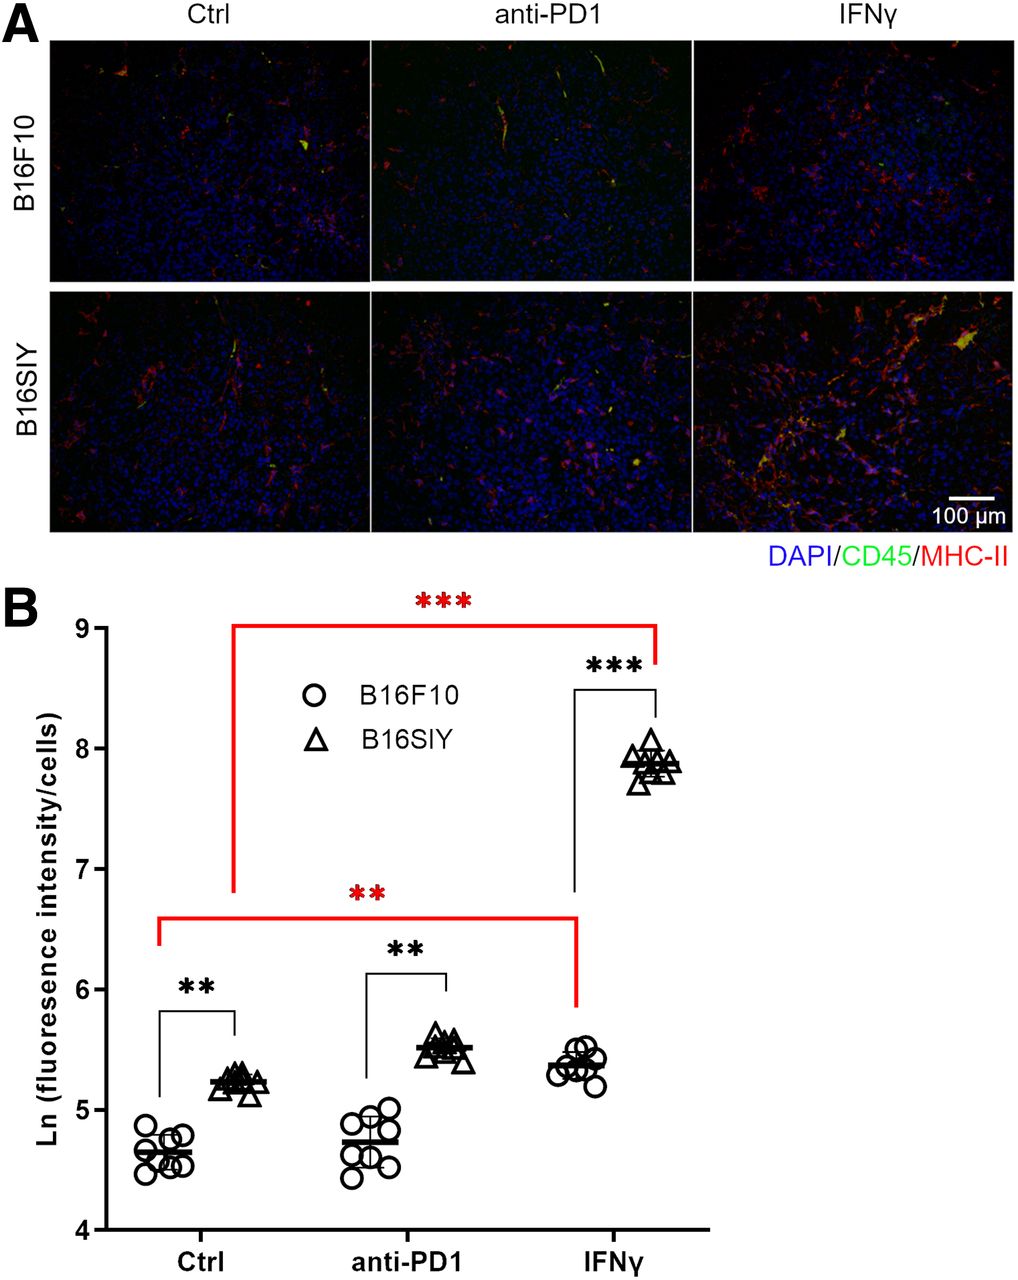
(A) Immunofluorescent staining of CD45 and MHC-II in control, anti-PD1–treated, and IFNγ-treated B16F10 and B16SIY tumors. (B) Fluorescence intensity quantified by ImageJ. Fluorescence intensity was normalized by nucleus numbers that represent cell numbers, and ratio was plotted as natural logarithm to compare differences across groups. Eight different views were analyzed per sample to obtain statistics. Unpaired Student t test was performed to compare B16F10 control vs. B16SIY control (P = 0.0046), B16F10 PD1 vs. B16SIY PD1 (P = 0.0031), and B16F10 IFNγ vs. B16SIY IFNγ (P < 0.0001). Meanwhile, dynamic change was also compared: B16F10 control vs. B16F10 IFNγ (P = 0.0024) and B16SIY control vs. B16SIY IFNγ (P < 0.0001). **P < 0.01. ***P < 0.001. Ctrl = control.
DISCUSSION
Recent clinical studies have revealed that the specific haplotype of MHC-II, HLA-DR, expressed on tumors represents a tumor-autonomous phenotype and is associated with its response to the targeted immunotherapy (18,23,24). Currently, no in vivo PET imaging targeting the HLA-DR has been reported to further validate the idea. Here, we selected 2 murine melanoma tumors with distinctive responses to immunotherapy to investigate the predictive value of tsMHC-II immuno-PET imaging (14,20,21). A commercially available antimouse MHC-II antibody was used to target the tsMHC-II, and its specificity was validated in binding assays before in vivo PET imaging. Worth noting is that a specific HLA-DR immuno-PET tracer can be developed to further translation to human studies.
Our fluorescence-activated cell sorting analysis showed a result consistent with the report that tsMHC-II positively correlates with tumor response to cancer immunotherapy (18,23). Furthermore, in vivo tsMHC-II immuno-PET imaging clearly distinguished B16SIY from B16F10 tumors by noninvasively assessing tsMHC-II. This observation was further corroborated by ex vivo histopathologic studies and a biochemical assay of the tumor tissue collected from the same cohort as used in the in vivo studies. Collectively, these data support the hypothesis that tsMHC-II expression is associated with tumor response to immunotherapy and that noninvasive imaging of tsMHC-II using immuno-PET delineates the characteristic tsMHC-II expression.
Cells and molecules that regulate the immune system are dynamically changed on immune stimulation. PD-L1 is involved in anti-PD1/PD-L1 axis blockade immunotherapy and is thereby rationalized as a biomarker to distinguish responding tumors from nonresponders (4,13,24,25). However, some tumors were identified with negligible PD-L1 expression at the basal level but preferentially induced a dynamic increase in PD-L1 expression in tumor by immune response and, thereby, may still benefit from the immunotherapy. Therefore, the sensitivity of tsMHC-II to a dynamic change in tumor immunity—specifically, as raised by therapeutic anti-PD1 blockade that targets the PD1/PD-L1 immunotherapy axis—was also examined in this study. Whereas the B16SIY tumor still had a higher level of MHC-II positivity and 64Cu-DOTA-MHCII PET signal than that of B16F10 tumor, the dynamic changes stimulated by anti-PD1 treatment were not as significant when compared with the basal levels. Tumor immunity and inflammation often involve IFNγ signaling, and IFNγ preferentially induces upregulation of MHC-II expression on tumor cells to promote tumor immunity (26–29). PET imaging is a useful tool for monitoring response to tumor immunotherapy (11). So, we additionally examined the dynamic change in tsMHC-II on IFNγ stimulation. This comparison found that the IFNγ-induced increase in MHC-II expression on tumor cells was greater in the B16SIY tumor, with the better immunity response, than in the B16F10 tumor, with a lower immunity response. These findings suggest that tsMHC-II immuno-PET imaging might be used to monitor tsMHC-II at the basal level and IFNγ-stimulated dynamic changes, raising the possibility that the combined high manifestations might be used as a reliable prospective indicator of good response to cancer immunotherapy.
CONCLUSION
We uncovered a correlation between tsMHC-II and tumor immunity with response to checkpoint inhibitor immunotherapy in murine melanoma by PET. The newly developed 64Cu-DOTA-MHCII PET tracer captured the characteristic tsMHC-II in melanoma and provided noninvasive imaging of dynamic tsMHC-II expression. The distinctive tsMHC-II immuno-PET images from immune-responder and immune-nonresponder tumors revealed that tsMHC-II is a promising predictive biomarker for tumor response to cancer immunotherapy. Monitoring of tsMHC-II at baseline and IFNγ-stimulated dynamic changes might be used to effectively identify immune-responder patients from nonresponders before immunotherapy to avoid unnecessary side effects.
DISCLOSURE
This work was supported by the Houston Methodist Academic Institute and the Houston Methodist Hospital Foundation. This research was funded in part through NIH U54CA210181 and R01CA245920-02, the Finger Distinguished Endowed Chair, and the M.D. Anderson Distinguished Endowed Chair. No other potential conflict of interest relevant to this article was reported.
KEY POINTS
QUESTION: What is the potential for a new immuno-PET tracer developed to predict tumor response to immunotherapy?
PERTINENT FINDINGS: TsMHC-II and its dynamic modulation were validated to correlate with tumor response to immunotherapy. MHC-II antibody–derived immuno-PET imaging showed in vivo assessment of tsMHC-II and thereby provided predictive value regarding tumor response to the immunotherapy.
IMPLICATIONS FOR PATIENT CARE: Monitoring of tsMHC-II at baseline and IFNγ-stimulated dynamic changes might be used to effectively identify immune-responder patients from nonresponders before immunotherapy to avoid unnecessary side effects.
ACKNOWLEDGMENTS
We thank Dr. Henry Pownall and Kimberly Greer for revision of the paper, and we thank the preclinical imaging core facility of the Houston Methodist Academic Institute.
Footnotes
Published online Feb. 24, 2022.
- © 2022 by the Society of Nuclear Medicine and Molecular Imaging.
REFERENCES
- Received for publication September 1, 2021.
- Revision received February 17, 2022.
In this issue


Jump to section
Related Articles
Cited By...
- No citing articles found.