


Abstract
Brown adipose tissue (BAT) was first described in the 16th century, but until late last century had mainly been considered a tissue with the function of nonshivering thermogenesis, maintaining body temperature in key organs in newborns who have high body surface areas relative to their weight and thus marked radiative heat loss. BAT was believed to have substantially disappeared by adulthood. Molecular imaging with 18F-FDG PET and PET combined with CT, as well as imaging with 131I-metaiodobenzylguanidine (MIBG) beginning late last century have shown BAT to be present and active well into adulthood. This review highlights key aspects of BAT biology, early empiric observations misidentifying BAT, pitfalls in image interpretation, and methods to intentionally reduce BAT uptake, and outlines multiple imaging methods used to identify BAT in vivo. The therapeutic potential of increasing the amount or activity of BAT for weight loss and improvement of glucose and lipid profiles is highlighted as a major opportunity. Molecular imaging can help dissect the physiology of this complex dynamic tissue and offers the potential for addressing challenges separating “active BAT” from “total BAT.” Research in BAT has grown extensively, and 18F-FDG PET is the key imaging procedure against which all other BAT imaging methods must be compared. Given the multiple functions of BAT, it is reasonable to consider it a previously unrecognized endocrine tissue and thus an appropriate topic for review in this supplement to The Journal of Nuclear Medicine.
- 18F-fluorodeoxyglucose (FDG)
- brown adipose tissue (BAT)
- computed tomography (CT)
- metaiodobenzylguanidine (MIBG)
- positron emission tomography (PET)
Brown adipose tissue (BAT or brown fat) was first described by Swiss physician and naturalist Conrad Gessner in the 16th century (1). Originally termed the “hibernating gland,” BAT was assigned various physiologic roles over the following centuries, including postulating it to be part of the thymus, as an alternate food reservoir, and as an endocrine gland during several different periods (2). Eventually, BAT was identified as a thermogenic organ and the primary facilitator of nonshivering thermogenesis in mammals (3), although its function as an endocrine organ is increasingly recognized (4).
Despite early histologic evidence to the contrary, it was generally assumed any BAT possessed by adult humans was mostly dormant (3,5). The realization that active BAT was present in adult humans came unexpectedly from problems arising with new clinical imaging techniques. The senior author of this paper vividly recalls examining scans of children and young adults using the then “new” compound 131I-metaiodobenzylguanidine (131I-MIBG). Uptake of 131I-MIBG was apparent in the supraclavicular areas of some patients and local lore from the pioneers in 131I-MIBG clinical use, including the late James Sisson, was that this uptake was in the “stellate ganglion,” a target of interest at that time (6). This seemed an impossibly large ganglion to me and quite unusual. Descriptions of 131I-MIBG distribution at the time described instances of normal uptake in the “upper lungs” (7). In retrospect, some of these observations were likely visualization of BAT.
In the late 1980s and early 1990s, the application of 18F-FDG PET for the detection of tumors increased in use. Not infrequently, 18F-FDG PET image interpretations were hindered by the appearance of symmetric areas of increased uptake, most apparent in the supraclavicular area (8,9). At first, this activity was mostly attributed to skeletal muscle uptake. Some of our (RL Wahl and MS Wicha, unpublished data, 1991) early studies of breast cancer treatment response with PET showed areas of 18F-FDG uptake in the upper thorax and lower neck, which was absent, then present, then absent on closely spaced 18F-FDG PET studies. I (the senior author) recall a case in which I had to convince an oncologist not to treat this new 18F-FDG uptake as it had appeared too quickly to represent tumor progression and then was gone on a subsequent study. Barrington et al. described this uptake and found it could be minimized by administering diazepam before 18F-FDG PET imaging (8). Dr. Barrington and I, 2 early adopters of 18F-FDG PET in oncology, published in our jointly authored textbook that this uptake in the neck muscles was artifactual and caused by muscle contraction during 18F-FDG uptake, due to “tense” muscles in tense patients (10). Hany et al. in 2002, Cohade et al. in 2003, and others with early access to PET combined with CT (PET/CT) posited that this supraclavicular 18F-FDG activity represented uptake within activated BAT (11–14). By combining 18F-FDG PET with CT, it became clear that the 18F-FDG activity in the “tense muscles” was not localizing to muscle but very clearly was in adipose tissue as it was found in anatomic areas with distinctively low Hounsfield units (HUs) only seen in fat.
Despite these informative early observations, further evidence was needed to verify that these areas of increased 18F-FDG uptake were actually in BAT. It was shown in rats and humans that 18F-FDG uptake could be reduced or eliminated pharmacologically (Fig. 1) using β-blockers (15). In mice, once interscapular BAT was removed, corresponding areas of previous 18F-FDG uptake disappeared on subsequent PET imaging (16). In case studies of patients undergoing 18F-FDG PET/CT or 123I-MIBG scintigraphy imaging for suspected pheochromocytomas (Fig. 2), tumors associated with increased adrenal activity and BAT recruitment, primary tumor removal resulted in resolution of previously seen bilateral supraclavicular radiotracer uptake (17).

BAT can be activated by cold (coronal maximum-intensity projection [MIP], A) and inhibited using exposure to warmth and substances that block β-adrenergic receptors (coronal MIP, B), such as propranolol (this subject received 2 mg of propranolol before 18F-FDG administration).

Anterior and lateral planar 123I-MIBG chest images. Positive and symmetric tracer uptake in the lower neck and shoulder region (indicated with arrows). In retrospect, these areas of uptake are likely BAT. (Reprinted with permission of (17).)
Several PET and SPECT tracers were evaluated in rodents for their capabilities in localizing to BAT (Table 1). 18F-FDG, 131I-MIBG, and 99mTc-methoxyisobutylisonitrile (99mTc-MIBI) were shown to be particularly promising agents (18–20). Knowing BAT had a high density of mitochondria, which would be expected to be targeted by 99mTc-MIBI, a review of 99mTc-MIBI SPECT scans performed for suspected parathyroid adenomas (Fig. 3) revealed incidental BAT uptake of 99mTc-MIBI in 6.3% of cases (21). Reviewing 18F-FDG and 18F-fluorodopamine (DOPA) PET/CT images, as well as 123I-MIBG SPECT images, from 96 patients evaluated for pheochromocytomas, Hadi et al. found 27% of patients showed uptake on at least 1 modality in areas known to contain BAT and several patients had corresponding uptake on images from multiple modalities (22).
Animal Studies of Imaging Methods Used to Identify and Quantify BAT Activity

SPECT imaging performed on a 26-y-old woman with primary hyperparathyroidism shows supraclavicular BAT in addition to right superior mediastinal parathyroid adenoma (confirmed at time of surgery). 99mTc-MIBI uptake seen on SPECT clearly fuses to BAT. Selected coronal (A–D) images of CT (A), SPECT (B), fused SPECT/CT (C), and maximum-intensity projection (D). (Reprinted from (21).)
These early observations provided a context for a series of publications in 2009 that further confirmed, using 18F-FDG PET/CT, the presence of BAT in adult humans (23–26). Cypess et al. identified active brown fat in 5.4% of 1,972 patients who underwent 18F-FDG PET/CT for various diagnostic purposes (24). Tissue samples from a subset of these patients confirmed the presence of multilocular, uncoupling protein 1 (UCP1)–immunopositive adipocytes. Virtanen et al. exposed 5 healthy subjects to a cold challenge and noted enhanced 18F-FDG uptake in the supraclavicular area of all 5 subjects. Three of these subjects underwent biopsies, which showed that expression of UCP1 in the areas of increased uptake was more than 1,000 times the levels detected in white adipose tissue (WAT) (26). Another study involving healthy volunteers (10 who were lean and 14 who were obese) observed active BAT in 96% of subjects and found significantly higher BAT 18F-FDG uptake in the lean subjects (25).
Observational studies have indicated active BAT is associated with a younger age, is more prevalent in females, and occurs more often in patients with lower body mass indices (BMI; Table 2). Presence of active BAT on 18F-FDG PET/CT images has also been linked, in some studies, to lower fasting glucose levels and colder outdoor temperatures (12,27). Data from rodent studies support a decrease in BAT mass and function with increasing age (28). In humans, Yoneshiro et al. described a BAT prevalence rate of 53% in subjects 20–30 y of age and 7% in subjects 50 y of age or older (29). A large prospective study, involving cold exposure to activate BAT, confirmed that subjects with 18F-FDG PET/CT–detectable BAT were more likely to be younger and to have lower adiposity-related parameters including BMI, body fat mass, and abdominal visceral and subcutaneous fat (30).
Observations from Retrospective Analyses of Clinically Obtained Images Showing Associations Between Incidental BAT Activation and Age, Sex, BMI, Fasting Glucose Levels, and Outdoor Temperature
On the basis of retrospective analyses of thousands of 18F-FDG PET/CT images (Table 2), it appeared the prevalence of active BAT in adults was between 3% and 9% (excluding pheochromocytoma patients). However, these were all incidental cases of BAT activation discovered under nonstandardized conditions and primarily in patients with known or suspected cancer. When prospective study designs involving cold exposure interventions were used, active BAT prevalence rates increased substantially (29). The detection and assessment of active BAT in vivo using 18F-FDG PET depends on several factors including preimaging subject preparation, BAT activation technique, scanning protocols, and thresholds used to define BAT. Variations in these factors makes comparisons among studies difficult. The brown adipose reporting criteria in imaging studies (BARCIST) 1.0 is a set of guidelines proposed by a multidisciplinary group of experts intended to standardize BAT research methods and reporting to facilitate comparisons among studies (31). An important concern highlighted by the BARCIST guidelines is the type of intervention used to activate BAT. Early human BAT studies used cold challenges mainly involving exposure to ice or cold air or water (23,25). The ice and water exposure paradigms are not recommended since they may also stimulate sympathetic pain responses, which could confound the effects of cooling on BAT. Most current studies use either a fixed-temperature method or an individualized approach. A fixed-temperature method involves choosing a cooling temperature and duration that is consistently used for all participants. To maximize nonshivering thermogenesis, an individualized approach involves cooling subjects (usually with a temperature-controlled vest or whole-body suit) to just above the shivering threshold. This method is recommended for studies with heterogeneous populations and for studies assessing interventions intended to alter BAT activity or volume.
BAT BIOLOGY
BAT is unique both structurally and functionally. Compared with the larger, round adipocytes contained in WAT, brown adipocytes are smaller and polygonal in shape. BAT contains large amounts of mitochondria (in part, the source of its brown color) containing UCP1 (Supplemental Fig. 1; supplemental materials are available at http://jnm.snmjournals.org), a protein responsible for separating the mitochondrial proton gradient from ATP synthesis, resulting in thermogenesis. BAT depots are densely sympathetically innervated and highly vascularized, which facilitates the dissipation of heat and the exchange of glucose, oxygen, and nonesterified fatty acids (NEFA) (32).
Much of our understanding of BAT biology comes from the use of rodent models. In rodents, the interscapular region contains the primary BAT depot, and additional BAT depots are found in paravertebral, supraclavicular, infrascapular, inguinal, and perirenal areas. In humans, the most active BAT depots tend to be located in the supraclavicular and paravertebral regions with additional foci commonly seen in the axillary, intercostal, mediastinal, and perirenal areas. A challenge in the field is the inability to directly compare human and rodent fat pads, as discussed previously by Zhang et al. (33). Rodents experience substantially different environmental pressures than humans due to their vastly different volume-to-surface ratios, muscle mass, and fat depot perfusion. Classic experiments by Foster and Frydman demonstrated that cold exposure in rodents increases BAT blood flow by up to 20-fold, achieving a maximal rate of more than 1,000 mL/100 g/min (34). However, this rate is about 100 times greater than what has been observed in humans, which has been shown to vary between 10.0 ± 2.4 and 15.9 ± 4.9 mL/100 g/min (35,36). The limits associated with applying rodent data to humans have been problematic in the field. For example, rodent studies have clearly demonstrated that administration of β3-adrenergic agonists causes dramatic weight loss in rodents, but this effect has not been consistently duplicated in humans (37). Although the β3-receptors are clearly implicated in BAT activation in rodent studies, β2-receptors appear to be more important in humans based on very recent data (38). Exercise is another area of BAT study that seems to differ between humans and rodents. Several rodent studies have shown that exercise increases the browning of WAT in rodents, but this may not be the case in humans (39). Clearly, caution should be exercised when applying rodent data to humans.
In vivo, BAT can be absent, present and inactive, and present and activated. It is unclear whether there is an additional state in which BAT is present, but not capable of being activated immediately, but potentially activatable over time (recruitable). When the sympathetic nervous system is activated as a result of cold exposure, norepinephrine is released, which binds to adrenergic receptors (β1-, β2-, and β3-adrenoceptors) expressed on BAT cell surfaces, causing an increase in cytosolic cyclic adenosine monophosphate levels (Supplemental Fig. 2) (40). Elevated levels of catechols are likely the explanation for BAT activation and expansion in select patients with pheochromocytomas due to chronic exposure of BAT to circulating epinephrine. Subsequently, intracellular NEFA concentrations increase as a result of triglyceride lipolysis. Most likely, liberated fatty acids then bind to and activate UCP1, resulting in the extrication of the proton gradient from ATP synthesis, and thus, heat generation (41). Although intracellular triglycerides provide much of the fuel for initial BAT activation, additional substrates are needed during periods of ongoing thermogenesis, which are provided in the form of circulating glucose or fatty acids. The increased glucose accumulation seen on 18F-FDG PET does not mean that increased glucose accumulation in BAT is the sole immediate source of energy for heat generation. Indeed, Sanchez-Delgado et al. compared levels of cold-induced thermogenesis, as assessed using indirect calorimetry, with 18F-FDG PET–assessed BAT volume and activity levels and found no association between cold-induced thermogenesis and BAT glucose uptake (42). Glucose taken up within thermogenic adipocytes either undergoes glycolysis and subsequent oxidation, participates in mitochondrial anaplerosis (in the form of pyruvate) and production of reducing equivalents to maintain fatty acid oxidation, or is directed toward de novo lipogenesis and fatty acid synthesis to activate UCP1 and to fuel thermogenesis. However, the precise ratios and the dynamics of these metabolic fates remains unclear and warrants further study.
Although much of the interest in BAT has been its ability to consume glucose and contribute to net caloric balance, it has additional functions that appear to be endocrinelike in nature. In animal models, BAT transplants can cure diabetes in the transplant recipients in more than 50% of cases (43). This cure does not result solely from increased glucose consumption, but appears to be due to factors released from BAT that have systemic effects on glucose metabolism. Adipokines released from BAT, termed “BATokines,” are additional substances preferentially released by BAT versus WAT, which may have endocrine effects (Supplemental Fig. 3) (44). A primary example is fibroblast growth factor 21 (FGF21), which was among the first proposed endocrine signals acting as a BATokine, given the strong release of FGF21 by BAT under conditions of thermogenic activation (45). Increased FGF21 augments energy catabolism by promoting glucose uptake and oxidation via Glut1 expression and activation of lipolysis and reduction of fatty acid synthesis. Mild cold exposure has been shown to increase plasma FGF21 levels with BAT activation (46). BAT presence is further associated with increased levels of interleukin-6 (IL-6), insulinlike growth factor 1 (IGF-1), neureregulin 4 (NRG4), and 12,13-dihydroxy-9Z-octadecenoic acid (12,13-diHOME), as well as other endocrine factors. A full discussion of the myriad endocrine functions possibly associated with BAT is beyond this review, which is primarily focused on the imaging of BAT, but several recent reviews extensively describe this topic (4,47). It appears that even in humans, in which the BAT mass is relatively small compared with total body mass, active BAT is associated with a healthier metabolic profile. Thus, whereas BAT can help to combat caloric imbalance by consuming glucose and lipids, its most important function may be in improving the overall systemic metabolic profile via endocrine signaling.
BAT IMAGING
The discovery of active BAT in adult humans was facilitated by observations seen on 18F-FDG PET and PET/CT as discussed previously, and 18F-FDG PET remains the most commonly used method for the assessment of metabolically active BAT. 18F-Several additional imaging methods (Table 3) have been used to help quantify human BAT and explore different aspects of its function.
Human Studies of Imaging Methods Used to Identify and Quantify BAT Activity
Oxidative Metabolism
Although it is clear from both retrospective and prospective studies that active BAT (as assessed using 18F-FDG PET) is negatively correlated with obesity, understanding the extent to which this represents a contribution to overall energy expenditure requires additional information (48–51). Ouellet et al. demonstrated, using 11C-acetate PET, increases in cold-induced oxidative metabolism in BAT, but not substantially in muscle or WAT. Total energy expenditure was also associated with increases in BAT oxidative metabolism (52). Using triple oxygen dynamic PET scans (15O-H2O, 15O-CO, and 15O-O2), Muzik et al. found that oxygen extraction and metabolic rate were significantly higher in BAT-positive versus BAT-negative subjects, though BAT likely contributed less than 20 kcal/d to overall energy expenditure (53). Although that may seem like a small contribution, over time it could equate to significant caloric expenditures. Indeed, Yoneshiro et al. showed, using repeated cold exposure, negative correlations between changes in BAT activity and body fat mass (54).
Perfusion
Activation of BAT is associated with increases in tissue perfusion (34). One method for estimating the blood perfusion rate is by measuring oxygen consumption using 15O-H2O PET. Orava et al. found on cold exposure, glucose uptake in BAT increased by a factor of 12 and perfusion doubled (35). The increase in perfusion was also positively correlated with whole-body energy expenditure (r = 0.45, P = 0.021). Another commonly used perfusion tracer, 13N-ammonia, has also been shown to effectively image BAT blood flow (55). Madar et al. showed that mean 13N-ammonia SUVmax in the supraclavicular BAT of 9 subjects increased from close to 0 during a warm condition to 3.1 during cold exposure.
Several MR techniques have been used to evaluate BAT blood flow. Functional MRI studies, taking advantage of the T2-weighted blood oxygen level-dependent (BOLD) signal, have demonstrated feasibility in monitoring BAT perfusion changes associated with activation (56). During cold activation, Chen et al. calculated a mean BOLD signal increase of 10.7% in areas corresponding to active BAT on 18F-FDG PET images. A challenge with the MRI studies is the sensitivity of the MRI signals to motion, which can degrade signal quality.
Contrast-enhanced ultrasound is a method relying on the differential reflective ability of soft tissues and administered contrast agents to produce images of sound wave propagation. Flynn et al. used this method to investigate blood perfusion in cold-activated BAT and found BAT-positive subjects exhibited higher perfusion rates in supraclavicular fat than BAT-negative subjects (57). They also noted, interestingly, that the 3 subjects with the lowest BAT 18F-FDG uptake also had low BAT blood flow during a warm condition and their BAT failed to exhibit an increase in blood flow during cold exposure.
Lipid Metabolism
Several studies have demonstrated increases in the CT radio density of BAT (Supplemental Fig. 4) associated with its activation (52,58). This finding is consistent with use of intracellular lipid stores as fuel (at least initially) for thermogenesis, and as the fraction of fat in the BAT declines the HU rise closer to those of water. On the basis of the differing proton precessional frequencies in water versus fat, chemical shift water-fat MRI can be used to characterize tissue fat fraction. When this method is used in conjunction with a BAT activation procedure, the fat fraction of BAT has been shown to decrease with BAT activation, presumably due to metabolism of intracellular triglycerides or increased perfusion (59).
In rodents, a significant amount of circulating triglycerides have been shown to be extracted by BAT (32), though the contribution from NEFA uptake appears to be a relatively small fraction of total BAT metabolism during cold-induced thermogenesis compared with intracellular brown adipocyte triglycerides (60). Similarly, using 18F-fluoro-thiaheptadecanoic acid (FTHA), a fatty acid tracer, Ouellet et al. found that in humans, whereas NEFA uptake in BAT increased during cold exposure, circulating NEFAs likely contributed little to total BAT oxidative metabolism (52). These findings were supported by a subsequent study, also using 18F-FTHA, that showed although NEFA uptake was strongly correlated with daily energy expenditure (during both warm and cold conditions), it likely contributed significantly less to whole-body energy expenditure than skeletal muscle (36). NEFA uptake in BAT was significantly increased during cold exposure, and the contribution of NEFA uptake toward BAT energy expenditure was negatively (though not significantly) correlated with the quantity of stored lipids within BAT (as assessed using CT Hounsfield units). These findings indicate that circulating fatty acids are either taken up and directly oxidized, or replenish endogenous BAT triglycerides stores that have been depleted to fuel BAT thermogenesis.
OTHER BAT IMAGING TRACERS AND TECHNIQUES
Novel techniques are also being investigated that may shed light on previously unexplored aspects of BAT function. We have reported on using microwave radiometry to estimate the temperature of BAT in vivo in humans (61). Although this technique is feasible and was able to show population differences, it was slow, did not generate images (except as count densities displayed on an anatomic format), and was not clearly suitable for use in individual patient measurements due to variance. Thermography has similar limitations, although possibly more promise (62). The challenges with thermography include its visualization of very superficial tissues, as opposed to deeper structures, which include BAT.
BAT sympathetic innervation has been targeted using several radiotracers. Although not yet used in a prospective human trial, Hadi et al. reviewed 18F-DOPA images of patients with suspected pheochromocytomas and found incidental BAT uptake in 17.9% of patients (22). A highly selective norepinephrine transporter ligand, 11C-(S,S)-11C-O-methylreboxetine (MRB), was found by Hwang et al. to show very similar levels of BAT uptake under both cold-activated and thermoneutral conditions (63). Muzik et al. investigated the relationship between sympathetic innervation and cold-activated levels of BAT using 11C-meta-hydroxyephedrin (HED; Fig. 4) and 18F-FDG (64). They showed that the retention index of 11C-HED is a useful predictor of levels of cold-activated BAT.

11C-HED PET tracer uptake in supraclavicular BAT during thermoneutral condition (11C-HED rest, upper row), during cold exposure (11C-HED cold, middle row), and 18F-FDG tracer uptake during cold exposure (18F-FDG cold, bottom row) in subject with cold-activated BAT (A) and subject without cold-activated BAT (B). (Reprinted from (64).)
As heat production in BAT is accomplished by circumventing the ATPase-facilitated proton transfer across the mitochondrial inner membrane, the most direct measure of BAT activity should be quantifying the mitochondrial membrane potential. The PET imaging agent 18F-fluorobenzyltriphenyl phosphonium (18F-FBnTP; Fig. 5) is an indicator of mitochondrial membrane potential, which may be useful for measuring true BAT volume (i.e., activatable and “dormant” BAT) as well as BAT thermogenic activity (65).
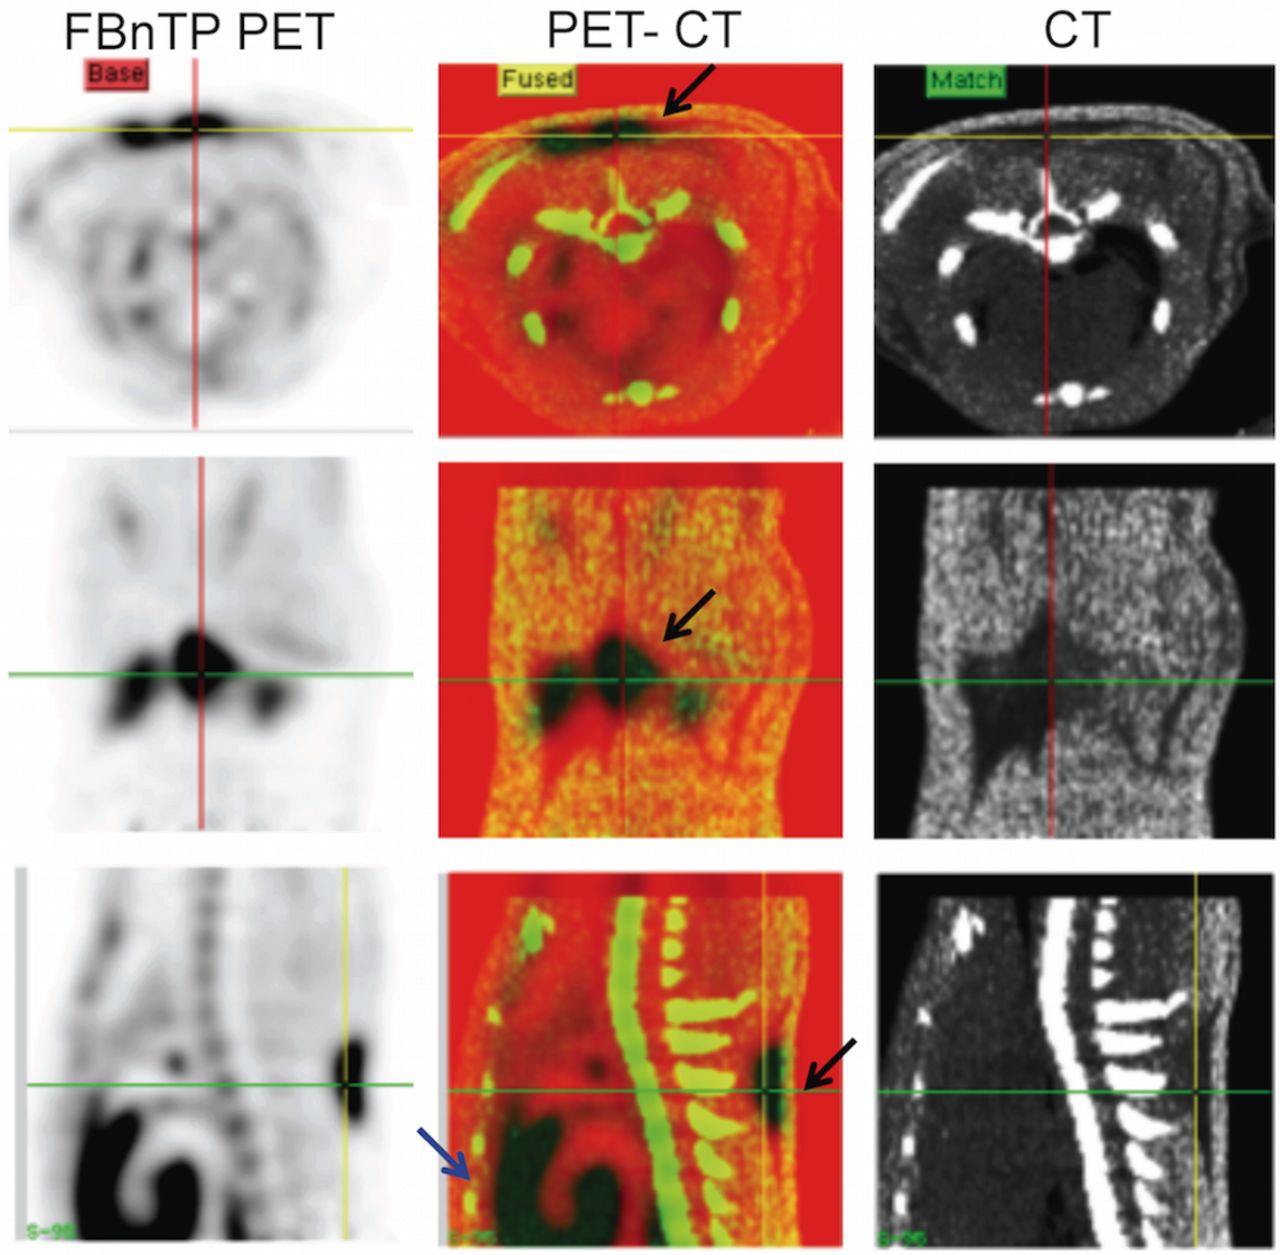
18F-FBnTP uptake in interscapular brown fat depots at room temperature. PET/CT images in transverse (upper panel), coronal (mid panel), and sagittal (lower panel) view, acquired in a rat at room temperature. Increased 18F-FBnTP uptake in the interscapular area is confined to CT regions of low Hounsfield units (black arrows). Note the strong uptake of 18F-FBnTP in BAT, similar to that seen in heart (blue arrow). (Reprinted with permission of (65).)
The endocannabinoid system is involved in the control of glucose and lipid metabolism and activation of cannabinoid type 1 receptors (CB1R) and is known to inhibit energy expenditure and thermogenesis. CB1R density in the brain has been quantified using a CB1R antagonist radioligand, (3R,5R)-5-(3-(18F-fluoromethoxy)phenyl)-3(((R)-1-phenylethyl)amino)-1-(4-(trifluoromethyl)-phenyl)pyrrolidin-2-one (18F-FMPEP-d2). Eriksson et al. showed in vivo binding of 18F-FMPEP-d2 to BAT in rodents (66). Subsequently, Lahesmaa et al. showed elevated 18F-FMPEP-d2 BAT uptake (Fig. 6), indicating increased CB1R density, in lean men after cold activation, whereas overweight men exhibited decreased 18F-FMPEP-d2 BAT uptake (67).

Imaging with 18F-FMPEP-d2 PET/CT in a thermoneutral (A) and cold (B) conditions and with 18F-FDG PET/MRI in a cold condition (C). Coronal PET images from 1 lean study subject with arrows indicating supraclavicular BAT. (Reprinted with permission of (67).)
Because of an abundance of translocator proteins (TSPO) on the outer membrane of mitochondria, 11C-peripheral benzodiazepine receptor-28 (11C-PBR28) has been shown potentially useful for imaging BAT in thermoneutral conditions (68). This PET tracer can be challenging to work with; however, given its sensitivity to genotype. A recent study shows 11C-labeled biotin accumulates significantly in BAT (69). Biotin is taken up by cells via the sodium-dependent multivitamin transporter, a transmembrane protein highly expressed in the gastrointestinal tract, liver, kidneys, heart, and also cancer cells. Biotin-dependent enzymes are used for lipolysis, glucose metabolism, and fatty-acid synthesis, which may explain the strong BAT uptake of biotin in rodents described by Bongarzone et al. (69). As BAT is known to take up glucose and fatty acids under thermoneutral conditions, 11C-biotin may be useful for imaging unstimulated BAT.
INTERVENTIONAL APPROACHES
Obesity rates in the United States and around the world continue to rise, posing significant risks to public health. BAT represents a promising potential target for the treatment of obesity and related metabolic disorders. Exposure to cold is the most potent activator of BAT and has thus been increasingly assessed as a therapy (54,70). Exercise and pharmacologic approaches have also been evaluated (70,71). A search of ClinicalTrials.gov found 14 active projects currently listed (Supplemental Table 1; supplemental materials are available at http://jnm.snmjournals.org), which aim to evaluate interventions intended to increase BAT activity or mass. Most of these studies (11/14), as well as those already completed, use 18F-FDG PET to monitor changes in BAT. To effectively assess changes in BAT using this method, an understanding of the test–retest repeatability of 18F-FDG PET/CT in the assessment of active BAT is necessary. We studied the repeatability of 18F-FDG uptake in BAT using 2 different cold-activation approaches. Eleven volunteers were cooled by placing their feet on a block of ice intermittently while sitting in a cooled room followed by an 18F-FDG PET/CT scan (72). This procedure was then repeated within 14 d. BAT metabolic volume and SUVmax were found to be significantly correlated between imaging sessions. In a separate study using an individualized cooling protocol involving a full-body water perfusion suit, BAT 18F-FDG uptake metrics extracted from both PET/CT and PET/MR images (Supplemental Fig. 5) showed strong repeatability (73). Though 18F-FDG PET imaging of BAT appears less repeatable compared with 18F-FDG PET imaging of tumors, these studies show it is a useful modality with the clear potential for monitoring BAT response to interventions.
CONCLUSION
Molecular imaging with 18F-FDG PET/CT unexpectedly established BAT to be present and active/activatable in many adults in addition to its expected presence in children. In the clinical practice of nuclear medicine, suppressing BAT activity on 18F-FDG PET with appropriate patient preparation is important to avoid false-positive or false-negative PET scans, particularly in very young patients. BAT biology is complex, but preclinical studies have shown that chronic activation of BAT can have favorable effects on glucose and lipid metabolic status and that transplantation of BAT in preclinical models can ameliorate diabetes. Not all of these effects are due to consumption of glucose or lipids by the BAT but appear related to endocrine activity of BAT, effects which are still being defined. Anatomic and molecular imaging tools of a variety of types have been used to assess the presence, activity, and quantity of BAT and to help dissect its complex metabolism. These tools are essential to advancing research in this area, research focused on increasing BAT activity. Although imaging approaches using nonionizing radiation are of great interest, especially for longitudinal studies, 18F-FDG PET/CT currently remains the gold standard method for assessment of the presence, activity and volume of active BAT (33).
KEY POINTS
QUESTION: How has molecular imaging influenced our understanding of human BAT?
PERTINENT FINDINGS: Molecular imaging with 18F-FDG and other radiotracers has established that BAT is present, often active or activatable, and its presence is related to metabolic health.
IMPLICATIONS FOR PATIENT CARE: Identification of BAT as a previously unrecognized endocrine-like tissue opens therapeutic opportunities for weight loss and improvement of glucose and lipid profiles.
DISCLOSURE
No potential conflict of interest relevant to this article was reported.
- © 2021 by the Society of Nuclear Medicine and Molecular Imaging.
REFERENCES
- 1.↵
- 2.↵
- 3.↵
- 4.↵
- 5.↵
- 6.↵
- 7.↵
- 8.↵
- 9.↵
- 10.↵
- 11.↵
- 12.↵
- 13.
- 14.↵
- 15.↵
- 16.↵
- 17.↵
- 18.↵
- 19.
- 20.↵
- 21.↵
- 22.↵
- 23.↵
- 24.↵
- 25.↵
- 26.↵
- 27.↵
- 28.↵
- 29.↵
- 30.↵
- 31.↵
- 32.↵
- 33.↵
- 34.↵
- 35.↵
- 36.↵
- 37.↵
- 38.↵
- 39.↵
- 40.↵
- 41.↵
- 42.↵
- 43.↵
- 44.↵
- 45.↵
- 46.↵
- 47.↵
- 48.↵
- 49.
- 50.
- 51.↵
- 52.↵
- 53.↵
- 54.↵
- 55.↵
- 56.↵
- 57.↵
- 58.↵
- 59.↵
- 60.↵
- 61.↵
- 62.↵
- 63.↵
- 64.↵
- 65.↵
- 66.↵
- 67.↵
- 68.↵
- 69.↵
- 70.↵
- 71.↵
- 72.↵
- 73.↵
- 74.
- 75.
- 76.
- 77.
- 78.
- 79.
- 80.
- 81.
- 82.
- 83.
- 84.
- 85.
- 86.
- 87.
- 88.
- 89.
- 90.
- 91.
- 92.
- 93.
- 94.
- 95.
- 96.
- 97.
- 98.
- 99.
- 100.
- 101.
- 102.
- 103.
- 104.
- Received for publication September 28, 2020.
- Accepted for publication December 22, 2020.


