


Visual Abstract

Abstract
Non–catechol-based high-affinity selective dopamine D1 receptor (D1R) agonists were recently described, and candidate PET ligands were selected on the basis of favorable properties. The objective of this study was to characterize in vivo in nonhuman primates 2 novel D1R agonist PET radiotracers, racemic 18F-MNI-800 and its more active atropisomeric (−)-enantiomer, 18F-MNI-968. Methods: Ten brain PET experiments were conducted with 18F-MNI-800 on 2 adult rhesus macaques and 2 adult cynomolgus macaques, and 8 brain PET experiments were conducted with 18F-MNI-968 on 2 adult rhesus macaques and 2 adult cynomolgus macaques. PET data were analyzed with both plasma-input–based methods and reference-region–based methods. Whole-body PET images were acquired with 18F-MNI-800 from 2 adult rhesus macaques for radiation dosimetry estimates. Results: 18F-MNI-800 and 18F-MNI-968 exhibited regional uptake consistent with D1R distribution. Specificity and selectivity were demonstrated by dose-dependent blocking with the D1 antagonist SCH-23390. 18F-MNI-968 showed a 30% higher specific signal than 18F-MNI-800, with a nondisplaceable binding potential of approximately 0.3 in the cortex and approximately 1.1 in the striatum. Dosimetry radiation exposure was favorable, with an effective dose of about 0.023 mSv/MBq. Conclusion: 18F-MNI-968 has significant potential as a D1R agonist PET radiotracer, and further characterization in human subjects is warranted.
Dopamine D1 receptors (D1Rs) are the most abundant dopamine receptor subtype in the brain and the primary subtype in the prefrontal cortex (1,2) and are exclusively found postsynaptically on dopamine-receptive neurons (medium spiny neurons in the striatum and pyramidal neurons in the prefrontal cortex). Despite its extensive brain distribution, D1R interest has dropped behind other subtypes, especially D2 receptors, partly because of the lack of D1R-selective agents that would facilitate a greater understanding of this target.
Dihydrexidine, the first high-affinity catechol-based selective full D1R agonist, demonstrated the therapeutic potential of D1R-selective ligands in schizophrenia (alleviation of cognitive deficit and negative symptoms (3)) and Parkinson disease (antiparkinsonian action in MPTP-treated primate model (4)). The recent introduction of non–catechol-based high-affinity selective D1R agonists has revived interest in this target (5–9).
The development of in vivo imaging techniques has proven extremely valuable to elucidate disease pathology, disease progression, and advancement of target-specific therapies. Several PET radiotracers for D1R have been developed, mainly the antagonists 11C-NNC-112 (10), 11C-SCH-23390 (11), and 11C-A-69024 (12); the partial agonist 11C-N-methyl-NNC 01-0259 (13); and the agonist 11C-SKF 82957 (14). However, 11C-SCH-23390 and 11C-NNC-112 suffer from selectivity against 5-HT2a (15), and 11C-N-methyl-NNC 01-0259 and 11C-SKF 82957 have brain-penetrating radiometabolites (13,14). Moreover, D1Rs exhibit both high- and low-affinity states, with agonists preferentially binding to the high-affinity active state whereas antagonists do not discriminate between the 2 states. Therefore, development of a full D1R agonist PET tracer could provide important in vivo functional information and be a useful imaging tool to assess D1R agonists.
Two novel D1R agonists from a noncatechol chemotype discovered by Pfizer were selected on the basis of favorable properties as potential PET ligands. The objective of this study was to characterize these 2 D1R agonist PET radiotracers, racemic 18F-MNI-800 and the atropisomeric (−)-enantiomer 18F-MNI-968, in vivo in nonhuman primates (NHP). We assessed their brain distribution and kinetic profile, the specificity of the signal in preblocking studies with a D1R antagonist and a partial agonist, test–retest variability, and radiation dosimetry estimates of 18F-MNI-800.
MATERIALS AND METHODS
In Vitro Pharmacology and PET Properties of Novel Noncatechol D1R Agonists
The identification of a suitable PET ligand was guided by a set of PET properties to find a D1R-selective agonist that resides within favorable physicochemical property space defined by the central nervous system PET multiparameter optimization score (>3) (16) and shows potent binding affinity to D1R (Bmax/Kd > 10), high passive permeability (RRCK Papp AB > 5 × 10⁻⁶cm/s), low p-glycoprotein efflux (Pgp) efflux (MDR1 BA/AB ≤ 2.5), and a sufficient fraction unbound in brain (cFu_b >0.05) for low nonspecific binding.
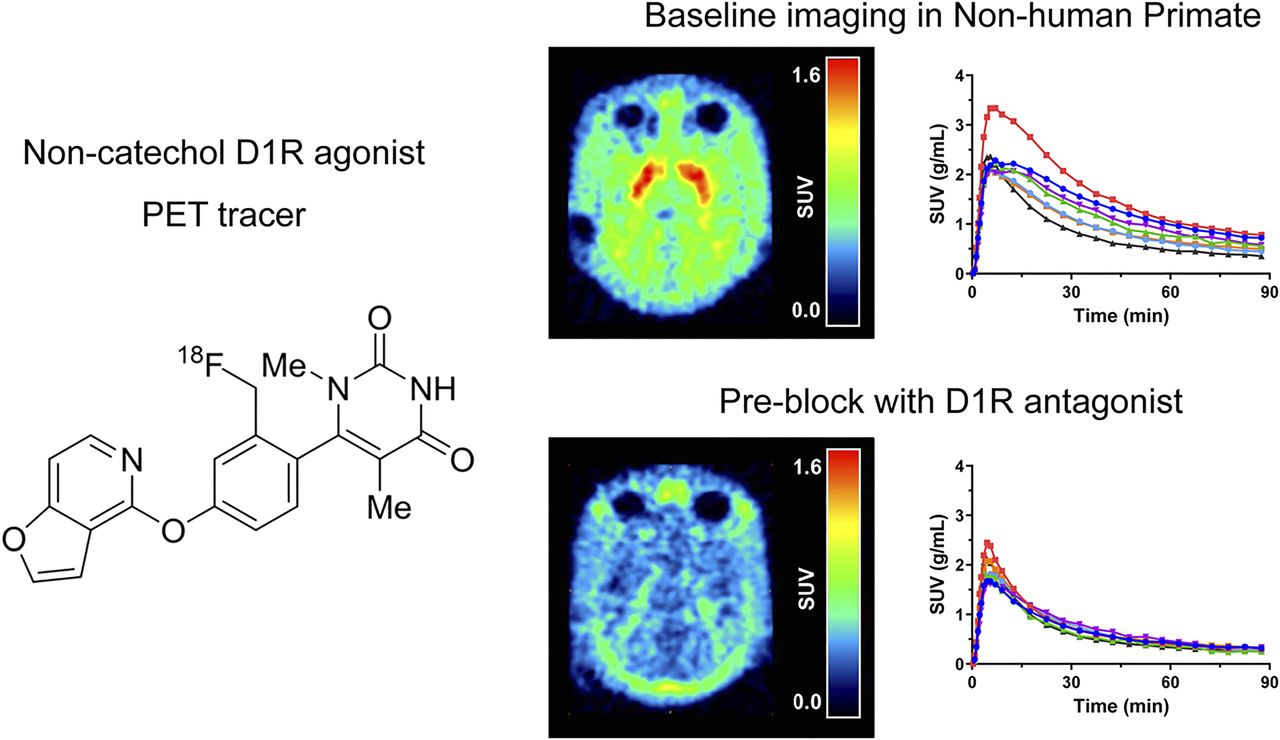
Initially, racemate MNI-800 (PK-84677) and subsequently its (−)-enantiomer MNI-968 (PF-0110), a noncatechol D1R agonist from a chemotype developed by Pfizer (7), emerged as a promising PET ligand lead with a benzyl fluoride moiety for late-stage 18F radiolabeling (Fig. 1; Supplemental Scheme 1; supplemental materials are available at http://jnm.snmjournals.org).
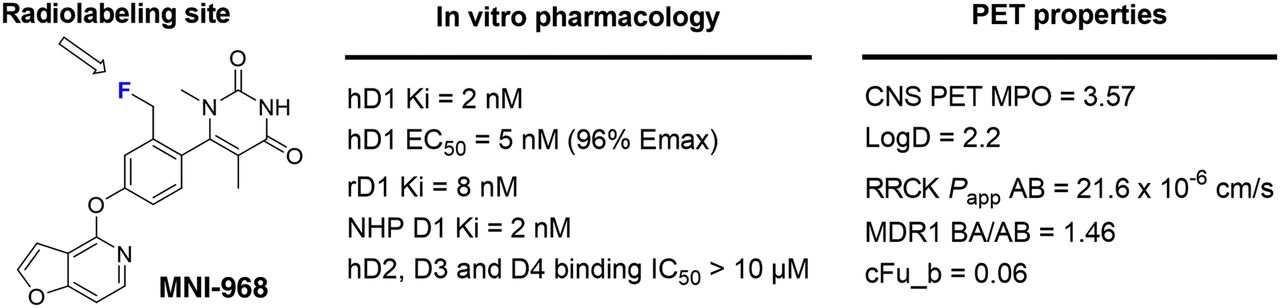
Profile of D1R agonist PET ligand lead MNI-968. AB = apical to basolateral; BA = basolateral to apical; CNS = central nervous system; cFub = fraction unbound in brain; EC50 = half-maximal effective concentration; Emax = maximal effect; hD1 = human D1; hD2 = human D2; IC50 = half-maximal inhibitory concentration; Ki = inhibition constant; MDR1 = multi-drug resistance 1; MPO = multiparameter optimization; rD1 = rat D1; Papp = apparent permeability; RRCK = Ralph Russ canine kidney assay.
Indeed, MNI-968 has a potent binding affinity to human D1R (Ki = 2 nM), and minimal species differences in rat (Ki = 8 nM) and NHP (Ki = 2 nM). Given a D1R Bmax in human and NHP striatum of approximately 52 pmol/g tissue (∼52 nM assuming 100 mg of protein/g of tissue) (17), a desired Bmax/Kd of more than 10 corresponds to a binding affinity of less than 5 nM, indicating that MNI-968 meets this affinity requirement. Moreover, unlike other known D1R antagonist radiotracers (SCH-23390 and NNC-112), MNI-968 is a potent D1R functional agonist with an EC50 of 5 nM and 96% Emax. Finally, MNI-968 showed selectivity for D1R over other dopamine receptors, with no appreciable binding to human D2, D3, and D4 receptors (IC50 > 10 μM).
In addition to its favorable in vitro pharmacology profile, MNI-968 met all the PET ligand property parameters: high central nervous system PET multiparameter optimization score (3.57), good passive permeability (RRCK Papp AB = 21.6 × 10⁻⁶ cm/s), low p-glycoprotein efflux (MDR1 BA/AB = 1.46), and a reasonable fraction unbound in brain (cFu_b = 0.06), suggesting a low risk of nonspecific binding.
Details on the synthesis of MNI-968 and MNI-800 are provided in the supplemental materials.
Radiochemistry of 18F-MNI-800 and 18F-MNI-968
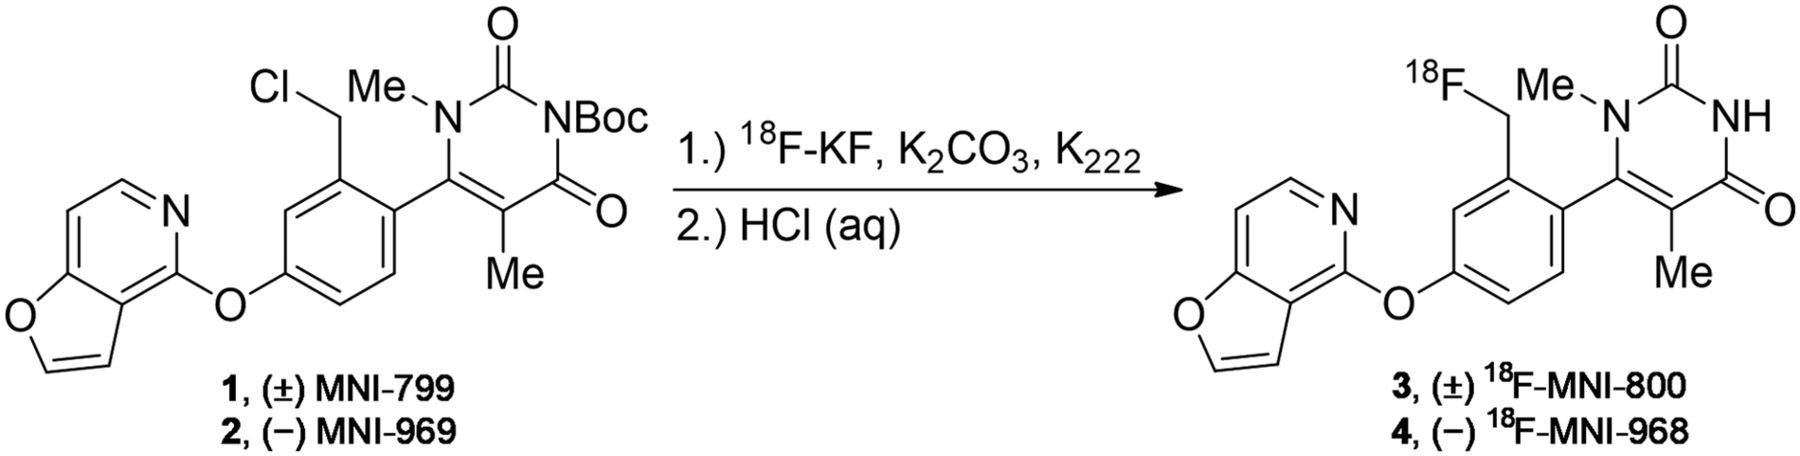
All 18F-MNI-800 and 18F-MNI-968 radiolabeling reactions were performed in a GE Healthcare TRACERlab FX-FN automated synthesis module using the Boc-protected benzyl chloride precursor (Fig. 2, MNI-799 or MNI-969).

Radiosynthesis of 18F-MNI-800 and 18F-MNI-968.
For 18F-MNI-800, the 2-step, 1-pot production with the racemic precursor MNI-799 afforded sufficiently high yields (15%–35%) with high radiochemical purity (>95%), chemical purity (<0.20 μg/mL), and specific activity (>220 GBq/μmol).
For 18F-MNI-968, it proved too difficult to confidently control the undesired racemization of the enantiopure precursor MNI-969, and the procedure was modified. First, an in-process chiral high-performance liquid chromatography separation step with inclusion of a chiral column before the C18 reverse-phase column provided sequential separation of the desired atropisomer followed by mass purification. Second, the radiolabeling solvent was changed to acetonitrile because dimethyl sulfoxide was not compatible with the chiral stationary phase. Beyond these 2 changes, the 18F-MNI-968 process was similar to the process for 18F-MNI-800 and provided the desired product in expected lower yields (5%–15%) and an acceptable chemical profile (radiochemical purity > 95%, chemical purity < 0.10 μg/mL, and specific activity > 75 GBq/μmol). Atropisomeric purity was assessed to confirm enantiopurities of more than 99% at the end of synthesis, throughout storage in solution, and before injection.
Details on the radiosynthesis of 18F-MNI-800 and 18F-MNI-968 are provided in the supplemental materials.
Animals
All experiments were conducted in accordance with the U.S. Public Health Service’s Policy on Humane Care and Use of Laboratory Animals and with institutional approval (Yale PET Center and Charles River Laboratories). Adult rhesus macaques (Macaca mulatta, 2 females [7.6 ± 1.4 kg, NHPs A and B] and 1 male [19.6 ± 3.0 kg, NHP C]) and cynomolgus macaques (Macaca fascicularis, 3 males, 5.0 ± 0.4 kg, NHPs D–F) were studied. The animals were anesthetized with intramuscular ketamine and given glycopyrrolate to reduce secretions, transferred to the camera, and intubated for continuous anesthesia with approximately 2.5% isoflurane. Radiotracer was injected 2 h after administration of anesthetics to allow for stabilization of the animals’ physiology. Body temperature was maintained by a heated water blanket and monitored with a rectal thermometer.
Blocking Agent Preparation and Administration
SCH-23390 (R(+)-SCH-23390 hydrochloride; Sigma-Aldrich) and PF-2562 (8,9) are a potent, selective D1R antagonist and a partial agonist, respectively. SCH-23390 was dissolved in normal saline. PF-2562 was dissolved in 5% ethanol, 5% Cremophor (BASF Corp.), and 18.5% sulfobutylether-β-cyclodextrin in sterile water.
Receptor occupancy experiments were performed with 18F-MNI-800 and 4 doses of SCH-23390 (0.03, 0.1, 0.2, and 0.5 mg/kg) administered intravenously over a 20-min period beginning 25 min before the radiotracer injection, and with 18F-MNI-968 and 1 dose of PF-2562 in duplicate (1.2 mg/kg total dose) administered intravenously over a 120-min period beginning 30 min before tracer injection (bolus of 0.121 mg/kg/min for 3 min followed by infusion of 0.007 mg/kg/min for 117 min). Plasma samples were taken at several time points during each PET scan.
Brain PET Studies
PET scans were performed on a Focus 220 microPET camera (Siemens Healthcare Molecular Imaging) after intravenous bolus administration of 18F-MNI-800 (170.5 ± 16.5 MBq, 0.28 ± 0.22 μg) or 18F-MNI-968 (158.0 ± 29.1 MBq, 0.47 ± 0.22 μg). Ten scans were done with 18F-MNI-800, and 8 scans were done with 18F-MNI-968 (Table 1). Test and retest scans were separated by 2 wk for 18F-MNI-800 and 4 mo for 18F-MNI-968. The dynamic series were reconstructed using filtered backprojection with corrections for random, scatter, and attenuation.
Summary of Scans with 18F-MNI-800 or 18F-MNI-968
Arterial Input Function
After tracer administration, radial artery blood samples were collected over 2 h. Radioactivity in whole blood and plasma was measured in all samples. Radiometabolites were measured in a subset of samples by reverse-phase high-performance liquid chromatography performed on a Phenomenex Luna C18(2) (10 × 250 mm, 10 μm) at a flow rate of 4 mL/min. The mobile phase consisted of a mixture of methanol/water with 0.2% triethylamine in a 65/35 ratio. Plasma samples were processed by acetonitrile denaturation, and the plasma protein binding free fraction (fp) was measured by ultrafiltration (Centrifree; Millipore).
Image Processing
PET images were analyzed in PMOD, version 3.609 (PMOD Technologies), and were motion-corrected frame by frame when necessary. The initial PET images (15 min) were averaged and aligned onto a rhesus or cynomolgus structural T1-weighted MRI template, and the transformation matrix was applied to the whole PET series. A volume-of-interest atlas (including the caudate, putamen, globus pallidus, nucleus accumbens, thalamus, cortical regions, and cerebellum) was applied to the PET series in MRI rhesus or cynomolgus template space to extract the regional time–activity curves. Curves were expressed in SUV by normalizing the activity concentration by the injected dose and animal body weight.
Kinetic Modeling and Analysis
Time–activity curves were analyzed with 1- and 2-tissue-compartment (2T) models (18) and Logan graphical analysis (LGA) (19) using the arterial plasma input function corrected for radiometabolites to derive the volume of distribution (VT) and the influx rate constant K1 in each region. The nondisplaceable binding potential (BPND) was estimated using the cerebellum as a reference region: BPND = VT/VND – 1, VT and VND being the distribution volumes in the target region (specific and nondisplaceable binding) and reference region (nondisplaceable binding), respectively (20). In addition, BPND was directly derived from the simplified reference tissue model (SRTM) (21) and noninvasive LGA (NI-LGA) (19) with the cerebellum as a reference region. All kinetic analyses were performed using PMOD. Test–retest variability for VT and BPND was estimated as absolute (test − retest)/average (test + retest).
The D1R occupancy (Occ) produced by SCH-23390 or PF-2562 was determined as the percentage change in BPND:  . The SCH-23390 plasma-occupancy curves for the striatum (putamen and caudate) were fitted in Prism (version 6.01; GraphPad Software) with a single specific binding site model:
  , where Occmax is the maximum occupancy; EC50 is the half-maximal effective concentration, which represents the SCH-23390 plasma level for 50% occupancy; and C represents the SCH-23390 average plasma level during the scan.
18F-MNI-800 Whole-Body PET Studies
Two adult rhesus monkeys (Macaca mulatta), 1 male and 1 female, were used for whole-body PET imaging from head to mid thigh over 4 h on a Biograph mCT PET/CT camera (Siemens Healthcare Molecular Imaging) after intravenous bolus injection of 18F-MNI-800 to determine the biodistribution and estimate absorbed radiation doses.
PET images were imported into PMOD, and volumes of interest were drawn on source organs. Absorbed radiation dose and effective dose (International Commission on Radiological Protection publication 60) were estimated with OLINDA/EXM software, version 1.0 (22), according to the male or female model. The gastrointestinal model of International Commission on Radiological Protection publication 30 was used with the assumption that activity entered the gastrointestinal tract through the small intestine (fraction of activity entering the intestine was estimated as the highest fraction encountered in the intestinal area).
RESULTS
Plasma Analysis
High-performance liquid chromatography analysis of 18F-MNI-800 and 18F-MNI-968 arterial plasma revealed 1 major radiometabolite and 1 minor metabolite eluting just after the first one (whose contribution remained small throughout the study), with both metabolites more polar than the parent compound. No difference was observed between rhesus and cynomolgus macaques, and the results were pooled across the 2 species. 18F-MNI-800 and 18F-MNI-968 showed similar moderate metabolic profiles, with about 60%–70% and 40%–50% of intact parent remaining at 30 and 120 min after injection, respectively (Fig. 3). Plasma parent fp measured by ultrafiltration was 13.4% ± 1.3% (n = 4) for 18F-MNI-800 and 13.5% ± 1.5% (n = 4) for 18F-MNI-968.
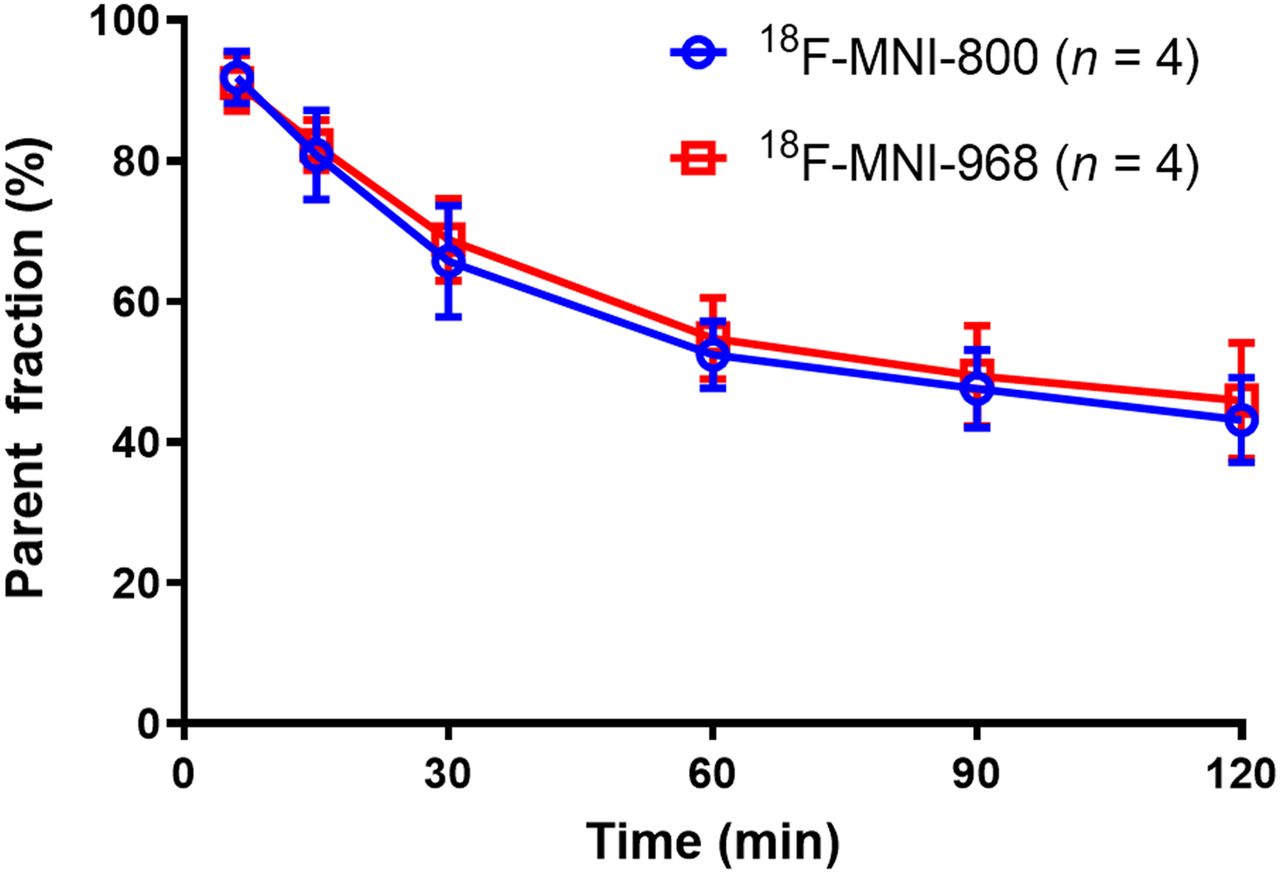
Parent fraction profile in arterial plasma after intravenous administration of 18F-MNI-800 (mean ± SD, n = 4) or 18F-MNI-968 (mean ± SD, n = 4).
Brain Uptake Distribution and Time–Activity Curves
Representative average 18F-MNI-968 and 18F-MNI-800 PET images in a rhesus macaque at baseline showed the highest uptake in the striatum, consistent with known D1R distribution (Fig. 4, left). The 18F-MNI-800 PET image after a SCH-23390 preblock (0.5 mg/kg) demonstrated almost complete saturation. 18F-MNI-968 and 18F-MNI-800 time–activity curves at baseline and after a SCH-23390 (0.5 mg/kg) or PF-2562 (1.2 mg/kg) preblock are presented in Figure 4 (right) in the same rhesus macaque. Both 18F-MNI-968 and 18F-MNI-800 readily entered the brain, with SUVpeak at 5–10 min after injection. The signal was highest in the putamen and caudate nucleus, followed by the globus pallidus and nucleus accumbens, with the lowest uptake consistently found in the cerebellum. Clear blocking of 18F-MNI-800 or 18F-MNI-968 uptake was seen after preblocking with SCH-23390 (0.5 mg/kg, occupancy of ∼85%) or PF-2562 (1.2 mg/kg, occupancy of ∼40%), respectively. Higher uptake was also observed for 18F-MNI-968 than for 18F-MNI-800, particularly in the putamen and caudate nucleus, whereas a similar profile was maintained in the cerebellum.
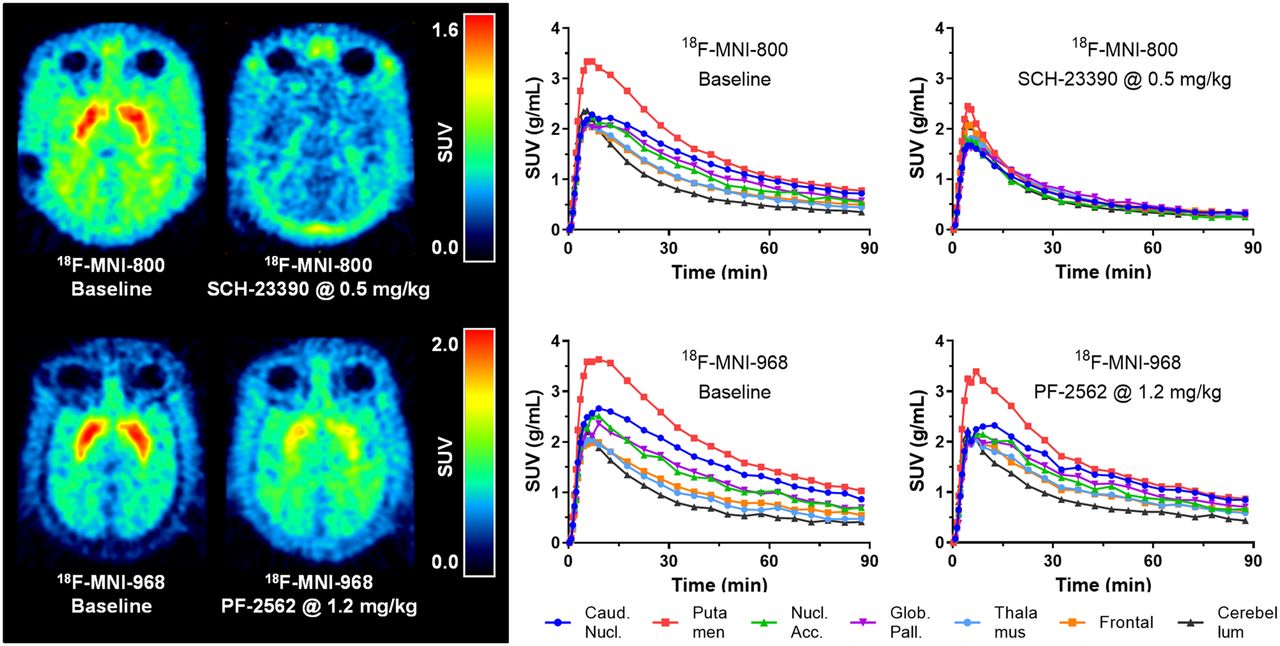
(Left) Average PET images from 30 to 90 min after injection for rhesus macaque (NHP A) in transverse plane of 18F-MNI-800 at baseline and after dosing with SCH-23390 at 0.5 mg/kg (occupancy of ∼85%) and of 18F-MNI-968 at baseline and after dosing with PF-2562 at 1.2 mg/kg (occupancy of ∼40%). (Right) Time–activity curves in some brain regions for same rhesus macaque for studies with 18F-MNI-800 and 18F-MNI-968. Caud. Nucl. = caudate nucleus; Glob. Pall. = globus pallidus; Nucl. Acc. = nucleus accumbens.
Kinetic Analysis
2T was favored for both 18F-MNI-800 and 18F-MNI-968 data over 1 tissue compartment based on the Akaike information criterion. Typical 2T and SRTM fits and Logan plots (LGA with t* = 15 min, and NI-LGA with t* = 10 min) are provided in Figure 5 for a baseline study in a rhesus macaque with 18F-MNI-968. SRTM determined k′2 to be 0.17 ± 0.04 min−1 (n = 4) for 18F-MNI-800 and 0.16 ± 0.02 min−1 (n = 5) for 18F-MNI-968, and these SRTM estimates of k′2 were used for the NI-LGA fit.
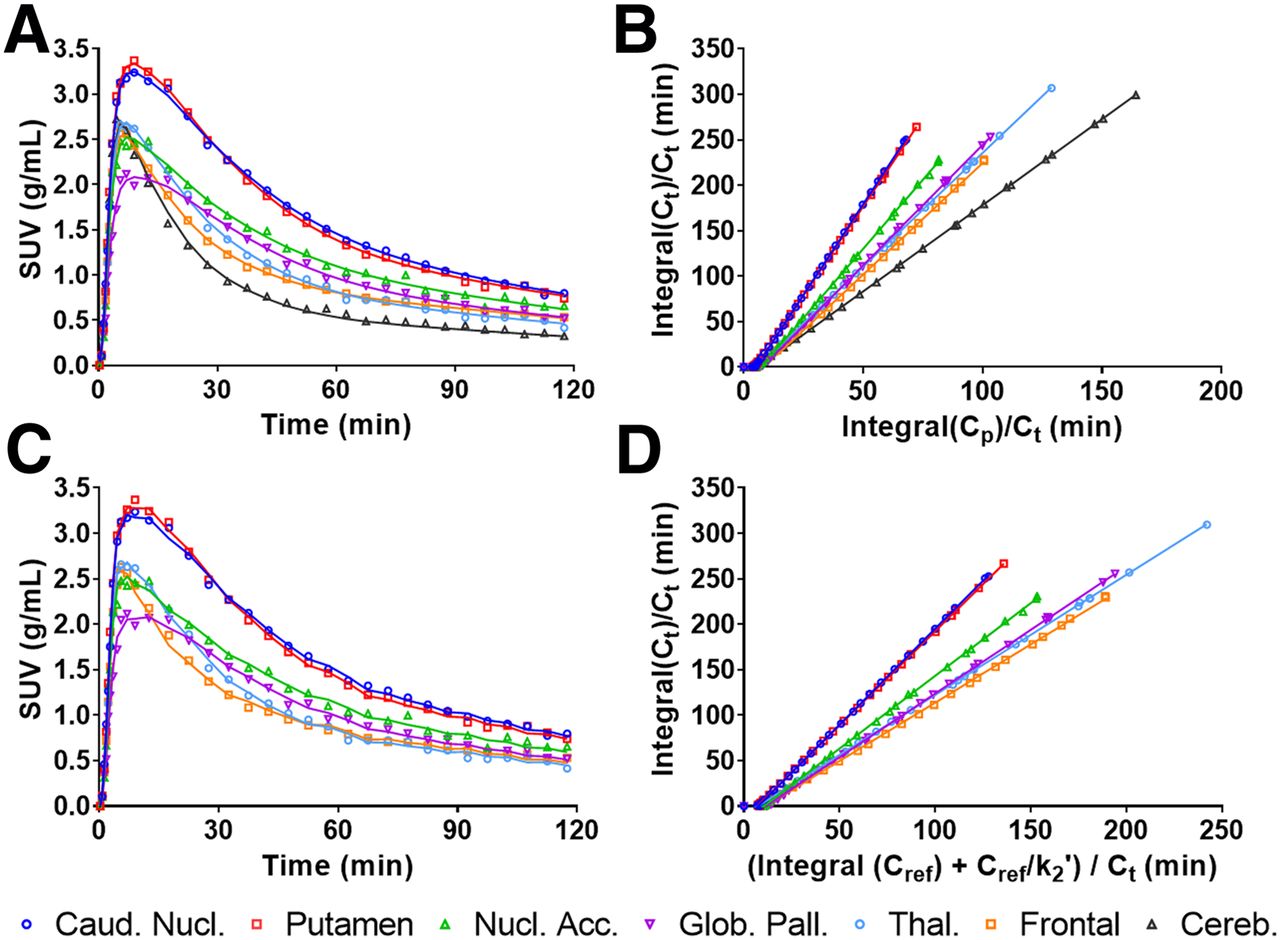
(A and C) Representative time–activity curves at baseline for rhesus macaque (NHP B) in some brain regions after bolus injection of 18F-MNI-968, showing 2T compartment model fits (A) and SRTM fits (C). (B and D) Graphical analysis with LGA with plasma input function (t* = 15 min) (B) and NI-LGA with reference region input function (t* = 10 min) (D). Caud. Nucl. = caudate nucleus; Cp = activity concentration in plasma; Cref = activity concentration in reference region; Ct = activity concentration in region of interest; Glob. Pall. = globus pallidus; Nucl. Acc. = nucleus accumbens; Thal. = thalamus.
A within-animal comparison (n = 2) between 18F-MNI-800 and 18F-MNI-968 VT estimates (2T model) is shown in Figure 6A and indicates a higher specific signal for 18F-MNI-968 (negative y-intercept) and the same target/Bmax for both tracers (linearity of the relationship) (23). Since the fp was similar for 18F-MNI-800 and 18F-MNI-968, the slope corresponds to the in vivo affinities ratio and predicts a Kd about 1.3 times higher for 18F-MNI-800 (23). Furthermore, VT in the cerebellum was 1.83 ± 0.06 mL/cm3 for 18F-MNI-800, compared with 1.87 ± 0.01 mL/cm3 for 18F-MNI-968, demonstrating a similar nondisplaceable signal for both tracers, with a relationship with BPND (2T model) for the within-animal studies:  .
.
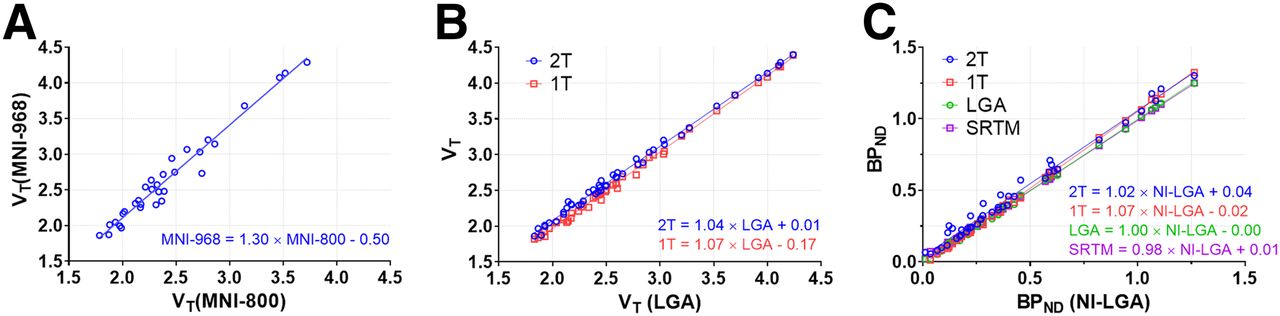
(A) Within-animal comparison (n = 2) of 18F-MNI-800 and 18F-MNI-968 2T VT estimates. (B) Comparison of 18F-MNI-968 VT estimates across models (n = 3). (C) Comparison of 18F-MNI-968 BPND estimates across models (n = 3). 1T = 1 tissue compartment.
Figures 6B and 6C compare VT and BPND across methods for 18F-MNI-968, demonstrating very good agreement between the different estimates (R2 = 0.99), in particular for BPND between plasma-based and reference region–based methods, with points aligning almost on the identity line. Similar results were obtained for 18F-MNI-800 (data not shown). A summary of VT and BPND for the different methods is provided for a subset of regions in Table 2 for 18F-MNI-800 (n = 4) and in Table 3 for 18F-MNI-968 (n = 3 for 2T and LGA, and n = 5 for SRTM and NI-LGA). Additional kinetic parameters for 2T are provided in Supplemental Tables 1 and 2. VT ranged from approximately 1.9 ± 0.1 mL/cm3 in the cerebellum (similar estimates for both tracers) to approximately 3.7 ± 0.3 mL/cm3 and 4.3 ± 0.2 mL/cm3 in the putamen for 18F-MNI-800 and 18F-MNI-968, respectively. BPND ranged from approximately 0.2 in the cortex to 0.9 in the putamen for 18F-MNI-800, and from approximately 0.3 in the cortex to 1.1–1.2 in the putamen for 18F-MNI-968, confirming an average specific signal higher by approximately 30%. K1 (2T model) was similar across regions, animals, and tracers, with K1 = 0.23 ± 0.03 mL⋅cm−3⋅min−1 for 18F-MNI-800 and K1 = 0.27 ± 0.06 mL⋅cm−3⋅min−1 for 18F-MNI-968 (Supplemental Tables 1 and 2).
18F-MNI-800 VT and BPND in Pooled Rhesus and Cynomolgus Macaques
18F-MNI-968 VT and BPND in Pooled Rhesus and Cynomolgus Macaques
Test–retest variability was assessed in a limited number of repeat studies for 18F-MNI-800 (n = 2) and 18F-MNI-968 (n = 1). The results are summarized in Supplemental Tables 3 and 4 for the different methods. Variability in VT estimates was low in all regions and both tracers (<10%), whereas that of BPND in the striatum remained low for 18F-MNI-800 (<5%) and somewhat higher for 18F-MNI-968 (∼15%), for which, however, test and retest scans were separated by 4 mo.
SCH-23390 Occupancy Studies
Preblocking with SCH-23390 increased the measured occupancies in a dose-dependent fashion and reduced the 18F-MNI-800 uptake to levels close to those in the cerebellum at the highest dose tested (Fig. 4), supporting the specificity and selectivity of 18F-MNI-800 for D1R, with measured occupancies of approximately 85% and 60% at the 2 highest SCH-23390 doses of 0.5 and 0.2 mg/kg, respectively.
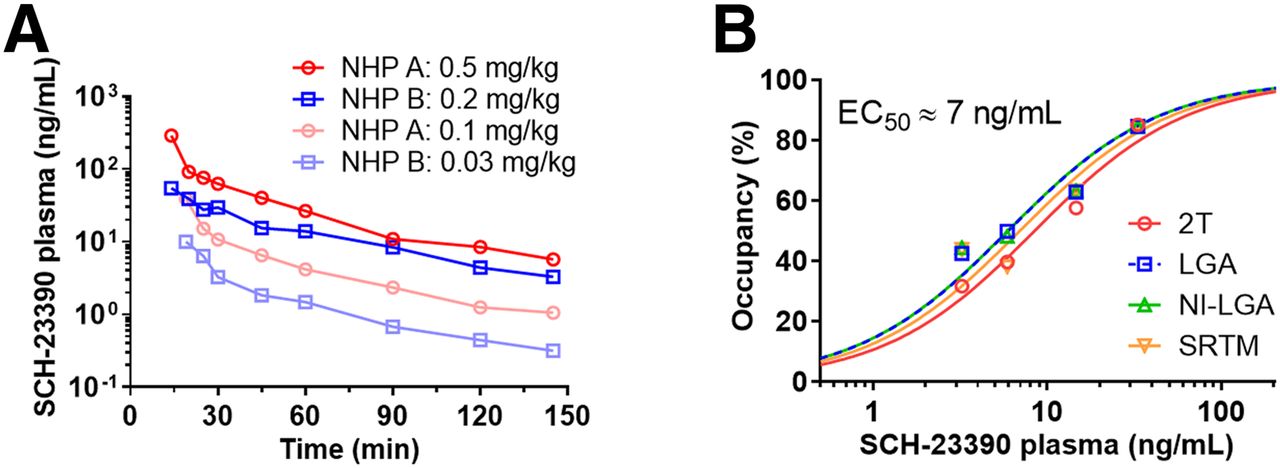
SCH-23390 plasma levels during the preblocking studies are shown in Figure 7A, and the relationship between the measured D1R occupancy and the average plasma levels during the PET imaging (25–145 min after administration of SCH-23390) is shown in Figure 7B for the various analysis methods used, for which the maximum occupancy was constrained to 100%. All methods produced similar occupancy measurements, with slightly lower estimates for 2T at the 2 lowest SCH-23390 doses, with a consistent estimated EC50 ranging from 6.0 ± 1.0 ng/mL for NI-LGA to 8.5 ± 1.0 ng/mL for 2T (average, ∼7 ng/mL).

(A) SCH-23390 plasma levels for 4 doses, with 18F-MNI-800 injection at 25 min after drug administration. (B) Striatal D1R occupancy against average plasma levels between 25 and 145 min after administration of SCH-23390. EC50 = half-maximal effective concentration.
18F-MNI-800 Dosimetry
Whole-body studies showed that 18F-MNI-800 is eliminated mainly via the hepatobiliary route. The urinary bladder, gallbladder, and liver were determined to be the critical organs with the highest absorbed dose (Supplemental Table 5). The whole-body effective dose (ED) was estimated to be 0.025 mSv/MBq for the female rhesus and 0.021 mSv/MBq for the male rhesus, in line with other 18F-labeled tracers (e.g., 0.019 mSv/MBq for 18F-FDG (24)).
DISCUSSION
Both 18F-MNI-800 and its active atropisomeric (−)-enantiomer 18F-MNI-968 demonstrated high penetration in monkey brain, with uptake distribution in agreement with the known D1R distribution. Blood profiles were highly similar, with an almost identical metabolism rate and fp (∼13%).
SCH-23390 has a 5-HT2a component (15); however, the density of 5-HT2a receptors in the striatum is negligible compared with D1R. Therefore, SCH-23390 preblocking studies confirmed the specificity and selectivity of 18F-MNI-800 for D1R over other targets in the striatum, as is expected to hold true for 18F-MNI-968 because it is one enantiomer. Absolute selectivity against 5-HT2a receptors could be tested further by a challenge with the selective 5-HT2a antagonist MDL 100907. These studies also confirmed the choice of the cerebellum as a reference region for noninvasive methods, BPND calculations, and occupancy measurements since the signal in this region was not blocked. This choice is also supported by a VND estimate from occupancy plots of 2.0 ± 0.1 (25), in very good agreement with a VT of 1.9 ± 0.1 in the cerebellum (Table 2). Assuming passive diffusion through the blood–brain barrier, the tissue non-displaceable free fraction (fND) can be calculated from the measured fp and VND above (20), giving an fND of approximately 7%, in close agreement with the unbound fraction of 6% in brain. Finally, the agreement in occupancy estimates between the plasma-based and reference-region–based methods suggests that D1R occupancy can be quantitatively assessed in monkeys using SRTM or NI-LGA, without the need for arterial sampling.
BPND in humans and NHPs was reported to be approximately 0.4–0.6 in the cortex and 2.0–3.0 in the striatum for 11C-SCH-23390 and approximately 0.6–0.8 in the cortex and 3.0–4.0 in the striatum for 11C-NNC-112 (15,26–28), which are higher than the values reported here for 18F-MNI-968 (∼0.3 in the cortex and ∼1.1 in the striatum, Table 3). Also, BPND variability in humans was reported as approximately 10%–15% in the cortex and 5.0%–10% in the striatum for both 11C-SCH-23390 and 11C-NNC-112 (27,29), marginally better than that reported here (Supplemental Table 3), although we assessed the variability in a limited number of animals. However, both 11C-SCH-23390 and 11C-NNC-112 are antagonist radioligands and therefore cannot provide information on the high- or low-affinity state of D1R, and both suffer from a cortical 5-HT2a signal that represents about 20%–30% of the total signal (15,26). Therefore, further evaluation and characterization of 18F-MNI-968 in human subjects is warranted because the tracer could prove to be a valuable tool in Parkinson disease (9) and in psychiatric disorders such as schizophrenia (8).
CONCLUSION
We report here the evaluation of racemate 18F-MNI-800 and its (−)-enantiomer 18F-MNI-968 in NHPs. Both tracers had regional uptake consistent with D1R distribution. The selectivity and specificity of 18F-MNI-800 and 18F-MNI-968 for D1R were demonstrated against SCH-23390 or PF-2562, a selective D1R antagonist and a partial agonist, respectively. Noninvasive quantification of 18F-MNI-800 and 18F-MNI-968 with SRTM or LGA using the cerebellum as a reference is possible, particularly for occupancy studies. 18F-MNI-800 dosimetry, and putatively dosimetry of 18F-MNI-968, are favorable, with an effective dose consistent with values reported for other PET radiotracers. Therefore, 18F-MNI-968 has great potential as a D1R agonist PET radiotracer and warrants further characterization in human subjects.
DISCLOSURE
The research reported in this publication was supported by the National Institute of Mental Health of the National Institutes of Health under award U01MH107803. No other potential conflict of interest relevant to this article was reported.
KEY POINTS
QUESTION: Does the agonist PET tracer 18F-MNI-968 show suitable properties and specific binding to quantify D1 dopamine receptor?
PERTINENT FINDINGS: 18F-MNI-968, the atropisomeric (−)-enantiomer, showed a suitable in vitro pharmacology profile, high brain uptake, favorable kinetics, and specific binding that was blocked by a selective D1R antagonist and a partial agonist.
IMPLICATIONS FOR PATIENT CARE: 18F-MNI-968 has potential as an agonist PET radioligand to quantify D1Rs in the high-affinity state in human brains, particularly in neurologic and psychiatric disorders.
Acknowledgments
We thank Dr. Richard Carson and the staff at the Yale PET Center for conducting the rhesus monkey experiments.
Footnotes
Published online February 12, 2021.
- © 2021 by the Society of Nuclear Medicine and Molecular Imaging.
REFERENCES
- Received for publication September 28, 2020.
- Accepted for publication December 22, 2020.
In this issue


Jump to section
Related Articles
Cited By...
- No citing articles found.