


Abstract
When one is interpreting clinical 18F-FDG PET scans of the brain (excluding tumors) in children, the typical abnormality seen is hypometabolism of various brain regions. Focal areas of hypermetabolism are noted occasionally, and the usual interpretation is that the hypermetabolic region represents a seizure focus. In this review, I discuss and illustrate the multiple causes of hypermetabolism on 18F-FDG PET studies that should not be interpreted as seizure activity, as such an interpretation could potentially be incorrect. Various conditions in which focal hypermetabolism can be encountered on 18F-FDG PET studies include interictal hypermetabolism, Sturge–Weber syndrome, changes associated with brain plasticity after injury, Rett syndrome, hypoxic–ischemic brain injury, various inborn errors of metabolism, and autoimmune encephalitis. The radiologist or nuclear medicine physician interpreting clinical 18F-FDG PET studies should be aware of these circumstances to accurately assess the findings.
PET scans of glucose metabolism using the radiotracer 18F-FDG have been performed for over 3 decades and have been incorporated into clinical practice, particularly in oncology. In adults, brain 18F-FDG PET scans are approved for the evaluation of dementia and intractable epilepsy and for differentiation between recurrent brain tumor and radiation necrosis. In children, however, brain 18F-FDG PET scans are approved for the evaluation of intractable epilepsy before potential epilepsy surgery and for brain tumors. I recently presented data and argued that 18F-FDG PET scans are also clinically valuable in the management of children with neurodegenerative disorders, and I recommended that approval be extended to include this population as well (1).
In the interpretation of 18F-FDG PET scans of the brain, the typical abnormality seen is hypometabolism of various brain regions. For clinical studies, hypometabolic brain regions are determined on visual inspection by comparison with adjacent regions and with the contralateral hemisphere. Various semiquantitative objective methods are also used in some centers to augment visual interpretation. However, brain regions showing hypermetabolism are occasionally noted, and the interpretation of such images can be challenging. The usual conclusion is that the hypermetabolic region represents an epileptic focus (if small) or an epileptogenic region (if large). Although this interpretation may be correct in most patients with epilepsy, it may be incorrect in many cases and lead to erroneous interpretation of the findings. In addition, the semiquantitative objective methods designed to aid in visual analysis have been validated only for the detection of hypometabolism, not for hypermetabolism. In this article, which is based on a review of the literature and focuses mainly on children, I discuss and illustrate the multiple causes of hypermetabolism that can be encountered in 18F-FDG PET studies. A discussion of the hypermetabolism seen in malignant brain tumors is not within the scope of this review. Since this is a review of previously published studies, institutional review board approval was not required. It should be noted that the figures in this article are from several decades ago, and image resolution has since improved considerably. Unless otherwise stated, the images are from the author’s personal dataset. Intensity scales/side bars are not shown because they are not available, but are less relevant for these black-and-white qualitative images.
18F-FDG PET HYPERMETABOLISM IN EPILEPSY
Unlike SPECT, for which ictal scans can be planned, scheduling of ictal PET scans is not practical because of the short half-life of 18F (∼110 min). Patients (particularly children) with frequent seizures may occasionally experience a seizure during the approximately 30-min 18F-FDG uptake period, thus yielding an ictal PET scan. In some institutions, patients with frequent seizures are monitored with an electroencephalogram during the tracer uptake period, and if a clinical or subclinical seizure occurs, its localization, timing, and duration can accurately be analyzed (2). If the seizure occurs early enough (∼the first 10 min) during the tracer uptake period and lasts for more than a few minutes, hypermetabolism may be seen on the images and may provide useful localization data (Fig. 1A), both from the PET scan itself and from the concurrent electroencephalogram, if performed. Brief seizures or seizures occurring late in the relatively long 18F-FDG uptake period will usually not show hypermetabolism.
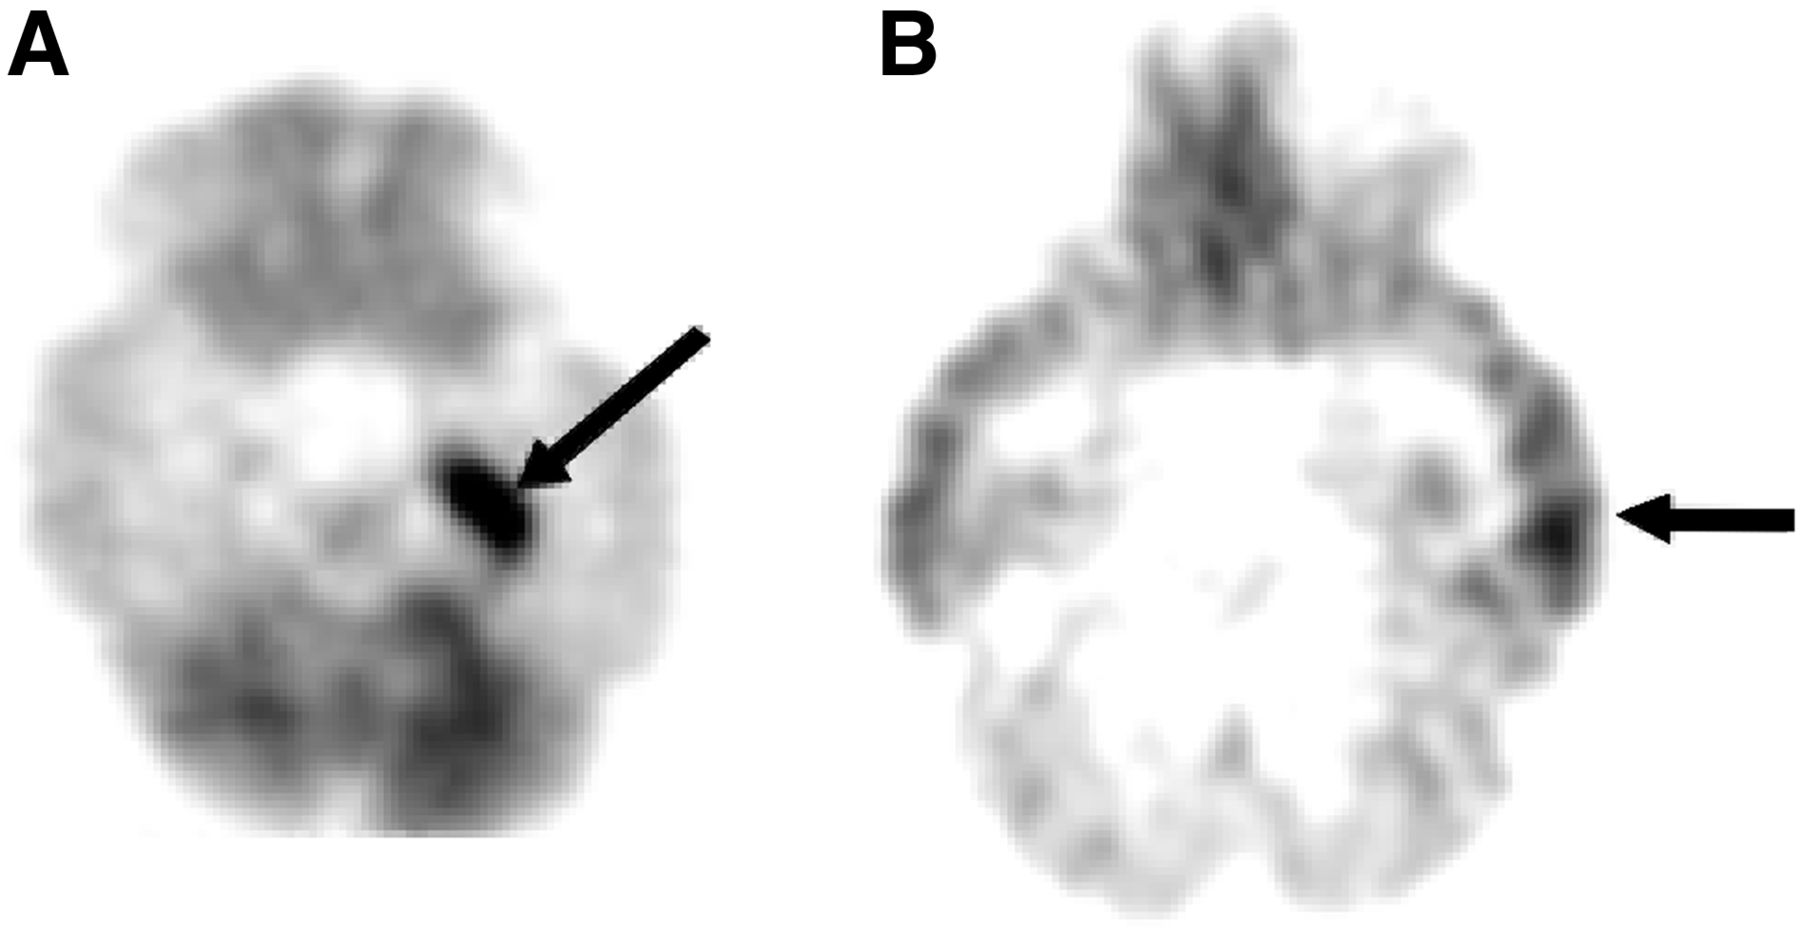
(A) Ictal 18F-FDG PET scan of 14-mo-old child with infantile spasms who fortuitously developed convulsive seizure 12 min after administration of 18F-FDG. Intense hypermetabolism (arrow) is seen in left medial temporal lobe. (B) Interictal hypermetabolism in adolescent with left temporal lobe epilepsy who showed spiking on electroencephalogram during entire 18F-FDG uptake period, producing left temporal cortex hypermetabolism (arrow). No actual seizures were witnessed clinically or observed on electroencephalogram. Without electroencephalography, this 18F-FDG PET study could have been interpreted as right temporal cortex hypometabolism, thus falsely lateralizing seizure focus.
Less well known and often missed is the phenomenon of interictal hypermetabolism (2,3). This occurs when the patient’s electroencephalogram shows a focal interictal epileptiform discharge that persists throughout much of the tracer uptake period. No actual seizure is recorded clinically or on the electroencephalogram, yet the PET images show focal hypermetabolism in a cortical region (Fig. 1B) corresponding to the focal discharge seen on the electroencephalogram. This phenomenon is similar to observations from experimental animal models of focal epilepsy induced by electrical or chemical kindling, and 14C-2-deoxyglucose autoradiography reveals hypermetabolism in the spiking focus without an actual clinical seizure recorded on the electroencephalogram or a clinical seizure observed in the animal (4). The high energy demand of the persistent epileptic spiking is sufficient to produce observable hypermetabolism in the 14C-2-deoxyglucose experimental model and with 18F-FDG in human PET studies. Therefore, patients who are known to have actively spiking foci and are undergoing an 18F-FDG PET study should be monitored with electroencephalography during the uptake period to allow accurate interpretation of the findings, a practice only rarely followed in clinical PET centers. Interictal hypermetabolism is seen more commonly in children than in adults, presumably because the electroencephalograms often show more robust epileptiform activity in epileptic children than in adults. When concurrent electroencephalography during PET is not feasible, a review of previous electroencephalograms of the patient may also aid in the accurate interpretation of the 18F-FDG PET results.
HYPERMETABOLISM IN STURGE–WEBER SYNDROME (SWS)
In children with SWS, the typical finding on 18F-FDG PET is hypometabolism in the involved cortex, often with extension to additional areas beyond the vascular abnormality (leptomeningeal angioma) seen on MRI (5,6). However, in the early stages of the evolution in SWS, affected infants may show a paradoxic pattern of hypermetabolism interictally in the cortex underlying the leptomeningeal angioma. As the disease progresses, the hypermetabolic area becomes hypometabolic and atrophied, indicating a dynamic course of brain injury in this disorder (5). Different regions within the affected hemisphere may undergo this process independently (Fig. 2A). Eventually all affected regions become atrophied and hypometabolic. This can occur in unilateral as well as bilateral cases of SWS (Figs. 2B and 2C). Early hypermetabolism seen on the 18F-FDG PET scans of children with SWS is almost never the result of seizure activity unless an actual seizure is witnessed during the tracer uptake period. Moreover, the hypermetabolism in SWS is typically not due to interictal spiking since this is not a common finding in their electroencephalograms, which more typically show focal slowing and background attenuation over the angioma.
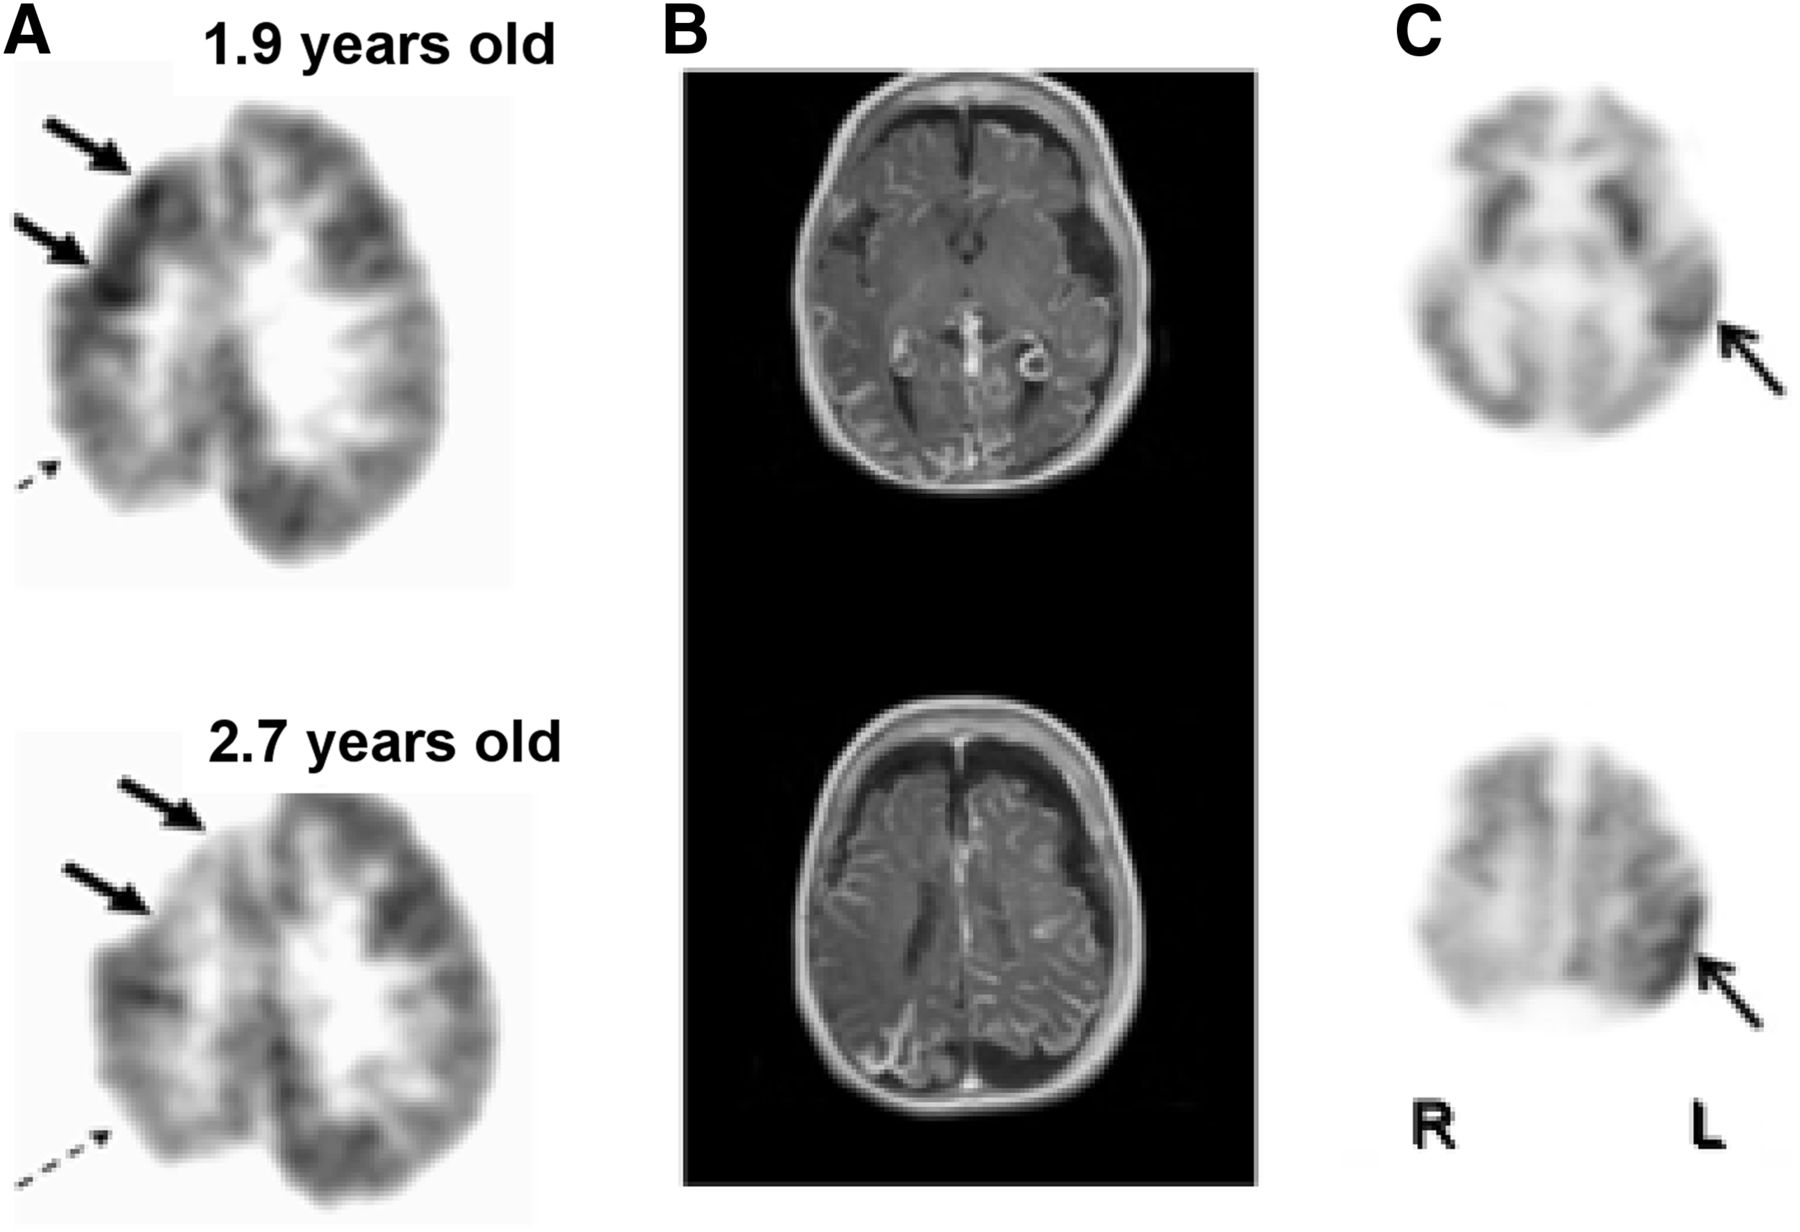
(A) Transient focal hypermetabolism evolving to hypometabolism and brain injury in SWS may undergo different temporal course in various regions within affected hemisphere. In this child, 18F-FDG PET scan shows interictal right frontal cortex hypermetabolism at age 1.9 y evolving to hypometabolism at age 2.7 y (solid arrows), whereas right parietal cortex hypometabolism was already present at age 1.9 y and unchanged at 2.7 y (dashed arrows). (B and C) MRI and 18F-FDG PET in child with bilateral brain involvement showing both hypometabolism and hypermetabolism (arrows).
The finding of focal glucose hypermetabolism in the early stages of SWS should not be misinterpreted as a seizure focus or an area of ischemia requiring more glucose because it has switched to anaerobic metabolism. Indeed, these considerations were dismissed after findings reported from SPECT studies that showed hyperperfusion in affected regions in babies and infants even before seizure onset (7). Both the 18F-FDG PET and the SPECT observations are consistent with an earlier study that found accelerated myelination in the affected hemisphere on MRI scans (8).
Glucose hypermetabolism, hyperperfusion, and accelerated myelination in focal brain regions early in the course of SWS are likely interrelated phenomena indicating dynamic changes within these regions leading to eventual tissue damage. A study using MR spectroscopy to address the underlying cause of the hypermetabolism found mean ipsilateral/contralateral glutamate/creatine ratios to be highest in the youngest of the 10 children evaluated, with a strong positive correlation to their seizure frequency scores. All scans were performed in the interictal state as verified by concurrent electroencephalogram monitoring. In 5 children, increased glutamate concentrations in the affected hemisphere were seen in the same areas as those currently or previously manifesting hypermetabolism on 18F-FDG PET (9). The authors suggested that increased glutamate concentrations are common in young children with SWS and likely to be associated with their tissue damage and epilepsy. These findings are also consistent with observations from a previous study suggesting that the early cortical hypermetabolism may be predictive of subsequent severe epilepsy (10).
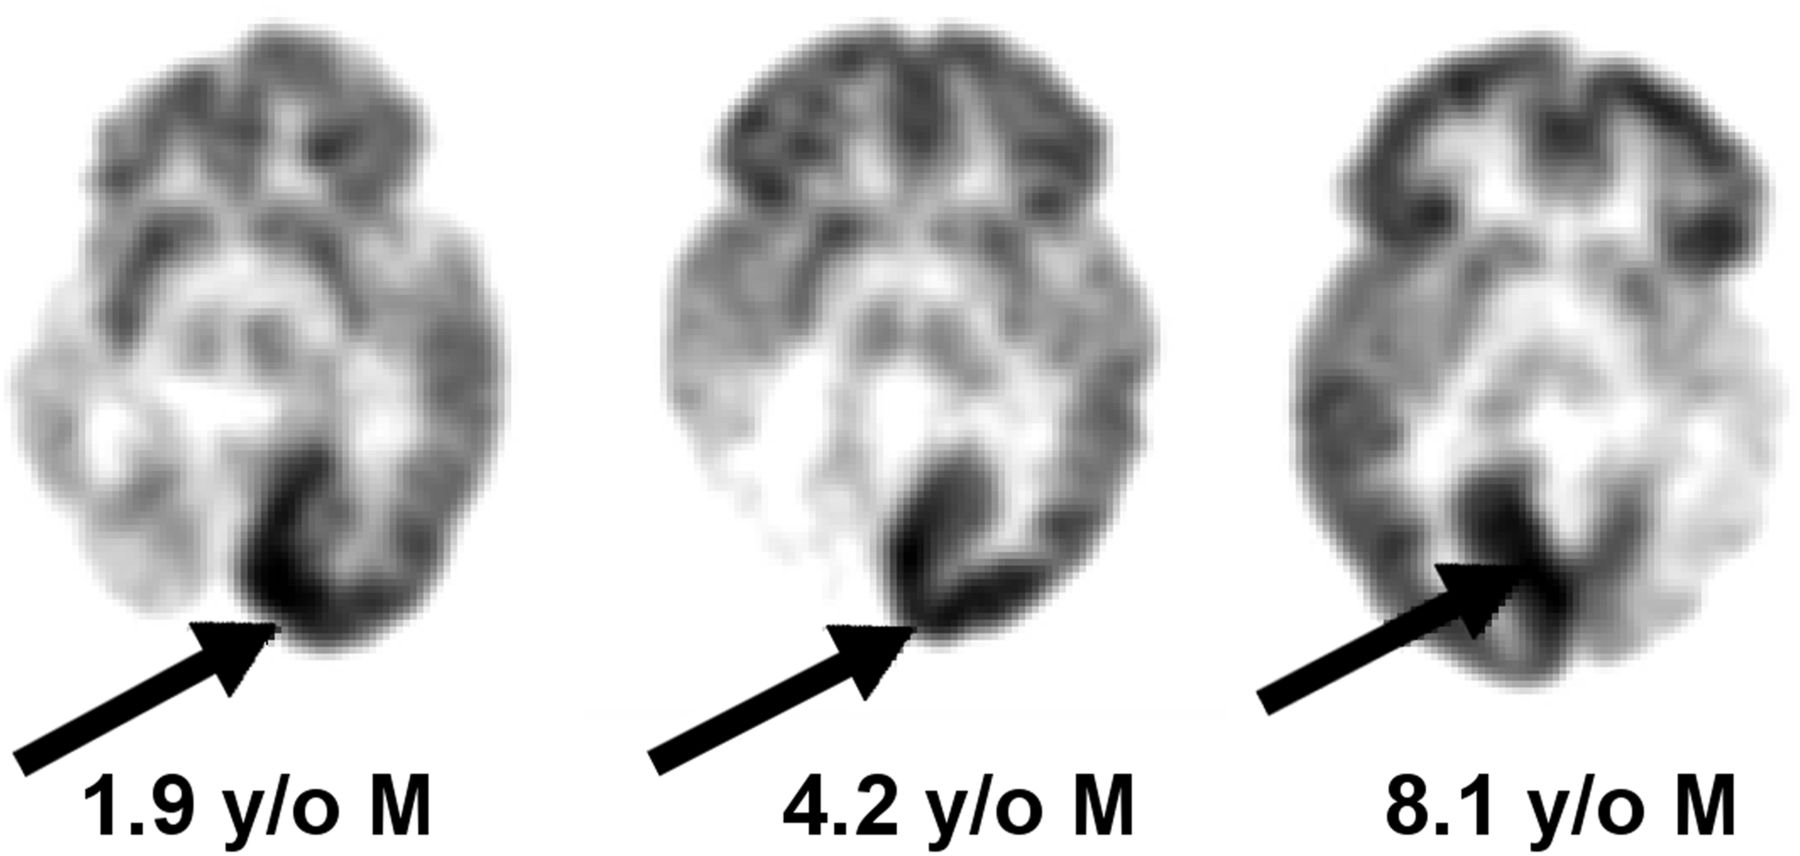
Another phenomenon displaying focal hypermetabolism in SWS relates to occipital lobe plasticity. When there is significant and early (likely intrauterine) occipital lobe injury resulting in severe hypometabolism and atrophy in the affected occipital lobe, there may be dramatic hypermetabolism in the contralateral intact occipital lobe (Fig. 3), which appears normal on the MRI scan (11). This hypermetabolism seen in the intact hemisphere is not related to epilepsy and should not be misinterpreted as a seizure focus. It is likely due to reorganizational changes (plasticity) in the intact occipital lobe and is not specific to SWS but may also be seen in other conditions, such as focal cortical dysplasia affecting one occipital lobe (12).

18F-FDG PET scans of 3 children with unilateral leptomeningeal angiomatosis in SWS. Arrows point to normal occipital cortex showing hypermetabolism, as compared with contralateral affected hemisphere, which shows severe hypometabolism and atrophy.
RETT SYNDROME
Focal glucose hypermetabolism in interictal 18F-FDG PET studies has been reported in Rett syndrome, which is a neurodevelopmental disorder, affecting primarily girls, that progresses over several stages to severe intellectual and physical disabilities; the disorder results from mutations in the MECP2 gene, as was recently reviewed (13). Neuroimaging studies in Rett syndrome have revealed restriction of brain growth beginning in the first year of life; neuropathology examination suggests that axodendritic connections are the most vulnerable in this neurodegenerative process. Naidu et al. (14) studied children with Rett syndrome using various neuroimaging approaches and found the largest changes in the frontal lobes, which showed hypoperfusion, as well as increased choline and reduced N-acetylaspartate on MR spectroscopy. However, 18F-FDG PET showed hypermetabolism in the frontal lobes not related to seizure activity (Fig. 4). The authors concluded that the frontal cortex was hypermetabolic (rather than the occipital cortex hypometabolic) based on the SPECT hypoperfusion and MR spectroscopy findings in the frontal lobe of Rett patients. They hypothesized increased glutamate cycling in synapses leading to brain injury as the mechanism of frontal lobe hypermetabolism. The role of glutamate neurotoxicity in dendritic and synaptic injury is strongly supported by findings from mouse models of Rett syndrome (15). Indeed, the drug trofinetide, which is a glutamate antagonist, is currently undergoing clinical trials in children with Rett syndrome (16) and 18F-FDG PET may potentially serve as an objective biomarker to monitor therapeutic efficacy.

Eight-year-old girl with Rett syndrome whose 18F-FDG PET scan shows bilateral frontal cortex hypermetabolism (arrows). (Reprinted with permission from Elsevier (14).)
HYPOXIC–ISCHEMIC BRAIN INJURY IN THE NEWBORN
Hypermetabolism in damaged brain regions can be seen in newborns in the acute phase after perinatal hypoxic–ischemic brain injury. Previous 18F-FDG PET studies in this population have not reported this phenomenon, presumably because the babies were scanned in the subacute or chronic state. Instead, various patterns of hypometabolism were reported, extending beyond the affected structural abnormalities shown by CT scanning (17). Subsequent studies in these babies suggested that persistently low quantitative cerebral glucose metabolic rates are associated with delayed development (18). Total cerebral metabolic rates of glucose were found to be inversely correlated with the severity of the brain injury. Thus, neonates with the lowest cerebral metabolic rates of glucose subsequently developed permanent neurologic symptoms and cerebral palsy (19).
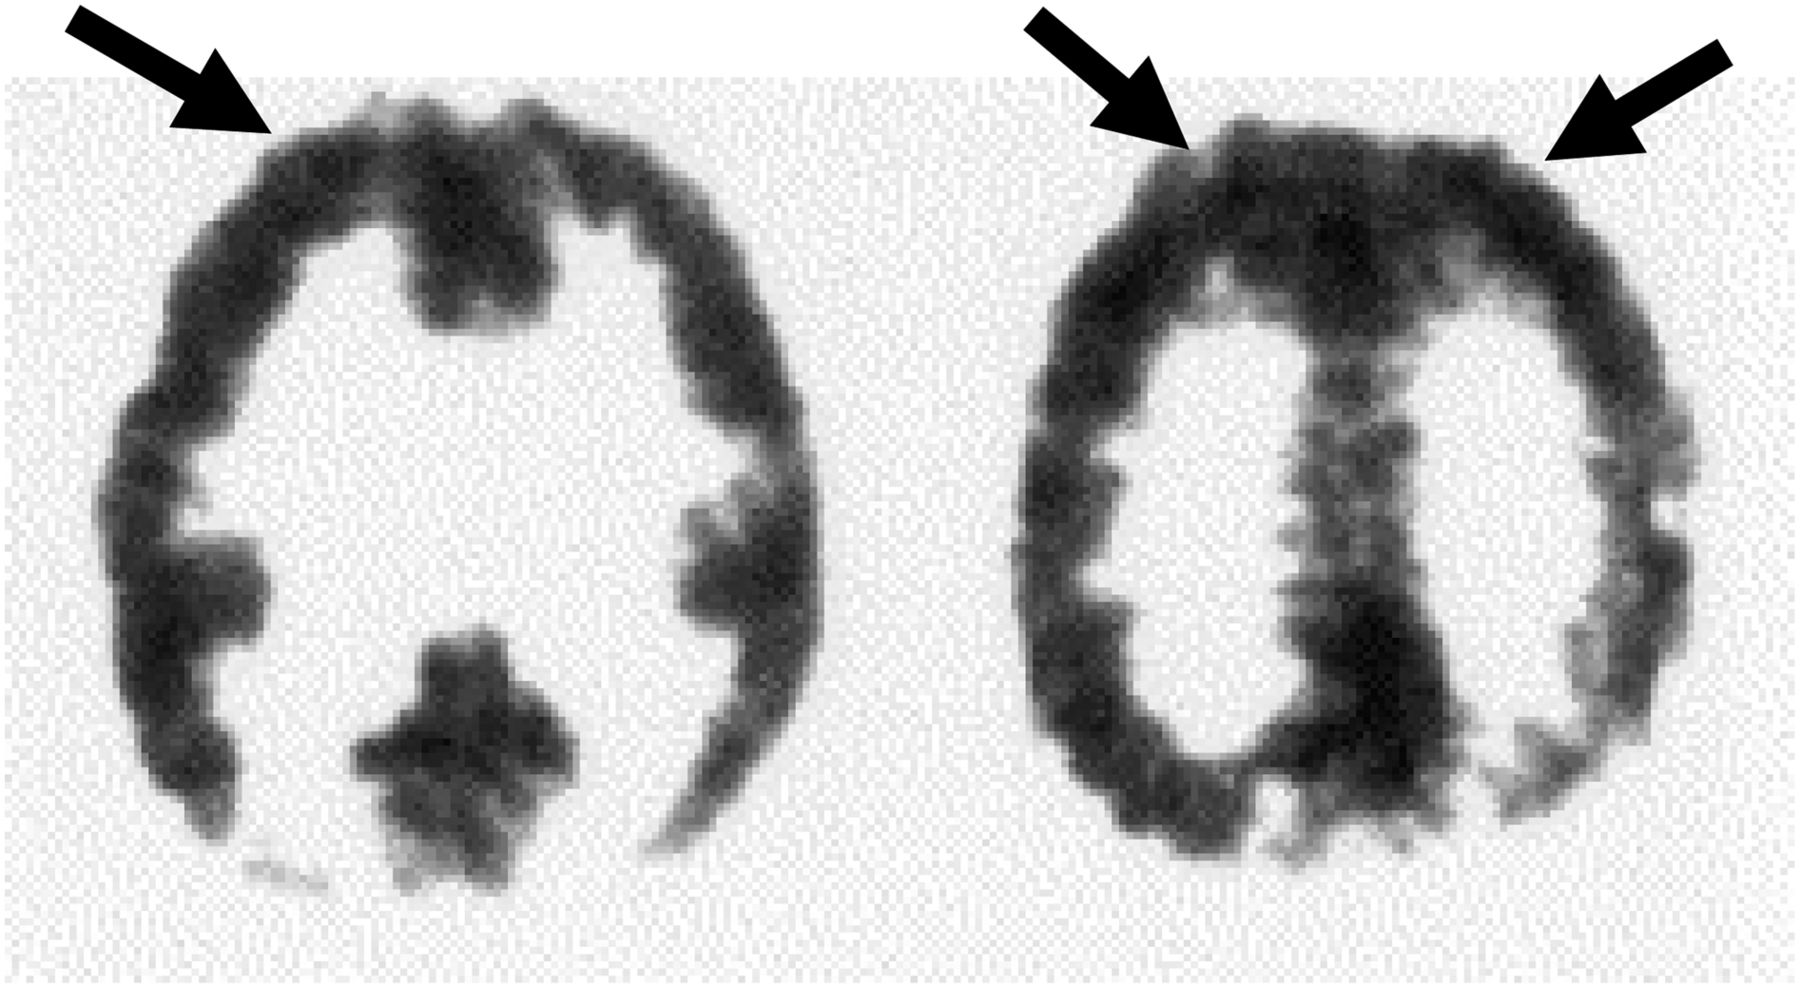
A transient hypermetabolism has been observed in the basal ganglia after the near-total type of hypoxic–ischemic injury in the neonatal period, followed by severe hypometabolism in the lenticular nuclei and thalami when the child was restudied several years later (Fig. 5) (20). This type of acute catastrophic injury may be seen in cases of placental abruption, uterine rupture, or umbilical cord prolapse. The selective vulnerability of the basal ganglia in this setting may be related to the transient excess of glutamate receptors seen in the newborn basal ganglia compared with older children and adults (21). This form of injury is associated with the subsequent development of the dystonic (choreoathetoid, extrapyramidal) type of cerebral palsy, as, indeed, was the sequela in this child. It was postulated that the transition from hypermetabolism to hypometabolism indicates the culmination of the brain injury due to excitotoxic mechanisms, which are mediated by glutamatergic neurotransmission (22). Unfortunately, the time course of the transient hypermetabolism is unknown and yet to be defined. Also unknown is whether transient hypermetabolism is seen in the watershed types of neonatal hypoxic–ischemic brain injury (also referred to as the partial prolonged type of brain injury) sometimes encountered at birth.
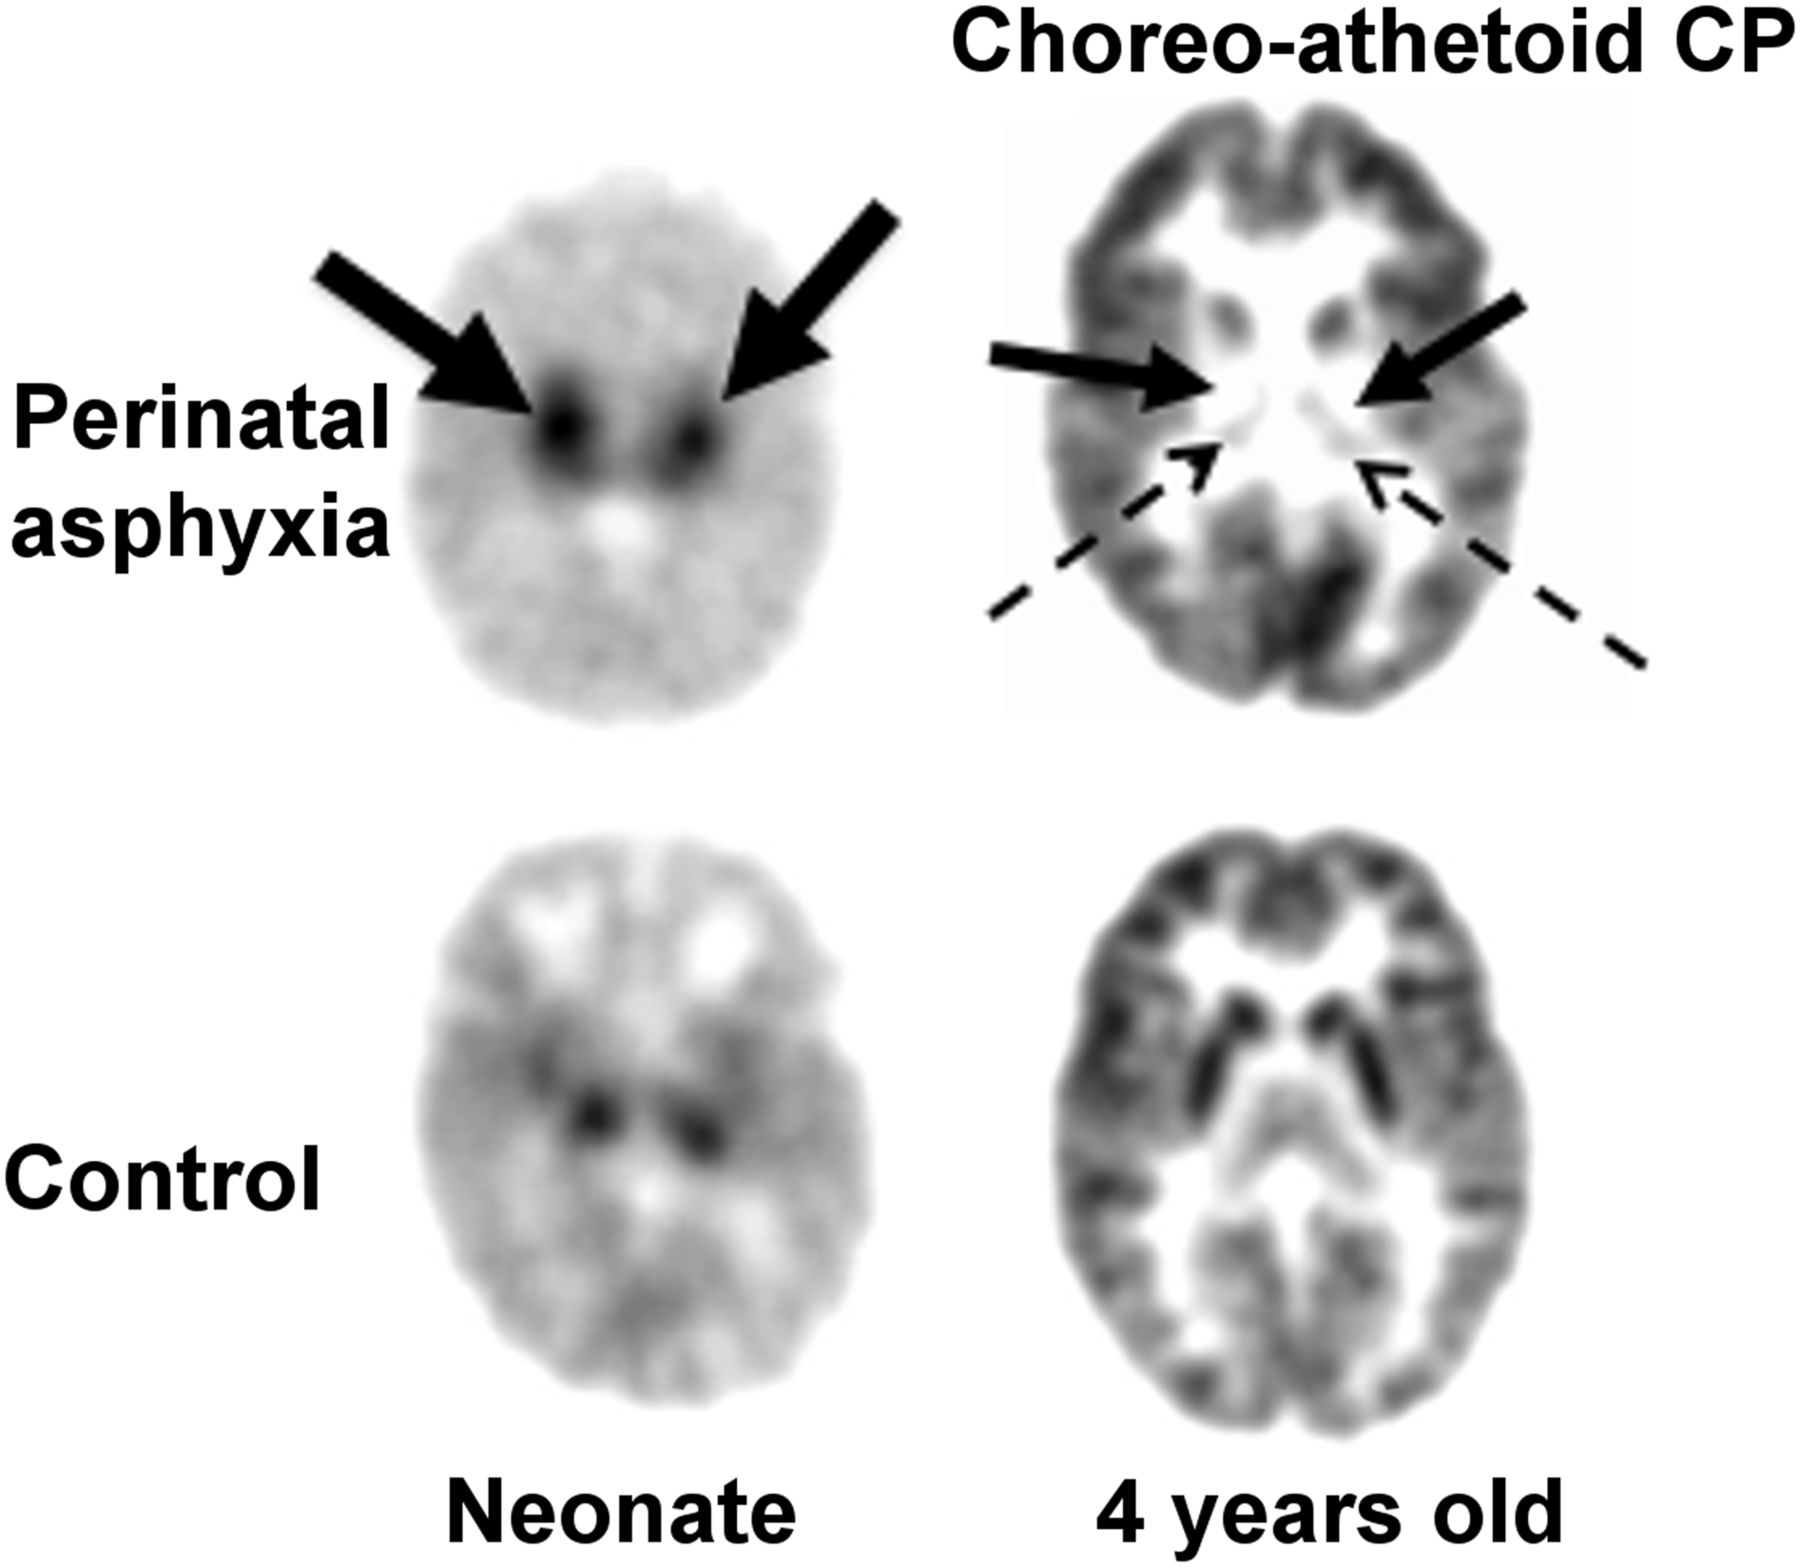
18F-FDG PET scan of child who had hypoxic ischemic encephalopathy at birth and later developed dystonic/choreoathetoid cerebral palsy. Left image, from newborn period, shows intense hypermetabolism in basal ganglia (solid arrows) compared with control. Right image, at 5 y of age, shows severe hypometabolism in lenticular nuclei (solid arrows) and thalami (dotted arrows). Metabolism is relatively preserved in cerebral cortex.
INBORN ERRORS OF METABOLISM
Transient hypermetabolism of the basal ganglia seen on 18F-FDG PET scans has been reported in several inborn errors of metabolism. This transient phase is followed by hypometabolism in the same brain region and indicates a selective vulnerability due to the abnormal biochemical state (i.e., metabolic toxins) in the specific disorder.
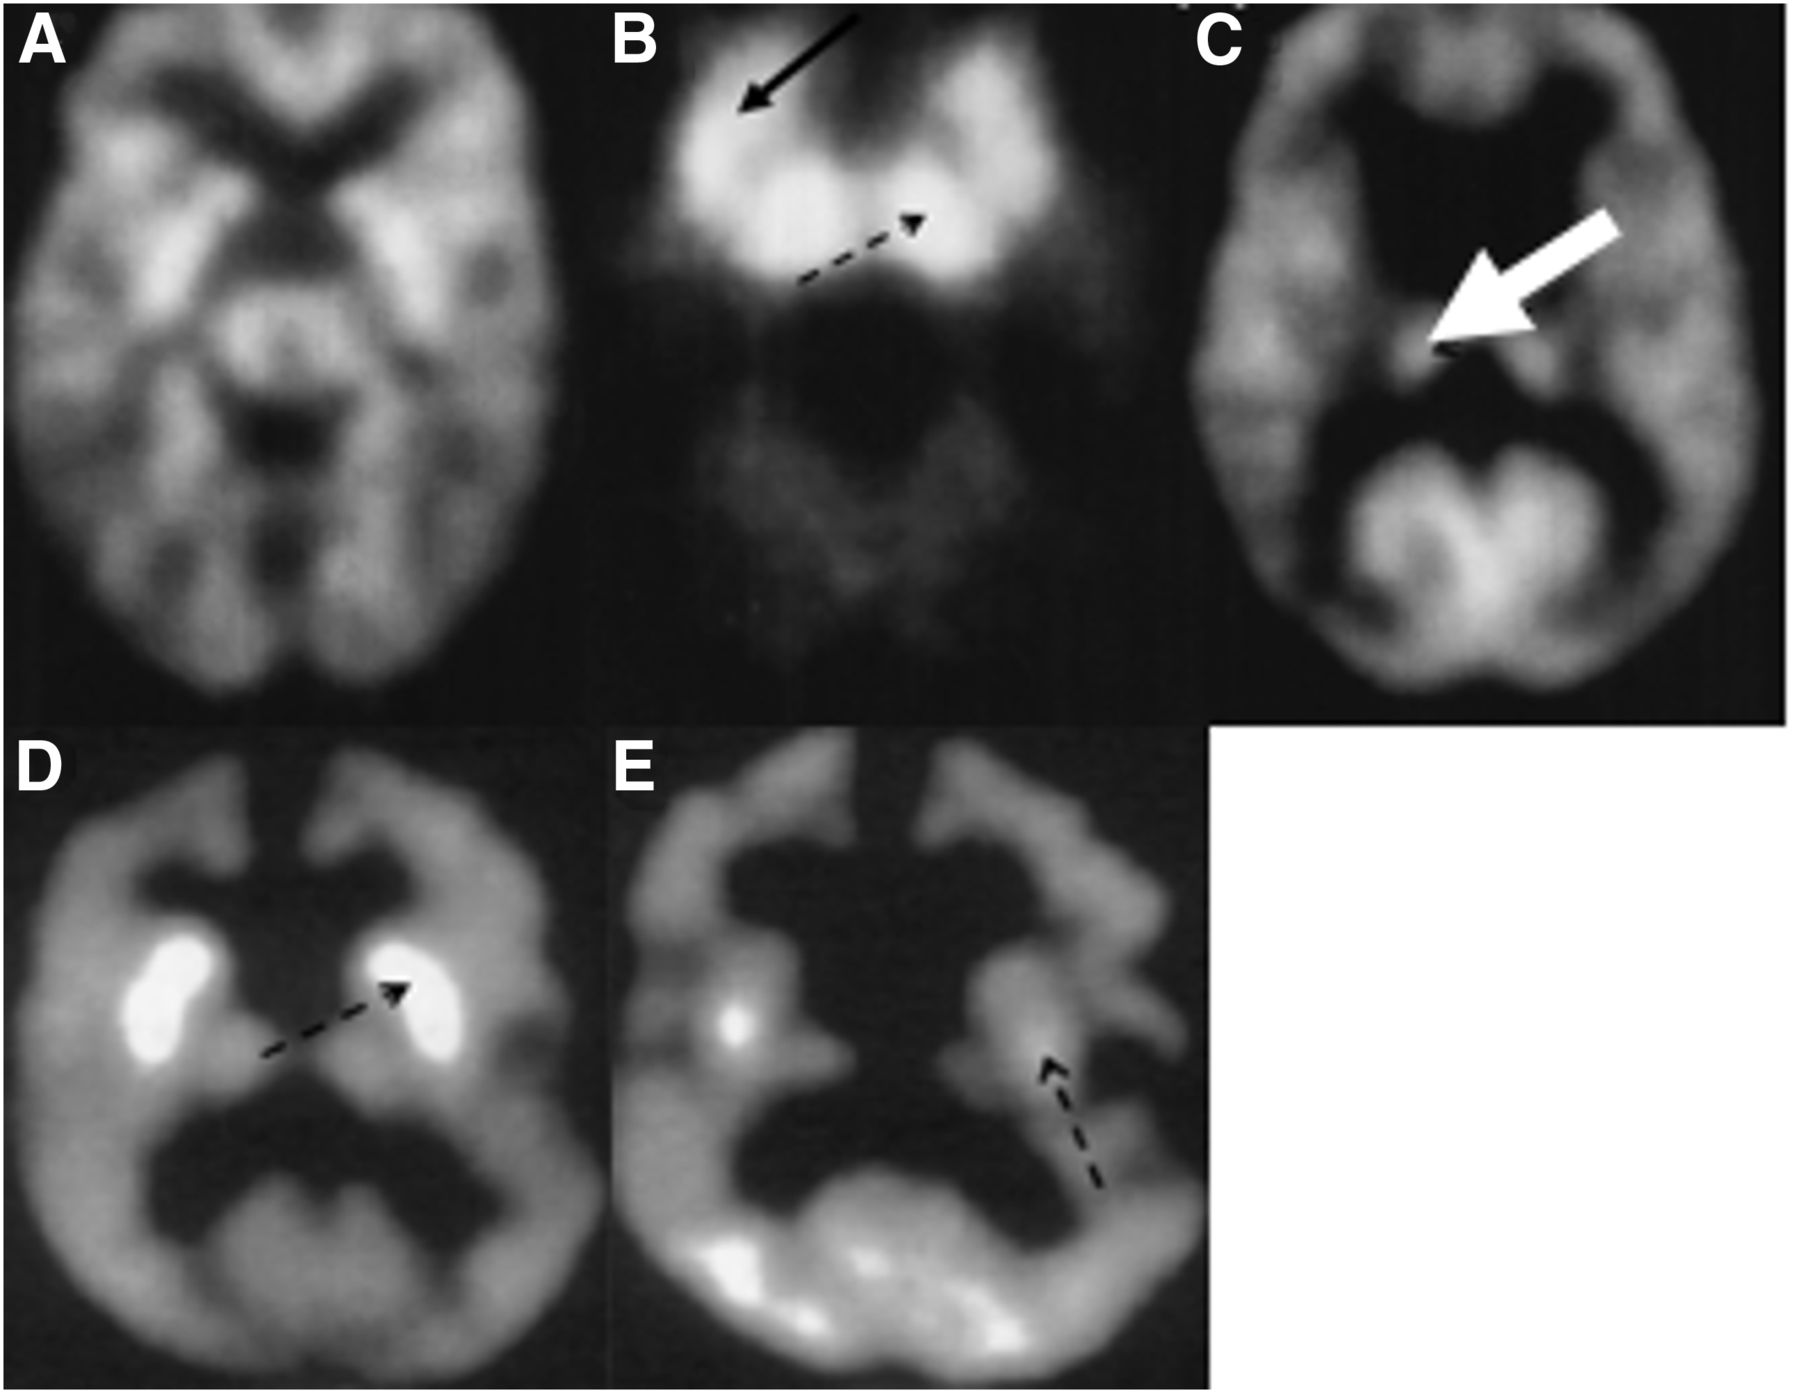
Propionic acidemia is an organic acidemia associated with diverse neurologic manifestations, including developmental delay, intellectual disability, seizures, optic neuropathy, and strokelike episodes. The disorder is progressive and may also result in cardiac, gastrointestinal, and renal complications. Serial MRI and 18F-FDG PET scans in 5 children with biochemically confirmed propionic acidemia showed normal findings on both 18F-FDG PET and MRI in the early stages of the disorder. As the disease progressed, the 18F-FDG PET scans revealed glucose hypermetabolism in the basal ganglia and thalami with subsequent evolution to hypometabolism in the basal ganglia (Figs. 6A–6C), whereas MRI showed atrophy and an abnormal signal in the caudate and putamen, with normal thalami (23). The investigators suggested that the neurotoxins in this metabolic disorder have a predilection for the basal ganglia, activate glutamatergic mechanisms, and eventually damage or destroy the basal ganglia. This notion is supported by the transient hypermetabolism in the basal ganglia in accordance with the dynamic nature of neurodegeneration during the course of this disorder.

(A–C) 18F-FDG PET scans of 3 children with propionic acidemia at different stages of disease: at age 1 mo (A), this baby shows relatively normal pattern of glucose metabolism for age; this 2-mo-old infant (B) shows intense hypermetabolism in basal ganglia (solid arrow) and thalamus (dashed arrow); this 2-y-old child (C) shows relatively normal glucose metabolism in thalamus (dashed arrow), but basal ganglia shows no metabolic activity. (Reprinted with permission from Elsevier (23).) (D and E) 18F-FDG PET images of boy with ethylmalonic aciduria: at 2 y of age (D), intense bilateral hypermetabolism is seen in caudate nucleus and putamen (dashed arrow); when scanned again at age 3 y (E), there has been evolution of hypermetabolism to hypometabolism (dashed arrow). (Reprinted with permission from Elsevier (24).)
A somewhat similar phenomenon has been reported in ethylmalonic aciduria, which is a severe organic aciduria affecting mitochondria and the vasculature. Ethylmalonic aciduria, in addition to involving the central nervous system, can also lead to changes in the retinal vessels, acrocyanosis, petechiae, and gastrointestinal symptoms. The central nervous system symptoms include hypotonia, physical and intellectual regression, and, as the disease progresses, dystonia and spasticity. Neuroimaging studies in a 6-mo-old boy with ethylmalonic aciduria showed normal MRI findings but bilaterally intense hypermetabolism in the caudate and putamen on 18F-FDG PET (Figs. 6D and 6E). When performed again a year later, 18F-FDG PET showed bilateral hypometabolism in the putamen, caudate head, and frontal cortex, whereas MRI showed atrophy and infarcts in the basal ganglia (24). These findings are again consistent with the selective vulnerability of the basal ganglia in some inborn errors of metabolism.
18F-FDG PET scans have been performed on several other inborn errors of metabolism, often published in case reports. The general finding is hypometabolism, but in some cases, the hypometabolism is specific to, or most prominent in, the basal ganglia. These include glutaric aciduria type 1 (25,26) and 3-methylglutaconic aciduria (27). It is unclear at which stage of disease progression these 18F-FDG PET studies were conducted. I postulate that had the 18F-FDG PET studies been performed at an earlier stage of rapid clinical regression in these disorders, the 18F-FDG PET scans might also have shown transient hypermetabolism in the basal ganglia. Furthermore, recently developed hybrid PET/MRI scanners provide a unique opportunity to determine the time course and relationship between structural, glucose metabolism, and MR spectroscopic changes seen in this group of rare disorders.
AUTOIMMUNE ENCEPHALITIS
The autoimmune encephalitides comprise a group of disorders characterized by changes in mental status, seizures, dyskinesias, or memory decline in association with the presence of serum and cerebrospinal fluid autoantibodies against brain proteins (28). MRI scans in these disorders often have normal findings or may show increased fluid-attenuated inversion recovery/T2 signal in various locations, such as in one or both temporal lobes in limbic encephalitis. 18F-FDG PET scans may show focal hypermetabolism in various locations (29,30).
A report of focal hypermetabolism in a case of autoimmune encephalitis involved a 15-y-old boy with anti-N-methyl-d-aspartate receptor encephalitis whose brain MRI findings were repeatedly normal (29). On day 26 of admission, 18F-FDG PET showed global hypometabolism with a prominent focally intense hypermetabolic lesion in the right cerebellar cortex (Fig. 7). The patient showed clinical signs of improvement after 2 courses of intravenous immunoglobulin therapy over 4 wk. On day 46, repeat brain 18F-FDG PET showed overall improvement, but in contrast to the previous 18F-FDG PET scan, the right cerebellar cortex showed focal hypometabolism. Focal hypermetabolism or more commonly hypometabolism in autoimmune encephalitis has been confirmed by other investigators and can be useful in early diagnosis in these disorders (30–32). In particular, some cases of suspected autoimmune encephalitis may be antibody-negative, and 18F-FDG PET may contribute toward establishing a clinical diagnosis.
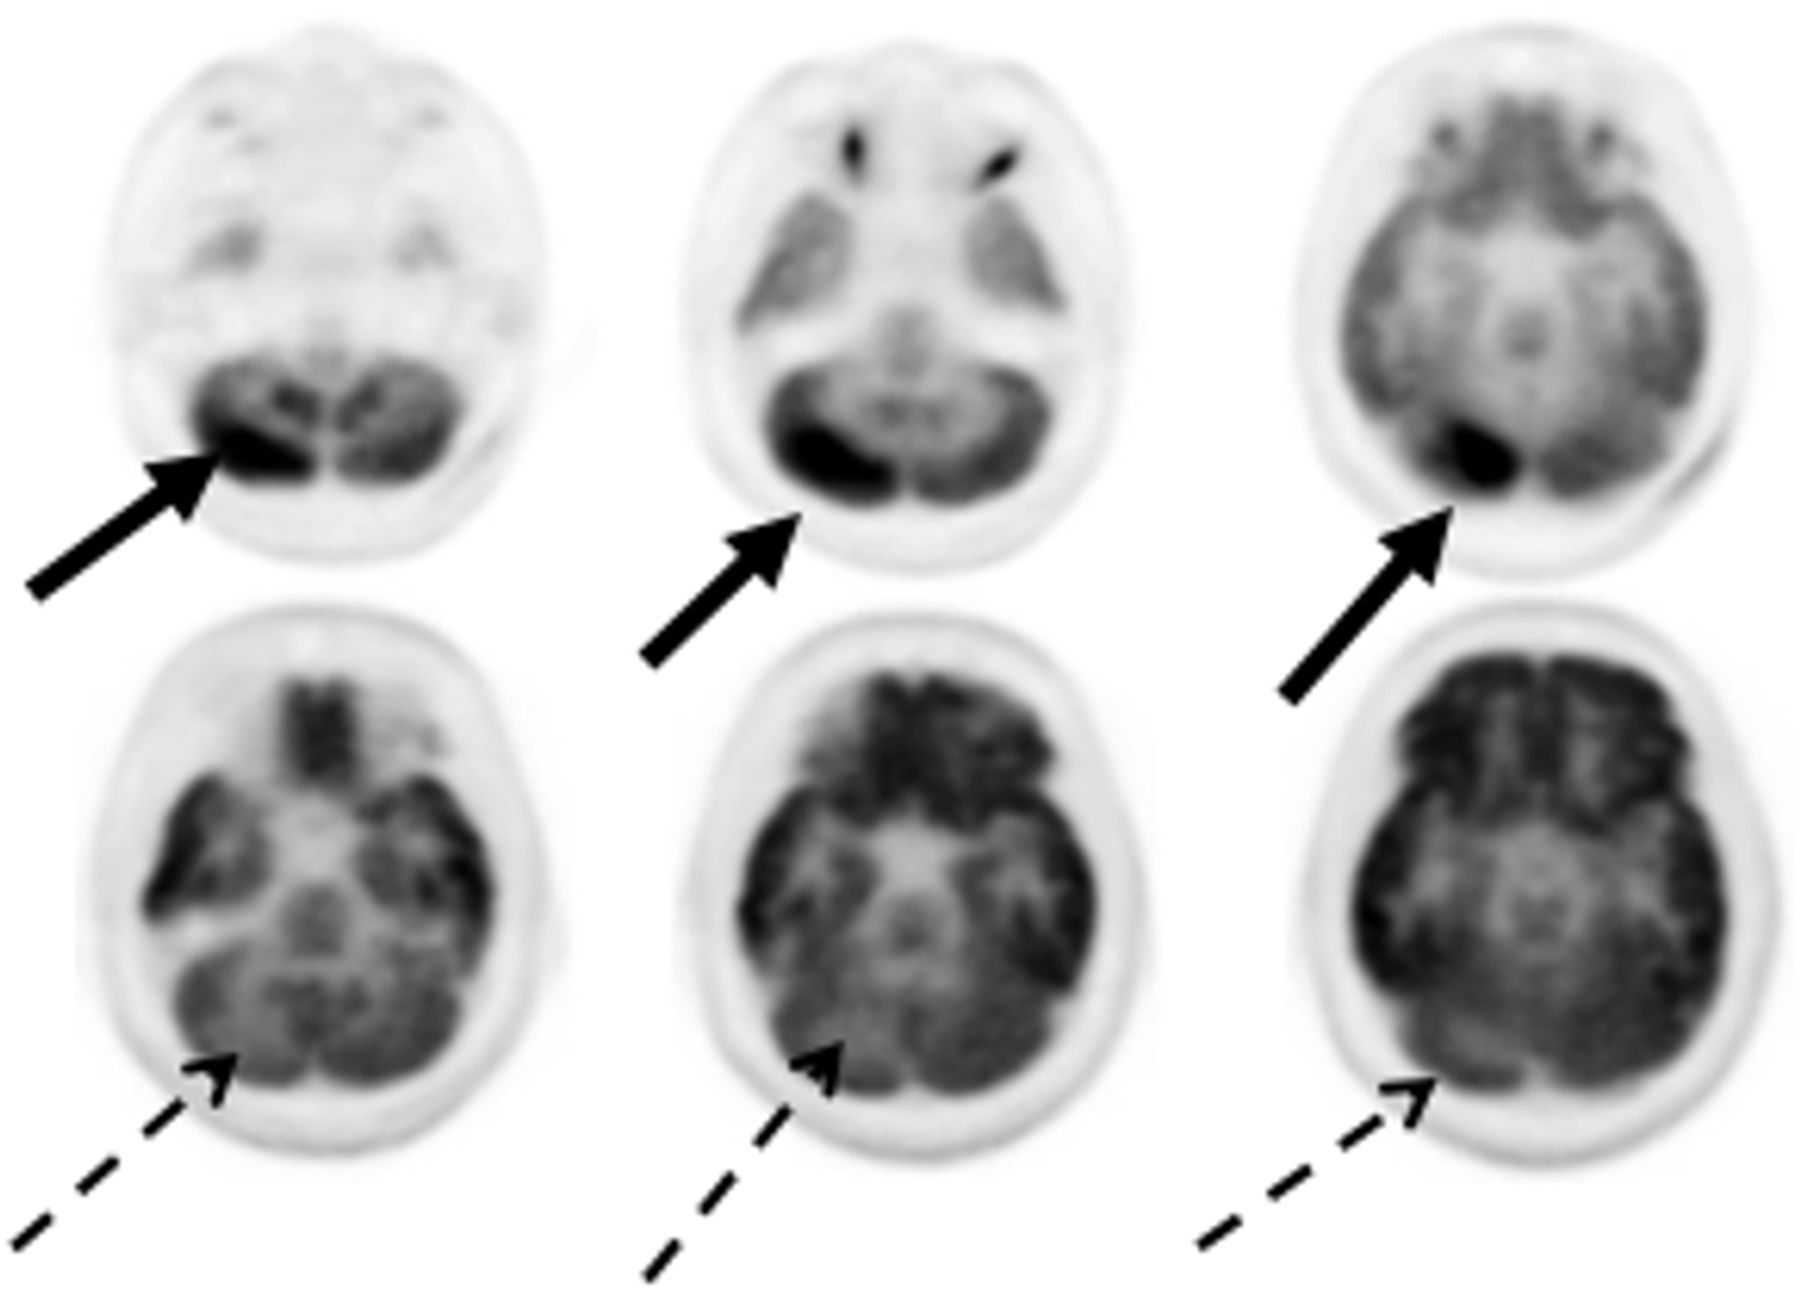
18F-FDG PET scans of 15-y-old boy with anti-N-methyl-d-aspartate receptor encephalitis. (Top) Focal intense hypermetabolism in right cerebellar cortex (solid arrows) and diffuse hypometabolism of bilateral cerebral hemispheres. (Bottom) Subsequent focal hypometabolism in right cerebellar cortex (dashed arrows), corresponding to initially hypermetabolic region. (Reprinted with permission from Sage (29).)
CONCLUSION
In this review, I have illustrated multiple examples of hypermetabolism that should not be interpreted as seizure activity on 18F-FDG PET scans. The radiologist or nuclear medicine physician interpreting these studies needs to be aware that focal hypermetabolism does not always indicate a seizure focus, and the physician should be familiar with the less common causes of hypermetabolism. Since seizures do not emanate from the basal ganglia, the physician should also be aware that increased glucose metabolism in the basal ganglia may be a clue to an underlying metabolic disorder. In these cases, the timing of the 18F-FDG PET scan in relation to the course of a progressive neurologic disorder should be noted, and if indicated, the study should be repeated to determine progressive changes in brain glucose metabolism.
Finally, it is acknowledged that when interpreting 18F-FDG PET scans of glucose metabolism visually (as in clinical studies), we are looking at relative hypermetabolism since absolute quantification is not available, and interpretation may thus be challenging. Some general rules may be helpful in this regard. For example, if supratentorial cortical metabolism is decreased, thalamic metabolism usually follows; caudate may follow, but not the rest of the basal ganglia or brain stem. Frontal, parietal, and temporal cortex metabolism is usually lower than metabolism in the primary visual cortex (medial occipital cortex, calcarine cortex). Cerebellar metabolism is higher than most supratentorial cortical metabolism in the first few months postnatally, but never after the first year. This rule is particularly useful when deciding between supratentorial cortical hypometabolism and basal ganglia hypermetabolism. Brain stem nuclei metabolism is usually around the same as that of the basal ganglia. Ultimately, the experience of the interpreting physician, as well as knowledge of the patient history, is crucial.
DISCLOSURE
No potential conflict of interest relevant to this article was reported.
Footnotes
Published online January 15, 2021.
- © 2021 by the Society of Nuclear Medicine and Molecular Imaging.
REFERENCES
- Received for publication September 2, 2020.
- Revision received December 22, 2021.
In this issue


Jump to section
Related Articles
Cited By...
- No citing articles found.