


Abstract
The potential role of prostate-specific membrane antigen (PSMA) PET/CT in non–prostate cancer tumors has shown promising results. We examined the performance of dynamic 68Ga-PSMA-11 PET/CT (DPSMA) for the evaluation of localized renal mass. Methods: A prospective case series of patients with a newly diagnosed renal mass who were referred for surgery was examined. DPSMA was performed in a standardized manner before surgery. The final surgical histology served as the standard of reference. PSMA expression in the tumor vasculature was assessed and staining intensity was scored. Tracer uptake and PSMA expression were compared between benign and malignant tissue. Results: Of 29 enhancing renal masses evaluated in 27 patients, 24 (83%) were malignant lesions. The median SUVmean of benign and malignant lesions was 2.3 (interquartile range [IQR], 2.2–2.7) and 6.8 (IQR, 4.2–10.1), respectively (P = 0.009). Median SUVmax of benign and malignant lesions was 3.8 (IQR, 3.3–4.5) and 9.4 (IQR, 5.4–15.8), respectively (P = 0.015). The median washout coefficient (K 2) was significantly lower in malignant lesions than in benign lesions (0.17 vs. 0.70, P = 0.02). Positive PSMA staining was found in 20 of 24 malignant lesions and in 2 of 5 benign lesions (P = 0.04). Conclusion: This pilot study demonstrated DPSMA uptake and kinetics in localized renal masses. Increased 68Ga-PSMA-11 tracer uptake and intratumoral retention correlate with PSMA expression in malignant renal tumors compared with benign renal masses, supporting further assessment of DPSMA as a potential tool for evaluating localized renal masses.
The incidental detection of clinically localized renal masses continues to increase worldwide (1). Although a substantial minority of renal masses are benign, the majority are malignant lesions with significant variability in biologic aggressiveness. Although renal mass biopsy can discriminate fairly well between benign and malignant histology (2), it is an invasive procedure with a notable nondiagnostic rate (3). Therefore, imaging studies remain the mainstay diagnostic process.
The potential application of conventional imaging studies, such as CT and MRI, to determine the histologic nature of a renal mass has been thoroughly investigated. For example, T2-weighted MRI helps differentiate between lipid-poor angiomyolipomas and clear cell renal cell carcinoma (ccRCC), whereas dynamic contrast-enhanced MRI can help differentiate between oncocytomas and chromophobe RCC (chRCC) (4,5). Diffusion-weighted MRI uses changes in tissue organization that affect the movement of water molecules. It has been investigated as a supplement to conventional MRI sequences for the prediction of renal malignancy (6). However, evidence suggests these modalities have an overall moderate accuracy for the prediction of malignancies and fair to moderate interreader agreement (7).
PET/CT provides essential information on lesions' morphologic appearance and biologic behavior. Ongoing studies focus on optimizing the use of different radiotracers in RCC (8). Although prostate-specific membrane antigen (PSMA) PET/CT was extensively investigated in prostate cancer, there are limited data regarding its uptake and localization/dynamics in other malignancies. PSMA-associated tracer uptake has been reported in a spectrum of benign and malignant lesions, including abdominal, thoracic, skeletal, and central nervous system (9).
PSMA is a glycoprotein with an internal transmembrane and external amino acid portion. As products of its folate hydrolase activity are associated with angiogenesis (10), the highly vascularized nature of RCC makes it a potential PSMA-avid tumor. Several small-scale studies investigated the use of PSMA PET in metastatic RCC patients with promising results (11). Here, we examined the role of dynamic 68Ga-PSMA-11 PET/CT (DPSMA) in the evaluation of localized renal mass.
MATERIALS AND METHODS
Patients
A prospective case series design was used. Patients referred for surgery at our institution with a newly diagnosed clinical stage I CT-enhanced renal mass were considered eligible for this study. DPSMA was performed up to 3 mo before surgery. Surgical treatment (partial or radical nephrectomy) was administered independently of the PET/CT results. Data on patient characteristics and radiographic tumor features were collected. The study was approved by the institutional review board, and all patients signed an informed consent form. 68Ga-PSMA-11 PET was approved for clinical use by the Israel Ministry of Health in 2016.
PET/CT Protocol
Images were obtained from an integrated 8-slice PET/CT scanner (Discovery 710; GE Healthcare) through dynamic acquisition initiated by injecting 75–150 MBq (2–4 mCi) of 68Ga-HBED-CC-11-PSMA (68Ga-PSMA-11). After a scout view of the pelvis, the study centered on the kidneys with PET coverage of 20.0 cm using a noncontrast low-dose (30 mA) CT scan. An automatic power injector (Dual-shot; Nemoto) inserted 68Ga-PSMA-11 as a rapid bolus flushed with 50 mL of 0.9% saline solution at 5.0 mL/s, resulting in a 3-dimensional (3D) scan (matrix size 64 × 64, slice thickness 3.27) consisting of 18 sequential frames of 5 s each, followed by 9 frames of 60 s each. PET emission data after attenuation correction were reconstructed with a 3D ordered-subset expectation maximization algorithm (2 iterations, 20 subsets).
Data Processing and Kinetic Analysis
Masked imaging analysis was performed with histology as the reference standard. All PET measurements and visual analyses were analyzed in consensus by a nuclear medicine physician and a radiology and nuclear medicine physician, board-certified with 13 and 8 y of PET/CT experience, respectively.
The summation images used visual assessment in axial, sagittal, and coronal views. All 68Ga-PSMA-11–avid foci with higher uptake than adjacent renal parenchyma were considered visually suggestive of malignancy.
Dynamic PET data analysis was performed using the PMOD software (PMOD Technologies Ltd.). For dynamic PET/CT, a fused axial section at an anatomic level corresponding to known renal lesions was chosen, and a 3D volume of interest was created on the axial section of the fused PET/CT scan, then manually adjusted to encompass the maximum available lesion size in all 3 planes. Two additional volumes of interest were outlined for sampling the abdominal aorta and background activity, predefined as the liver parenchyma. Time–activity curves were generated for the mean activities of each volume of interest, then fitted by a linear regression function.
The 2-compartment pharmacokinetic model was used to simplify 68Ga-PSMA-11 disposition in plasma and highly perfused tissue, assuming instantaneous mixing in the bloodstream (12). Changes in 68Ga-PSMA-11 plasma concentration are equivalent to changes in tissue concentrations; dosing, sampling, and elimination occur from the central compartment.
The following parameters were assessed as potential predictors of tumor histology: K 1 = perfusion-related transfer coefficient from the plasma to the tumor (mL/cm/min); K 2 = rate coefficient of washout from the tumor to the plasma (L/min); SUVmean and SUVmax; and tumor-to-background ratio (i.e., tumor SUVmean/liver tissue SUVmean; L:B). A threshold of 43% was used to calculate SUVmean.
Histologic Analysis
All samples were evaluated using light microscopy and immunohistochemistry. Tumor type and subtype were determined by 2 senior pathologists. The expression of PSMA on tumor vessels was evaluated by immunohistochemistry using 2 4-mm tissue slides from formalin-fixed, paraffin-embedded blocks of nonnecrotic tumor areas. Immunostaining was performed using a monoclonal anti-PSMA antibody (NCL-L-PSMA; Novocastra, Leica Biosystems) at a 1:100 dilution on an automated Ventana BenchMark XT slide stainer (Ventana Medical Systems, Inc.). The site (tumor neovasculature or tumor cell cytoplasm) and intensity of PSMA staining (“strong” [dark and diffuse], “moderate” [diffuse bright or focal intense], “weak” [bright and focal], or “absent”) were determined. A prostatic adenocarcinoma slide was used as an internal control.
Statistical Analysis
Statistical analysis included descriptive analysis (median and interquartile range [IQR]) for continuous and categoric variables, proportions for discrete variables, and comparative tests (Fisher exact test for discrete variables; Mann–Whitney test for ordinal and continuous variables). All analyses were performed using Stata version 16.0 (Stata Corp.). To evaluate the accuracy of K 1 and K 2 in determining the presence or lack of malignant tumors, receiver operating characteristic curves were drawn, and the area under the curve (AUC) was calculated using MedCalc Statistical Software (version 19.4.0).
RESULTS
Twenty-seven consecutive patients diagnosed with 29 enhancing renal tumors between August 2018 and December 2019 were included in the analysis. The patients’ median age was 66 y (IQR, 54–72), and 19 of 27 (70%) were males. Two patients had bilateral synchronous tumors. Partial and radical nephrectomy were applied to 20 of 27 (74%) and 5 of 27 (19%) patients, respectively. Two patients underwent renal mass biopsy without consecutive surgery (one had oncocytoma and the other pursued active surveillance for low-grade ccRCC). Median time interval between DPSMA and surgery was 32 d (IQR, 11–78).
Most lesions (24/29, 83%) were malignant and the rest (5/29, 17%) were benign. Of malignant lesions, 18 of 29 (62%) were ccRCC, 4 of 29 (14%) were papillary (pRCC), and 2 of 29 (7%) were chRCC. Most ccRCCs (14/18, 78%) were low grade (World Health Organization/International Society of Urological Pathology [WHO ISUP] grade I/II), and 4 (22%) were high grade (WHO ISUP III). Among the benign lesions, 2 were oncocytomas, 2 were lipid-poor angiomyolipomas, and 1 was a mixed epithelial and stromal tumor. Table 1 summarizes the patient and tumor characteristics.
Demographics and Clinical Characteristics of 27 Patients with 29 Renal Masses
Association Between DPSMA and Clinico-Histologic Features
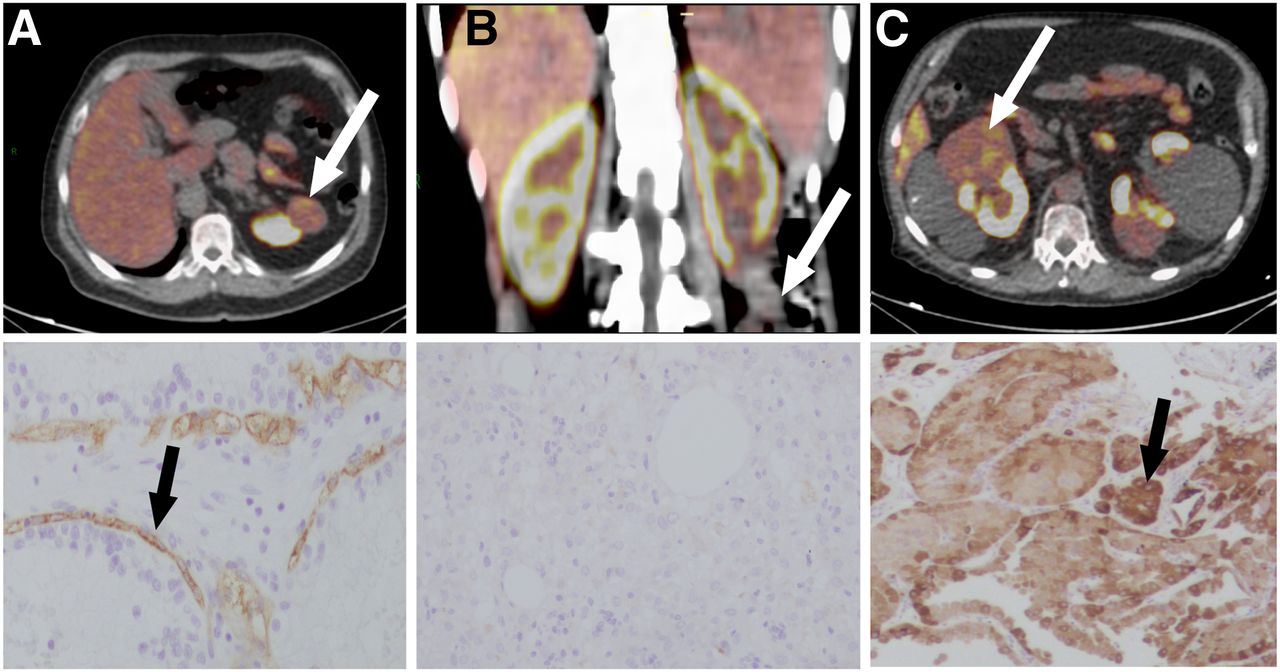
68Ga-PMSA-11 uptake was subjectively visualized in 17 of 29 (59%) lesions with no significant difference between benign and malignant lesions (P = 0.9, Fig. 1). Median SUVmean of benign and malignant lesions was 2.3 (IQR, 2.2–2.7) and 6.8 (IQR, 4.2–10.1), respectively (P = 0.009). Median SUVmax of benign and malignant lesions was 3.8 (IQR, 3.3–4.5) and 9.4 (IQR, 5.4–15.8), respectively (P = 0.015). The L:B ratio of benign and malignant lesions was 0.36 (IQR, 0.34–0.52) and 1.18 (IQR, 0.67–1.73), respectively (P = 0.01). The clinical stage was also associated with SUVmean (P = 0.03) and marginally associated with SUVmax (P = 0.06). A comparison between benign and malignant renal masses is presented in Table 2.

68Ga-HBED-CC-11-PSMA–fused PET/CT and corresponding histopathologic PSMA staining. (A) Tracer uptake and moderate renal neovasculature staining in WHO ISUP 2 ccRCC. (B) No uptake and no staining in lipid-poor angiomyolipoma. (C) Tracer uptake and strong cytoplasmatic staining in oncocytoma. White arrows = renal mass; black arrows = PSMA staining. Reduced from ×200.
Dynamic 68Ga-PSMA-11 PET Parameters and PSMA Immunohistochemistry of Benign Versus Malignant Renal Masses
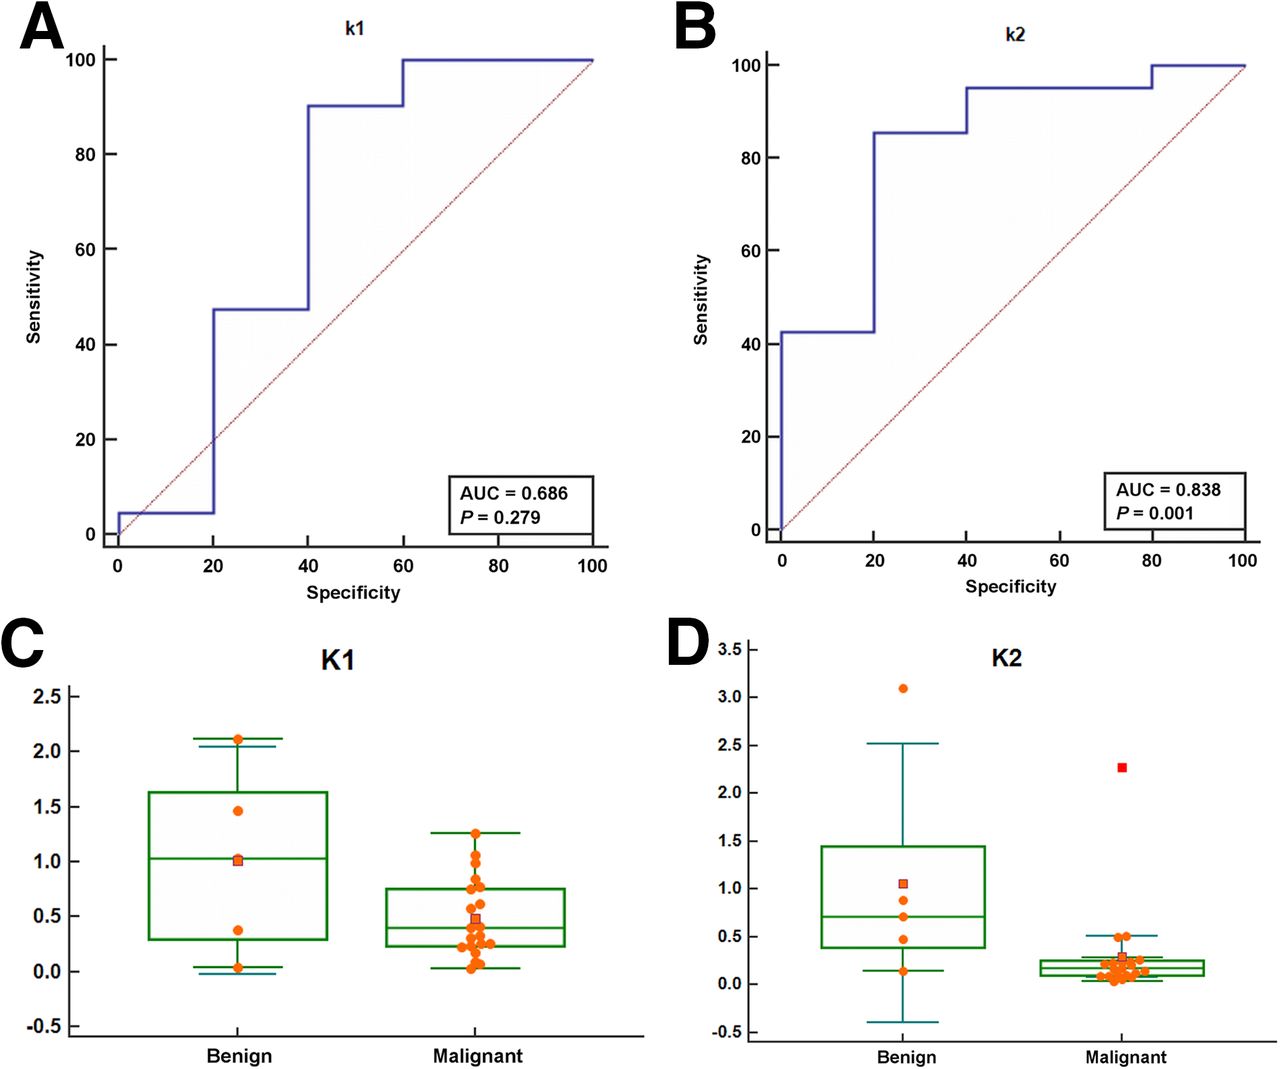
The median washout coefficient, K 2, was significantly lower in malignant than benign lesions (0.18 vs. 0.7, P = 0.02). No differences between malignant and benign lesions were found in the perfusion coefficient, K 1 (P = 0.2). Figure 2 shows the receiver operating characteristic curves of K 1 and K 2. The area under the curve was 0.68 (95% CI, 0.47–0.85) for K 1 and 0.83 (95% CI, 0.64–0.95) for K 2. Among malignant lesions, K 2 was significantly lower in ccRCC and pRCC than in chRCC (0.16 vs. 1.4, P = 0.02).

ROC curves and box plot of perfusion coefficient K 1 (A, C) and washout coefficient K 2 (B, D) as predictors of benign versus malignant histology. ROC = receiver operating characteristic.
No differences were found between oncocytoma and RCC in their static parameters SUVmean and SUVmax (P = 0.12 and 0.18, respectively), but the dynamic parameters, K 1 and K 2, were lower in RCC than in oncocytoma. (K 1: 0.4 [IQR, 0.2–0.7] vs. 1.2 [IQR, 1–1.5], P = 0.03; K 2: 0.18 [IQR, 0.1–0.24] vs. 0.79 [IQR, 0.71–0.88], P = 0.03; Fig. 3).

Linear fitted time–activity curves of 68Ga-HBED-CC-11PSMA dynamic PET/CT for localized renal mass in same patients as in Figure 1. (A) WHO ISUP 2 ccRCC (K 1 = 0.4, K 2 = 0.18). (B) Lipid-poor angiomyolipoma (K 1 = 2.12, K 2 = 3.1). (C) Oncocytoma (K 1 = 1.2, K 2 = 0.79). Green dots = real activity at the determined time; blue line = γ-fit of curve.
PSMA Immunohistochemistry
Overall, PSMA expression was observed in 22 of 29 (76%) specimens, with positive staining in 20 of 24 malignant lesions and 2 of 5 benign lesions (P = 0.04). All 4 malignant lesions without staining were low-grade tumors: 2 ISUP grade 1 ccRCC, 1 chRCC, and 1 pRCC. The only benign lesions that showed PSMA expression were oncocytomas (Fig. 1).
Although PSMA expression was noticed mostly in the endothelium of tumor vasculature, cytoplasmatic expression was observed in 2 pRCCs, 1 chRCC, and 2 oncocytomas. We also found differences in the associations between staining patterns and PSMA PET parameters: cytoplasmatic staining was associated with the washout coefficient K 2 (P = 0.01) but not with the static parameters (P = 0.2; Table 2).
DISCUSSION
We investigated the potential role of DPSMA for the initial evaluation of localized renal mass. Our results demonstrate that in most malignant renal tumors 68Ga-PSMA-11 uptake was increased with slower tracer washout compared with most benign lesions. This supports further assessment of DPSMA as a potential tool in evaluating localized renal masses.
Before 68Ga-PSMA PET was available, immunohistochemical analyses confirmed the expression of PSMA in benign and malignant extraprostatic tissues (13). PSMA was detected in proximal tubules of the kidney and in the vasculature of several types of renal lesions (14).
The initial evaluation of 68Ga-PSMA PET for RCC was in the metastatic setting (13–15). In a prospective study of 10 patients who underwent a systemic evaluation, 68Ga-PSMA PET accurately detected metastases missed by conventional CT. Of 35 biopsy-proved RCC sites testing true-positive on 68Ga-PSMA PET, 11 were false-negative on CT. Information obtained by 68Ga-PSMA PET altered the management of 2 patients. Importantly, 8 of 10 patients had ccRCC, whereas 2 had pRCC and an unclassified tumor (15).
The reported detectability of nonclear cell RCC lesions on 68Ga-PSMA PET was lower than that of ccRCC. An evaluation of 8 patients with metastatic nonclear cell RCC who underwent imaging with PSMA [18F]DCFPyL PET/CT, found that only 10 of 73 (14%) metastatic lesions had a definitive radiotracer uptake above background. None of the lesions missed by conventional imaging were detected by PET (16). Similarly, in a retrospective cohort of 8 patients with oligometastatic RCC, 68Ga PSMA-11 uptake was observed in 7 patients with ccRCC but absent in 1 patient with pRCC (17).
Current literature regarding using 68Ga-PSMA PET for evaluating localized renal mass is scarce, with data extrapolated from case series of metastatic patients (Table 3). Sawicki et al. described 5 primary RCC (3 ccRCC, 1 pRCC, and 1 chRCC) in a retrospective case series of 6 patients with metastatic disease (18). Although all primary tumors were PSMA-avid, due to PSMA expression in the proximal tubules of the normal parenchyma, the tumor–to–background SUVmax ratio was low. Thus, the physiologic PSMA uptake in the kidneys limited the visualization of primary RCC, and the authors concluded that 68Ga-PSMA PET does not have a role in the evaluation of primary renal masses. However, a comparison of 68Ga-PSMA PET parameters between benign and malignant renal masses is not possible in a series of metastatic patients.
Summary of Literature Use of PSMA PET for Evaluation of Primary Renal Lesions
Although we did not find differences in visual tracer uptake (P = 0.9), significantly higher values of static 68Ga-PSMA-11 PET parameters (SUVmax, SUVmean, and L:B SUVmean) were recorded in malignant compared with benign lesions. Although angiomyolipomas and mixed epithelial and stromal tumors showed no 68Ga-PSMA-11 uptake and no PSMA staining, oncocytomas demonstrated substantial PSMA avidity. Furthermore, in line with previous reports (16,17), pRCC and chRCC showed lower static 68Ga-PSMA-11 PET values than ccRCC.
The differences observed in the kinetic parameters of 68Ga-PSMA-11 PET are important findings. The lower values of the washout coefficient (K 2) in malignant lesions implies that 68Ga-PSMA-11 efflux is decreased in these lesions compared with benign lesions (Figs. 2 and 3). Interestingly, no differences were found between malignant and benign lesions in the transport coefficient (K 1). In their investigation of dynamic 18F-FDG PET/CT, Nakajima et al. found no significant difference in early 18F-FDG accumulation between ccRCC and nonccRCC, but a higher signal was observed in ccRCC in the late phase (19). This may imply a faster tracer washout in benign lesions, as we observed. Even in a direct comparison between ccRCC and oncocytoma, we found lower K 2 in the tumor tissue.
This diverse kinetics may be related to the heterogeneity of PSMA expression. Although PSMA expression in the neovasculature of RCC is well documented, nonuniform cytoplasmatic tumoral staining has been reported. Some authors did not find cytoplasmatic PSMA staining in renal tumors (13,14), whereas others found focal or strong staining (20,21). We observed weak cytoplasmatic staining in some papillary and low-grade RCC and strong cytoplasmic staining in oncocytomas. In accordance with previous reports, most RCCs showed vascular endothelial staining (22). It is therefore possible that distinct staining patterns play a role in DPSMA kinetics. The statistically significant association found between cytoplasmatic staining and K 2 supports this assumption.
Our study has several limitations. First, the small number of renal masses did not allow for sensitivity analyses, and potential cutoffs of DPSMA parameters could not be estimated. Second, the absolute number of analyzed benign masses was small. Nonetheless, the 2 most common benign renal masses are represented in this cohort and we provide preliminary dynamic PET and histologic data that support the value of DPSMA in differentiating these masses from malignant renal masses. Third, observer-related bias was minimized by 2 highly experienced nuclear medicine physicians and 2 dedicated pathologists who reviewed each case independently and in a masked manner. Fourth, because all patients were referred for surgery beforehand, selection bias is possible. Finally, whereas dynamic PET/CT protocols are well established in the research setting, they are not widely adopted in routine clinical practice.
Despite these limitations, this is, to our knowledge, the first prospective evaluation of DPSMA for localized stage I renal mass. With technologic advances, generating kinetic data may become a more accessible tool for clinicians. DPSMA may be a potential supplementary test to increase diagnostic confidence or an alternative for patients unable to undergo contrast CT due to renal insufficiency or severe allergic reaction to iodine.
The emergence of PSMA-based radioligand therapy in prostate cancer raises new potential applications for theranostics in other tumors as well (23). On binding to PSMA-expressing cancer cells, the radiolabeled compound is internalized and β-radiation induces cellular damage (24). However, radioligand distribution is a process that varies substantially between malignant and benign tumors, and among patients. The dynamic acquisition allows for a more robust measurement of radioligand kinetics and may, theoretically, assist in optimizing future treatments.
CONCLUSION
This is the first study to highlight 68Ga-PSMA-11 kinetics in localized renal masses. We observed increased tracer uptake and slower washout in malignant renal masses compared with benign ones. These observations were further supported by distinct PSMA staining patterns in these tissues. Our findings suggest that DPSMA has a potential role in the evaluation of renal masses and support further assessments in a larger patient cohort.
DISCLOSURE
No potential conflict of interest relevant to this article was reported.
KEY POINTS
QUESTION: Does dynamic 68Ga-PSMA-11 PET have the potential to serve as a diagnostic tool in the evaluation of localized renal mass?
PERTINENT FINDINGS: In this prospective case series of patients with newly diagnosed renal masses, we found statistically significant differences in dynamic 68Ga-PSMA-11 PET parameters between benign and malignant lesions. This was further supported by differences in PSMA staining patterns in the final surgical specimen.
IMPLICATIONS FOR PATIENT CARE: Dynamic 68Ga-PSMA-11 PET may potentially be a supplementary test to increase diagnostic confidence of localized renal mass or an alternative for patients unable to undergo contrast CT.
Footnotes
Published online Oct. 23, 2020.
- © 2021 by the Society of Nuclear Medicine and Molecular Imaging.
REFERENCES
- Received for publication June 10, 2020.
- Accepted for publication September 23, 2020.


