


Abstract
Previous histopathologic and animal studies have shown axonal impairment and loss of connectivity of the nigrostriatal pathway in Parkinson disease (PD). However, there are conflicting reports from in vivo human studies. 11C-dihydrotetrabenazine (11C-DTBZ) is a vesicular monoamine type 2 transporter PET ligand that allows assessment of nigrostriatal presynaptic dopaminergic terminal integrity. Correlational tractography based on diffusion MRI can incorporate ligand-specific information provided by 11C-DTBZ PET into the fiber-tracking process. The purpose of this study was to assess the in vivo association between the integrity of the nigrostriatal tract (defined by correlational tractography) and the degree of striatal dopaminergic denervation based on 11C-DTBZ PET. Methods: The study involved 30 subjects with mild to moderate PD (23 men and 7 women; mean age, 66 ± 6.2 y; disease duration, 6.4 ± 4.0 y; Hoehn and Yahr stage, 2.1 ± 0.6; Movement Disorder Society [MDS]–revised Unified Parkinson Disease Rating Scale [UPDRS] [I–III] total score, 43.4 ± 17.8) and 30 control subjects (18 men and 12 women; mean age, 62 ± 10.3 y). 11C-DTBZ PET was performed using standard synthesis and acquisition protocols. Correlational tractography was performed to assess quantitative anisotropy (QA; a measure of tract integrity) of white matter fibers correlating with information derived from striatal 11C-DTBZ data using the DSI Studio toolbox. Scans were realigned according to least and most clinically affected cerebral hemispheres. Results: Nigrostriatal tracts were identified in both hemispheres of PD patients. Higher mean QA values along the identified tracts were significantly associated with higher striatal 11C-DTBZ distribution volume ratios (least affected: r = 0.57, P = 0.001; most affected: r = 0.44, P = 0.02). Lower mean QA values of the identified tract in the LA hemisphere associated with increased severity of bradykinesia sub-score derived from MDS-UPDRS part III (r = −0.42; P = 0.02). Cross-validation revealed the generalizability of these results. Conclusion: These findings suggest that impaired integrity of dopaminergic nigrostriatal nerve terminals is associated with nigrostriatal axonal dysfunction in mild to moderate PD. Assessment of nigrostriatal tract integrity may be suitable as a biomarker of early- or even prodromal-stage PD.
- Parkinson disease
- dopaminergic nigrostriatal connectivity
- 11C-DTBZ PET
- correlational tractography
- diffusion MRI
A key pathologic hallmark of Parkinson disease (PD) is the loss of dopamine-producing neurons in the substantia nigra (SN) pars compacta in the setting of α-synucleinopathy (1–3). This progressive pathologic process in the SN results in dopaminergic losses in the striatum that associate with disease-specific motor impairments (2,3). However, less is known about concurrent degeneration of axons that project to the striatum.
There are a multitude of PET and SPECT radiotracers to assess nigrostriatal presynaptic terminal integrity (4). 11C-dihydrotetrabenazine (11C-DTBZ) is a radioligand for the vesicular monoamine transporter type 2, which is the protein responsible for pumping monoamines from cytosol into synaptic vesicles. 11C-DTBZ is particularly useful as a marker of the striatal dopaminergic terminal since it is less influenced by compensation or pharmacologic regulation (5) and has high dopaminergic specificity in the striatum (6). Various diffusion MRI (dMRI) methods are available that allow for identification of white matter tracts and provide metrics to assess their microstructural integrity. These methods include diffusion tensor imaging (7), generalized q-sampling imaging (8), and q-space diffeomorphic reconstruction (9).
Previous histopathologic and animal studies suggest that synaptic and axonal abnormalities may even occur before degenerative loss of neuronal cell bodies in PD (10). However, there have been conflicting reports about the association between striatal dopaminergic deficits and nigrostriatal tract integrity. Two diffusion tensor imaging and dopamine transporter SPECT imaging studies with large patient cohorts found that fractional anisotropy (FA) in the SN decreased with increasing dopaminergic deficits as measured by putaminal dopaminergic binding ratios (11,12). A recent clinicopathologic study, however, found no association between striatal dopamine transporter binding and the number of postmortem striatal axons in 14 confirmed PD subjects (13). The latter finding may be explained by the relatively long interval between in vivo imaging and ex vivo pathologic assessments (5.2 ± 3.4 y). Two other studies using diffusion tensor imaging–based brain tractography, one in 50 subjects with PD (14) and the other in 16 nonhuman primates with unilateral nigrostriatal 1-methyl-4-phenyl-1,2,3,6-tetrahydropyridine–induced injury (15), did not find a significant correlation between PET (15) or SPECT (14) and diffusion measures such as FA, axial, radial, or mean diffusivities. In these 2 studies, probabilistic tracking was performed to identify the nigrostriatal tract in each subject using dMRI followed by linear regressions to correlate diffusion measures and the molecular imaging measures.
We postulate that tractographic reconstruction of the nigrostriatal dopaminergic pathway by simultaneously integrating additional information provided by PET or SPECT measurements of striatal presynaptic dopaminergic terminals may help to identify a more reliable nigrostriatal dopaminergic tract.
Correlational tractography has recently been developed as a novel alternative method that adopts the correlation-tracking paradigm, using a nonparametric permutation test to search for the association of white matter fibers with a specific variable of interest (16). Therefore, it is possible to incorporate PET molecular information into the fiber-tracking process so that the pathway includes only those white matter fibers that are specifically related to the PET information. Correlational tracking is achieved using a q-space diffeomorphic reconstruction algorithm (8), which is a generalization of the generalized q-sampling imaging method and allows tractography in a common stereotactic space (e.g., Montreal Neurological Institute [MNI] space). One quantitative measure that can be derived from generalized q-sampling imaging is quantitative anisotropy (QA) (8). QA measures the density of anisotropic diffusion water, a metric of integrity for each fiber population (9), and may provide a more reliable microstructural integrity metric than standard diffusion measures (17,18). Correlational tracking of nigrostriatal dopaminergic fibers with QA can be used in a first step to identify a group-based tract template using the PET information of the dopaminergic presynaptic terminal. In a second step, the mean QA extracted from each subject across the template can be used as a measure of the whole-tract integrity, suitable for assessing its association with the dopaminergic nerve terminal at the individual level.
The purpose of the present study is to assess the association between nigral white matter projections and the degree of striatal dopaminergic denervation, using combined analysis based on in vivo 11C-DTBZ PET and dMRI correlational tractography using QA. We hypothesize that the degree of striatal dopaminergic degeneration is associated with compromised integrity of nigral white matter tracts in early PD.
MATERIALS AND METHODS
Subjects
Thirty subjects with PD (23 men and 7 women; mean age, 66 ± 6.2 y) were selected from ongoing studies at our center. Participant selection was based on 3 criteria. The first was inclusion of only subjects with mild to moderate PD (Hoehn and Yahr stage ≤ 3) in order to avoid a possible floor effect associated with severe nigrostriatal dopaminergic denervation. The second was high-quality reconstruction of dMRI, as evaluated by the R2 value between the subject QA map and the QA MNI map (>0.70). The third was an interval of 2 mo or less between clinical examinations and neuroimaging assessments to ensure no significant clinical interval changes. The study also included 30 age- and sex-matched healthy control subjects (18 men and 12 women; mean age, 62 ± 10.3 y), with constraints similar to those described for the first two criteria.
All patients met the U.K. Parkinson Disease Society Brain Bank clinical diagnostic criteria for PD (19). PD was further confirmed by the presence of a typical pattern of striatal dopaminergic denervation on 11C-DTBZ brain PET (6). The Movement Disorder Society (MDS)–revised Unified Parkinson Disease Rating Scale (UPDRS) examination was performed on all PD subjects to provide measures of clinical symptom severity (20). We used the bradykinesia subscore derived from MDS-UPDRS part III, which is the best cardinal motor predictor of nigrostriatal dopaminergic deficit in PD (21) to examine clinical correlates of the correlational tractography findings. The motor examination was performed in the dopaminergic medication–“off” state on the morning after overnight withdrawal, except for 1 de novo patient. In 19 PD subjects, clinical motor symptoms were predominantly on the right side of the body, and in the other 11 PD subjects, these symptoms were predominantly on the left side. Table 1 summarizes the main demographic and clinical characteristics of all participants.
Demographic and Clinical Characteristics of PD and Control Subjects
The study was approved by the Institutional Review Boards of the University of Michigan School of Medicine and Veterans Affairs Ann Arbor Health Care System. Written informed consent was obtained from all subjects before any research procedures.
11C-DTBZ PET Acquisition and Preprocessing
PET imaging was performed in 3-dimensional mode using an ECAT Exact HR+ tomograph (Siemens Molecular Imaging, Inc.). A detailed description of the PET image preprocessing can be found elsewhere (22).
11C-DTBZ (no-carrier-added [+]-α-11C-DTBZ) was prepared using high-specific-activity 11C-methyl iodide as reported previously (23). 11C-DTBZ PET scans were performed using a bolus–infusion protocol acquiring 15 emission scans over 60 min (4 × 30 s, 3 × 1 min, 2 × 2.5 min, 2 × 5 min, and 4 × 10 min), with a priming bolus of 55% followed by continuous infusion of the remaining 45% over the study duration using a dose of 555 MBq.
All dynamic PET imaging frames were spatially coregistered within subjects with a rigid-body transformation to reduce the effect of subject motion during the imaging session (24). These motion-corrected PET frames were spatially coregistered to anatomic MR images using SPM8 software (Wellcome Trust Centre for Neuroimaging). IDL image analysis software (Research Systems, Inc.) was used to manually trace volumes of the striatum (and subregions) of both cerebral hemispheres on the MRI scan. Striatal 11C-DTBZ distribution volume ratio (DVR), a measure of dopaminergic binding, was estimated using the Logan graphical analysis method (25), with the striatal time–activity curves as the target regions and the neocortex as the reference input.
MRI Acquisition and Preprocessing
All subjects underwent high-resolution structural brain MRI (3-dimensional T1-weighted) for anatomic coregistration with the PET scan. MRI was performed on a 3-T Achieva system (Philips) using an 8-channel head coil. A detailed description of the structural brain MRI acquisition parameters can be found elsewhere (22).
During the same visit, dMRI was obtained for correlational tractography (repetition time/echo time, 8,700/70 ms; 1.75 × 1.75 × 2 mm; 15 diffusion sampling directions; b-value, 800 s/mm2). In a subsequent step, each volume was registered to the B0 volume using an affine transform with mutual information as a cost function. Preprocessing was then performed in MRtrix (version 3.0_RC3) (26), including denoising (27), removal of Gibbs ringing artifacts (28), and correction of motion and eddy-current distortion (29). During the distortion correction, outlier replacement (30) and slice-to-volume correction of intravolume movement (31) was performed.
Quality control of the preprocessed dMRI data was performed using the DSI Studio toolbox (http://dsi-studio.labsolver.org). The b-table was checked by an automatic quality control routine to ensure its accuracy. Image dimension, resolution, and b-table were consistent between repeated scans. The neighboring diffusion-weighted imaging correlation was high and similar across all dMRI volumes (0.89 ± 0.01), indicating very good quality for the preprocessed dMRI data relative to motion artifacts and low signal-to-noise ratio.
Neurologic examinations, PET, and MRI were performed within a 1-wk interval in 49 (25 controls) of 60 study subjects (82%). In 4 subjects (2 controls) this interval was 1 mo, and in the remaining 7 subjects (2 controls) it was 2 mo.
Connectometry Databases
For correlational tractography analysis, 3 connectometry databases were created using DSI Studio. The first and second databases included each study group (PD and control databases, respectively), and the third included a combined group to explore whether the analysis of this group provides more robust estimates of nigrostriatal tracts.
In the PD group, we first flipped (right to left) the dMRI images of the 11 patients with a left predominance of clinical symptoms. This was done to create a more uniform sample given the typical clinical motor symptom and striatal 11C-DTBZ DVR asymmetry in PD, at least in early disease stages (6). Therefore, the left hemisphere was represented as the most affected (MA) hemisphere in all patients and the right hemisphere as the least affected (LA).
The dMRI preprocessed data in each group were reconstructed in the MNI space using q-space diffeomorphic reconstruction to obtain the spin distribution function (8,9). q-space diffeomorphic reconstruction first calculates QA mapping (defined on spin distribution function) in the native space and then normalizes it to the MNI QA map. The reconstruction was performed using a customized template of 62 control healthy subjects from our laboratory’s ongoing studies (age, 64.6 ± 9.8 y; 31 women and 31 men), different from the control group described above, since the use of an age-matched template is more appropriate than the DSI studio default template (based on young adults only). A diffusion sampling length ratio of 0.5 was used. The diffusion was quantified using restricted diffusion imaging (32). QA was extracted as the local connectome fingerprint (17) and used in the correlational tractography.
The quality of reconstruction was tested in all subjects using the R2 value between the subject QA map and the QA MNI map. The average of R2 was 0.82 ± 0.02 (minimum, 0.74; maximum, 0.85), representing a very good registration quality, in accordance with the DSI Studio standard.
Customized Template for Fiber Tracking
To create the group average template from the 62 control healthy subjects, a diffusion tensor imaging scheme was used and 15 diffusion sampling directions were acquired. The b-value was 800 s/mm2. The in-plane resolution was 1.75 mm. The slice thickness was 2 mm. The b-table was checked by an automatic quality control routine to ensure accuracy. The diffusion data were reconstructed in the MNI space using q-space diffeomorphic reconstruction (8) to obtain the spin distribution function. A diffusion sampling length ratio of 1.25 was used. The diffusion was quantified using restricted diffusion imaging (32). A deterministic fiber tracking algorithm (18) was used, with a seeding region placed at the whole brain. The QA threshold was randomly selected. The angular threshold was randomly selected from 15 degrees to 90 degrees. The step size was randomly selected from 0.5 voxel to 1.5 voxels. The fiber trajectories were smoothed by averaging the propagation direction with a percentage of the previous direction. The percentage was randomly selected from 0% to 95%. Tracks shorter than 30 mm or longer than 300 mm were discarded. In total, 100,000 seeds were placed.
Correlational Tractography Combined with 11C-DTBZ PET
Selecting the Functional Striatal Region for Correlational Tracking
To determine the optimal DTBZ values for correlational tracking of the PD, control, and combined groups, an exploratory analysis of the 11C-DTBZ DVRs of the whole striatum and its subregions was performed. We used striatal subregions based on a previous work in our laboratory (33). Requirements for the 11C-DTBZ DVRs were to meet the following 4 criteria. First, the values must follow a normal distribution or at least 1 histogram with a single peak in the combined group. Otherwise, it would be more appropriate to perform the analysis only in separate groups. This criterion ruled out the whole striatum for analysis since in both hemispheres its histograms had 2 peaks (Supplemental Fig. 1; supplemental materials are available at http://jnm.snmjournals.org). Second, the values of the selected subregion must be collinear with the values of the whole striatum (the dopaminergic terminal). Third, the values must have a similar coefficient of variation in both hemispheres. This criterion was to ensure that the possible different results in each hemisphere were not due to differences in the variability of 11C-DTBZ DVRs. Fourth, left–right asymmetry of the values should be as small as possible in the PD group. This criterion served to avoid the chance that the possible asymmetry in the tracts was due only to the asymmetry in the 11C-DTBZ DVRs rather than to the relationship of each tract with its dopaminergic terminal. The results of this exploratory analysis showed that the anteroventral striatum (AVS) was the best striatal subregions in meeting all 4 criteria: normal distribution in both hemispheres (Supplemental Fig. 1); collinearity with the whole striatum (Supplemental Tables 1–3); similar coefficient of variation (Supplemental Tables 4–6); and the lowest mean asymmetry (Supplemental Fig. 2). It is important to note that the relevance of the AVS was not due to its anatomic location but rather to its functional value in guiding the tract reconstruction with dopaminergic specificity.
Tracking the Nigrostriatal Dopaminergic Pathway
The connectometry databases were used to track the correlation of AVS 11C-DTBZ DVR on QA using a deterministic fiber-tracking algorithm (18), with the SN as the seeding region and the whole striatum as the terminative region, corresponding to each cerebral hemisphere. Linear regression models were performed for each cerebral hemisphere with a T-score threshold of 3. The SN and the striatum were defined using the Atlas of the Basal Ganglia (34). Age and sex were considered in the linear regression as nuisance covariates. Topology-informed pruning was conducted with 2 iterations to remove false connections (35). All tracts generated from bootstrap resampling were included. A false-discovery-rate threshold of 0.05 was used to select tracts. The seeding number for each permutation was 100,000. To estimate the false discovery rate, 4,000 randomized permutations were applied to the group label to obtain the null distribution of the tract length. Tracts identified in each hemisphere were defined as their respective tract templates. Subsequently, the mean QA across the whole template (of each hemisphere) was extracted in every subject and used to assess the correlation with the corresponding whole-striatum 11C-DTBZ DVRs. Tract volumes were also extracted.
We performed a complementary analysis by repeating the same analyses described above using the dMRI FA index, as this metric has been commonly used in prior studies. For this analysis, the T-score threshold was lowered to 2 to track the correlation with the AVS 11C-DTBZ DVR on FA because no tracts showed a significant correlation using a more conservative T-score threshold. For both QA and FA analyses, the resulting tracts were identified using the HCP842 tractography atlas (36).
The Shapiro–Wilk W test showed a normal distribution for all main study variables (Supplemental Table 7).
Statistical Analysis
Association Between Tract Integrity and Dopaminergic Terminal
Pearson correlation was used to assess the association of mean QA values across the identified tract templates with whole-striatum 11C-DTBZ DVRs.
Cross-Validation
To assess the generalizability of the estimated tracts in the PD group, we performed a cross-validation using the leave-one-out (LOO) methodology. The training set was defined as the mean QA extracted in each PD subject from the tract template using the PD group (for each hemisphere). To get the validation element of a single PD subject, we constructed a new tract template but left that specific PD subject out. This new tract template was used to extract the mean QA from that PD subject (mean QA-LOO). This process was repeated for each of the 30 PD subjects (for each hemisphere).
As a measure of fit and to summarize the error between the data (mean QA-LOO of each PD subject) and the model (mean QA of each PD subject from the tract template using the PD group), the root-mean-squared error was used. Pearson correlation was used to assess the association of mean QA-LOO and the corresponding AVS and whole-striatum 11C-DTBZ DVRs.
Association Between Tract Integrity and Motor Symptoms (Bradykinesia)
Pearson correlation was used to evaluate the association of mean QA (and mean QA-LOO) with the MDS-UPDRS bradykinesia subscore, for both hemispheres in the PD group.
Group Comparisons
Mean QA and whole-striatum 11C-DTBZ DVRs (for each hemisphere) were compared between groups using the Student t test for independent samples. We also compared those values between hemispheres in the PD group (LA vs. MA) and in the control group using the paired Student t test. The mean QA values used for these analyses were extracted using tract templates from the combined-group analysis as no tracts were identified in the control group in separate analyses.
For comparison and complementary analysis purposes, we also performed the same statistical analyses described above (except cross-validation) for correlational tractography analysis using the FA dMRI metric.
Statistical analyses were performed using Statistica software (Stat Soft, Inc., version 8.0). The significance level was set at a P value of less than 0.05. For the 3 correlation tests (related to mean QA or mean QA-LOO) in the same hemisphere in the PD group, we computed 95% and 98.33% bootstrap CI. The latter implicitly considers the P values for multiple comparisons. For the comparison tests between groups (and between hemispheres), we considered a Bonferroni-corrected significant P value of 0.00625 (0.05/8 comparison tests).
RESULTS
Tract Templates and Association of Tract Integrity with Dopaminergic Terminals
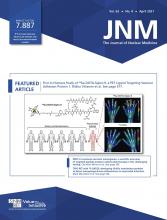
Figure 1A shows tract templates identified in the PD group. The LA hemisphere tract originated slightly below the posterior part of the SN; converged to the anterior dorsal part of the SN; traveled upward, passing very close to the subthalamic nucleus; and then turned laterally above the subthalamic nucleus, reaching a white matter region between the anterior putamen and the posterior aspect of the caudate nucleus. This tract also corresponded to a small segment of the right frontopontine tract as defined by the HCP842 tractography atlas (36). The tract volume was 1.9 cm3. The MA hemisphere tract followed a similar path, although its volume was smaller (1.02 cm3) and did not reach the striatum. The mean QA was positively correlated with the whole-striatum 11C–DTBZ DVRs in both hemispheres (Figs. 1B and 1C; Table 2).

(A) Tract templates identified in PD group in MA (left side) and LA (right side) hemispheres (overlaid on T1-weighted MR image in MNI space). (B) Mean QA (across PD template) shows positive correlation with whole-striatum 11C-DTBZ DVRs in MA hemisphere. (C) Mean QA (across PD template) shows positive correlation with whole-striatum 11C-DTBZ DVRs in LA hemisphere.
Correlation of Mean QA with Whole-Striatum 11C-DTBZ DVR and Bradykinesia Subscore in PD Group
Statistically significant tract templates could not be identified in the control group in either hemisphere. Complementary analyses in the combined group confirmed these findings in the control group (Supplemental Fig. 3).
Similar to the QA index, the analysis based on the FA index did not identify tract templates in the control group, whereas in the PD group, tract templates were identified only in the LA hemisphere (Supplemental Fig. 4A). The mean FA was positively correlated with whole-striatum 11C-DTBZ DVRs in the LA hemisphere (Supplemental Fig. 4B), but these correlations were lower than those observed using mean QA in the same hemisphere. Complementary analyses in the combined group confirmed the negative results in the control group using FA (Supplemental Fig. 5).
Cross-Validation
Figures 2A and 2B show the relation between the data and the model in the PD group in both hemispheres (MA and LA) as described above. Root-mean-squared error was low in both cases (MA, 4.52 × 10⁻⁴; LA, 4.29 × 10⁻⁴). However, the correlations of the mean QA-LOO with the whole-striatum DTBZ DVRs were significant only in the LA hemisphere (Figs. 2C and 2D; Table 3), indicating its generalizability to independent datasets.
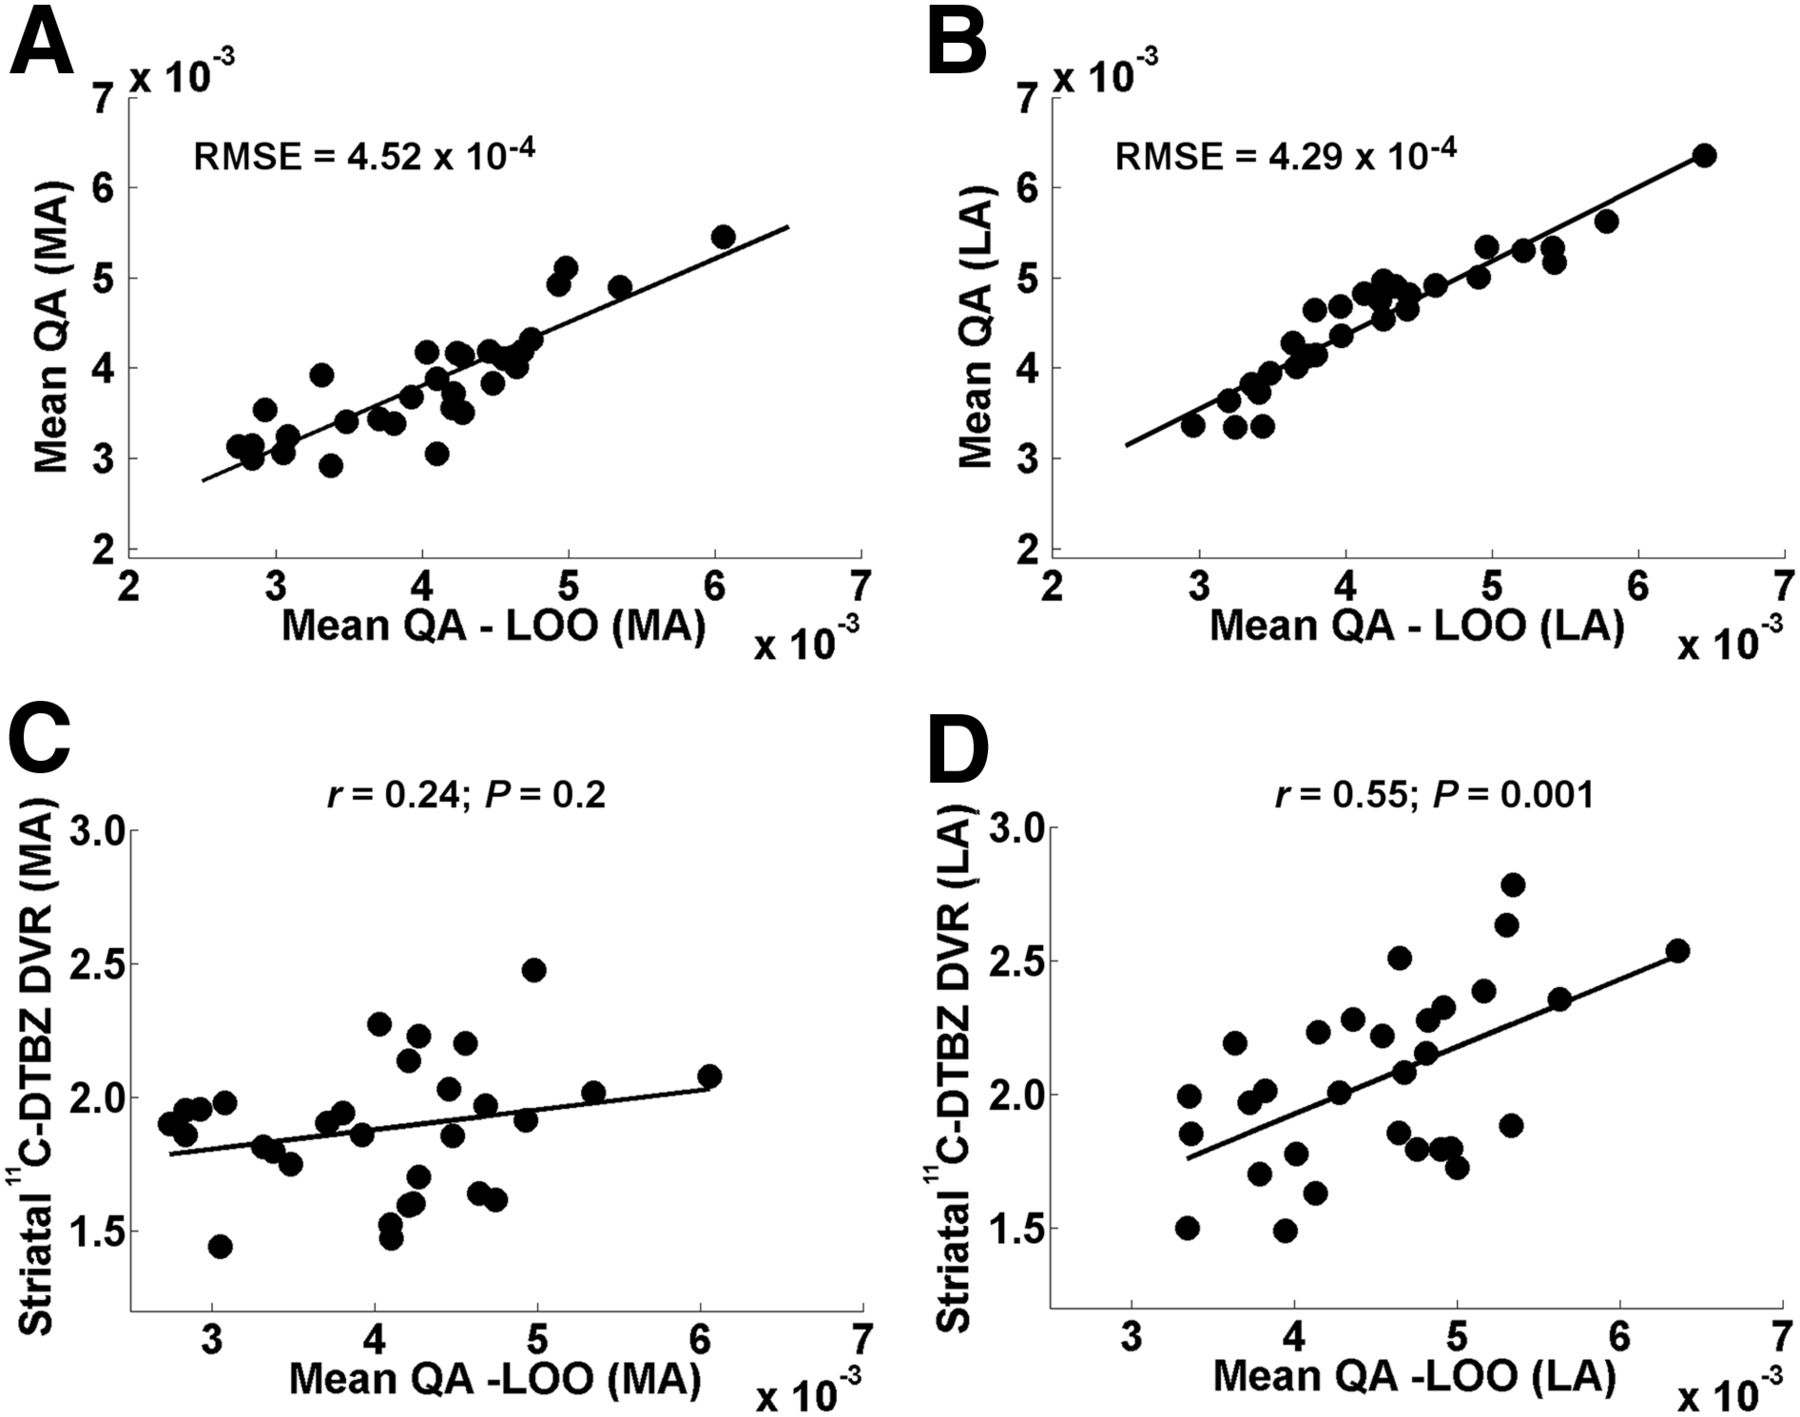
(A and B) Relation between training and cross-validation sets using LOO approach (mean QA and mean QA-LOO, respectively) in MA (A) and LA (B) hemispheres of PD subjects. Root-mean-squared error (RMSE) was used as measure of fit. (C) Mean QA-LOO did not correlate significantly with whole-striatum 11C–DTBZ DVRs in MA hemisphere. (D) Mean QA-LOO did not correlate significantly with whole-striatum 11C–DTBZ DVRs in LA hemisphere but showed significant positive correlations. MA (left) hemisphere in PD group refers to hemisphere clinically MA in PD patients.
Correlation of Mean QA-LOO with Whole-Striatum 11C-DTBZ DVR and Bradykinesia Subscore in PD Group Using Individual Tracts as Result of Cross-Validation Using LOO Approach
Association Between Tract Integrity and Bradykinesia
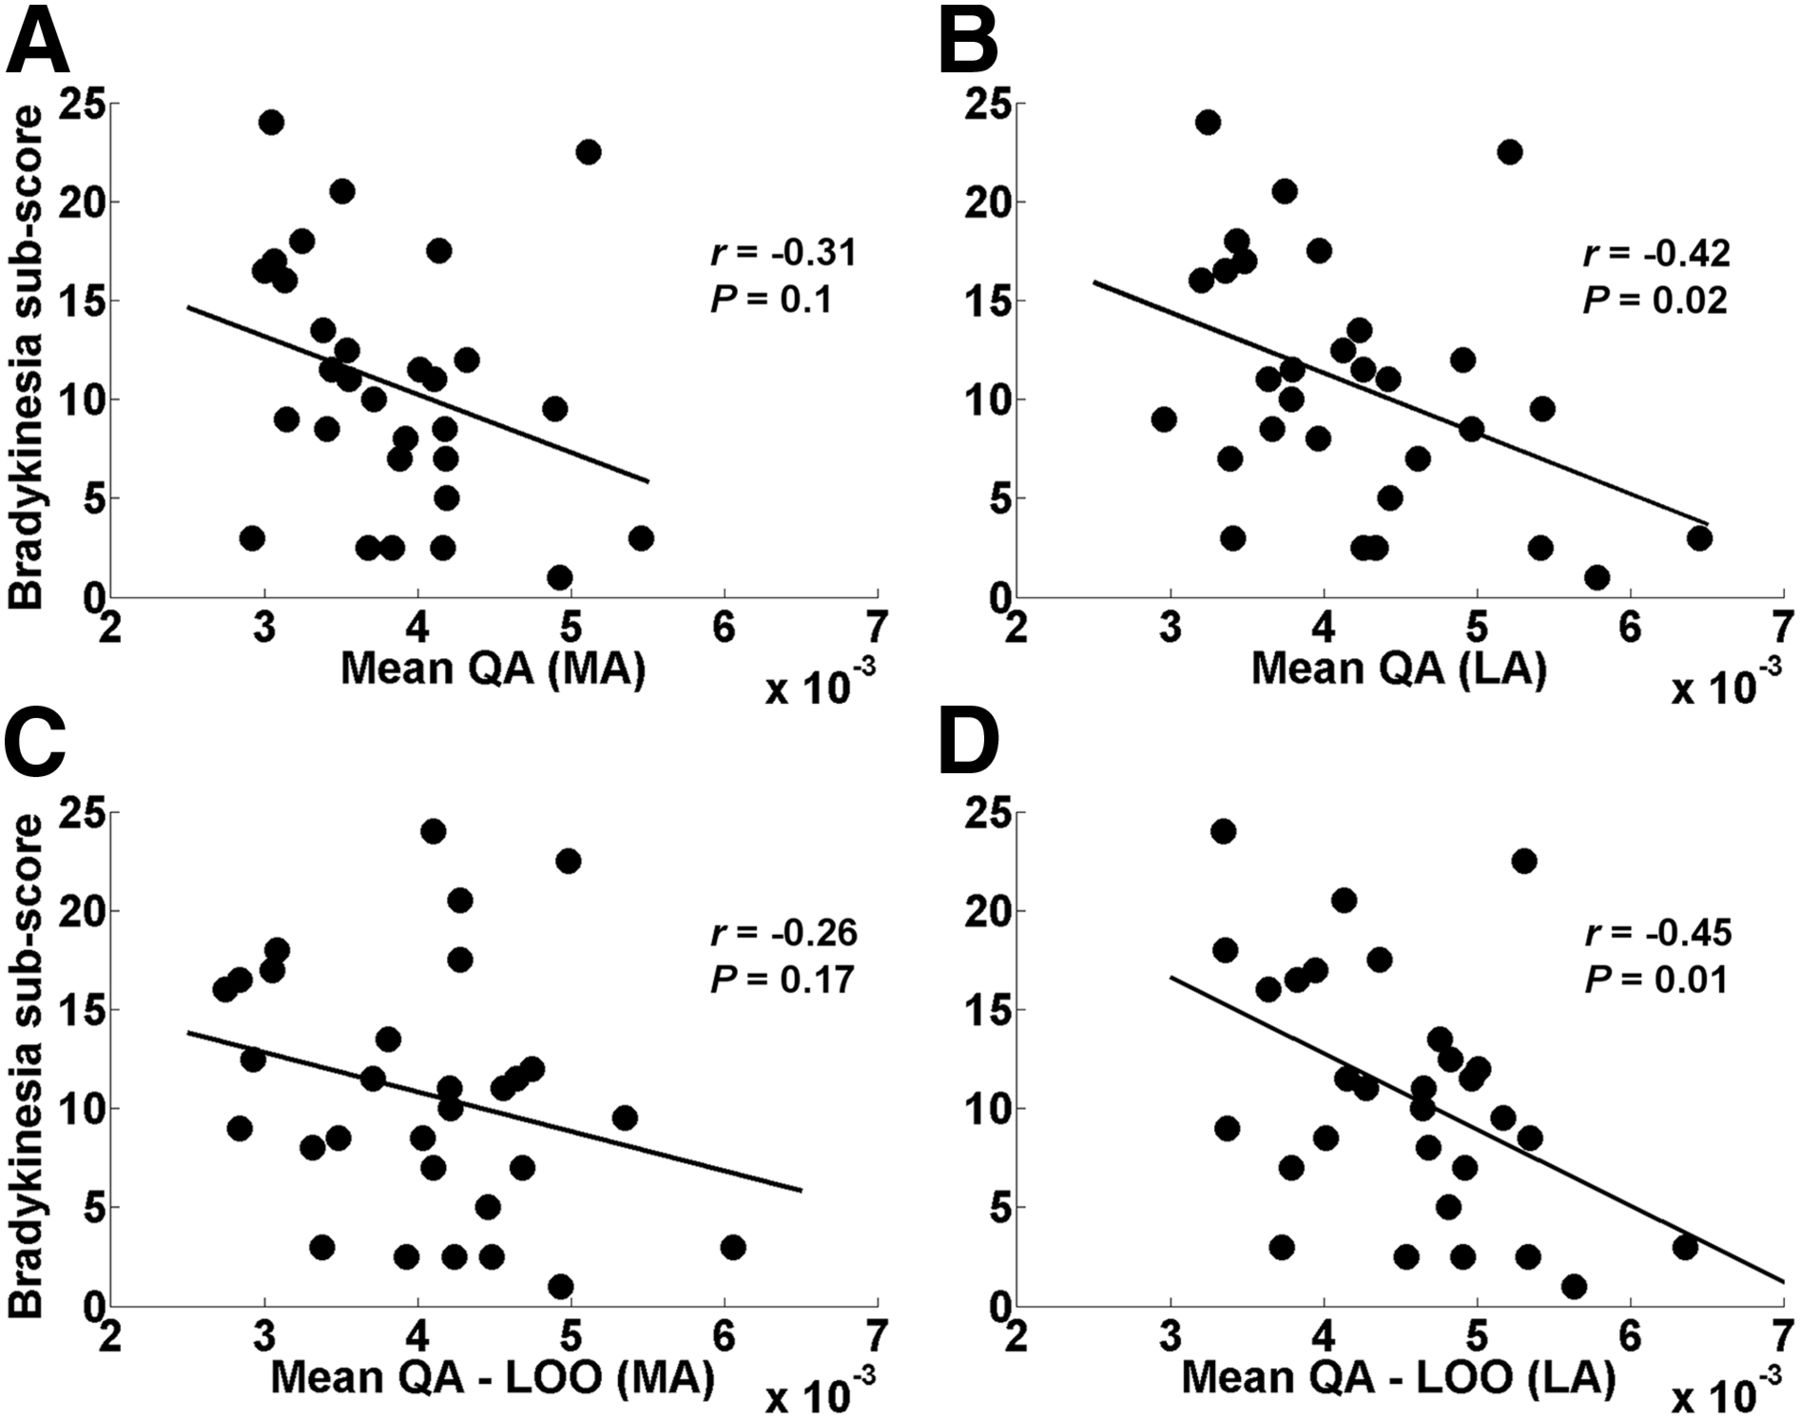
Both the mean QA and the mean QA-LOO in the LA hemisphere were significantly negatively correlated with the bradykinesia subscore of PD subjects (Figs. 3B and 3D; Tables 2 and 3). Using the mean FA, the correlation was also found in the LA hemisphere (Supplemental Fig. 6) but was much lower than the QA findings in the same hemisphere (Figs. 3B and 3D).

(A and B) Relation between mean QA and MDS-UPDRS bradykinesia subscore in MA (A) and LA (B) hemispheres of PD patients. (C and D) Relation between mean QA-LOO and MDS-UPDRS bradykinesia subscore in MA (C) and LA (D) hemispheres of PD patients. Mean QA (B) and mean QA-LOO (D) in LA hemisphere showed significant negative correlation with bradykinesia subscore. Mean QA-LOO is mean QA of individual tract of each PD patient as result of LOO cross-validation. MA (left) hemisphere in PD group refers to hemisphere clinically MA in PD patients.
Group Comparisons
Comparison with healthy controls showed that striatal PET measures were indicative of neurodegeneration in PD patients, as well as the mean QA across subjects in both hemispheres (Table 4; Supplemental Fig. 7A). There were no significant differences between hemispheres in the control group, except for the mean QA, which could be explained by the differences between the left and right tract templates of the combined group (Supplemental Fig. 3A) applied to the control group. As expected, in the PD group, striatal 11C-DTBZ DVR and mean QA were significantly higher in the LA hemisphere than in the MA hemisphere.
Comparison Between Control and PD Groups for Each Brain Hemisphere (and Interhemispheric) of Striatal 11C-DTBZ DVR and Mean QA
Using FA, there were no significant differences between PD and control groups for mean FA across subjects. Furthermore, the mean FA across the PD patients did not significantly differ between hemispheres (Supplemental Fig. 7B).
DISCUSSION
The aim of this study was to examine the association between the integrity of nigrostriatal white matter projections and striatal dopaminergic (vesicular monoamine transporter type 2) nerve terminal integrity in PD patients with mild to moderate disease severity. Integrated neuroimaging analysis using 11C-DTBZ PET and correlational tractography identified a bundle of fibers (tract) in each cerebral hemisphere in PD patients, extending from the SN to the striatum in the LA hemisphere, with a smaller tract identified in the MA hemisphere. Lower mean QA values for the identified tracts, reflecting more impaired axonal integrity, were associated with decreased striatal dopaminergic binding in both hemispheres. Moreover, the mean QA difference between the 2 hemispheres suggests a continuum from a less advanced (LA tract) to a more advanced (MA tract) stage of the disease. The integrated dMRI-PET definition of these tracts increases the reliability that the identified tracts are dopaminergic. Furthermore, the path of the LA-hemisphere tract closely resembles the known anatomy of the nigrostriatal pathway (37). Lower mean QA values for the LA-hemisphere tract were also associated with increased severity of bradykinesia clinical ratings in the PD subjects. This finding supports our interpretation of the relevance of this pathway in the pathophysiology of PD. We were able to cross-validate the LA-hemisphere tract, suggesting that our findings can be generalized. Taken together, these findings show that striatal dopaminergic degeneration is associated with the integrity of the dopaminergic nigrostriatal pathway, at least in the setting of mild to moderate dopaminergic losses in PD. Our findings also suggest that 11C-DTBZ PET may reflect axonal dysfunction in these patients.
Our findings are in line with previous observations in histopathologic and animal studies that Lewy bodies accumulate in axons and presynaptic striatal nerve terminals, resulting in axonal impairment and gradual loss of connectivity of the nigrostriatal pathway in PD (10). For example, Braak et al. showed that α-synuclein deposits were present not only in Lewy body inclusions within the cell body but also in axonal projections (38).
Our study showed the advantage of integrating information from both tractography and molecular PET data to define dopaminergic white matter fibers. Unlike prior studies using standard diffusion measures such as FA, we used QA as a measure of local fiber integrity (17). The main disadvantage of using diffusivity metrics (such as FA) is that restricted and less restricted diffusion are mixed because of Brownian motion. In contrast, q-space diffeomorphic reconstruction quantifies the density of restricted and less restricted diffusion for each fiber population (fiber-specific within a voxel), whereas in FA all fiber populations within a voxel will share the same measurement. QA as the fingerprint of the local connectome is more sensitive to individual differences than are standard diffusion measures (17). This concept is consistent with a previous study suggesting that QA may contribute to more reliable tractography (39). Notably, by using FA no tract was identified in the MA hemisphere, even using a less conservative T-score threshold, and no significant differences were found for mean FA between control and PD groups (Supplemental Fig. 7B). Our study also showed that correlational tracking using QA yielded clinically relevant correlations (bradykinesia ratings), findings that were less robust for the FA index. The use of standard tractography based on using dMRI data alone and the relative disadvantages of the standard diffusion measures may explain the negative findings of previous studies (14,15).
Our findings support the use of AVS 11C-DTBZ DVRs for correlational tracking to guide the tract reconstruction with dopaminergic specificity. The innervation of AVS not only originates from the ventral tegmental area but also includes projections from the SN (40), hence explaining the dopaminergic collinearity of the AVS with the whole striatum.
Nigrostriatal white matter tracts could not be reconstructed for the control group. This could be explained by the absence of a pathophysiologic process affecting axons in healthy older adults. Indeed, our results showed that the mean QA values of the tracts in PD patients were significantly lower than in controls, suggesting that nigrostriatal pathway integrity is preserved in the control group. Therefore, our approach appears sensitive to SN and nigrostriatal pathway pathology. In healthy controls, possible degeneration of the SN, such as due to aging (41), is much weaker and our approach is unable to capture it. Future studies are needed to include subjects in the prodromal phase of PD to further evaluate the relative timing of nigrostriatal axonal and striatal end terminal neurodegenerative processes.
The smaller size of the tract identified in the MA hemisphere suggests that there are fewer axons between the SN and the striatum in that hemisphere. Our findings also suggest that there may be a time window to visualize the nigrostriatal dopaminergic pathway using our approach. This window encompasses the mild to moderate stages and perhaps the prodromal phase.
Our cross-sectional data in a symptomatic PD population do not allow assessment of the temporal order of axonal and presynaptic degenerations, since assessment of the temporal order requires longitudinal observations in a sample that also includes subjects in the prodromal phase of PD. However, our results suggest that synaptic and axonal degeneration may occur to some extent in parallel (mean QA and striatal DTBZ are interrelated), although possibly at a different rate and eventually affecting the survival of dopaminergic cell bodies in the SN.
Our study has several limitations. Although a particular strength of correlational tractography with 11C-DTBZ PET is that it selectively allows for parcellation of dopaminergic pathways, we cannot rule out that the identified tracts also included some nondopaminergic fibers. However, the clinical correlation of tract integrity in the LA hemisphere with the clinical bradykinesia measure suggests that a relatively high percentage of the white matter fibers included in this tract were probably dopaminergic fibers of the nigrostriatal pathway. Second, the identified tracts extend slightly below the SN, probably because of limitations in the spatial resolution of dMRI. Nonetheless, the LA tract path was close to the known anatomy of the nigrostriatal pathway (37).
CONCLUSION
The combined vesicular monoamine transporter type 2 PET-dMRI correlational tractography approach showed that nigrostriatal white matter pathway integrity is associated with striatal dopaminergic denervation in mild to moderate PD and may explain the disease-defining motor impairment (bradykinesia). These findings also suggest that in vivo PET imaging with 11C-DTBZ may reflect axonal dysfunction in PD. Assessment of nigrostriatal tract integrity may be most useful before the occurrence of severe striatal dopaminergic denervation. Therefore, our approach may be suitable as a biomarker of early-stage or even prodromal-phase PD. Further studies are needed to assess whether changes in early nigrostriatal dopaminergic pathway integrity are associated with PD development or disease progression.
DISCLOSURE
No potential conflict of interest relevant to this article was reported.
KEY POINTS
QUESTION: Is striatal dopaminergic degeneration associated with the integrity of the white matter fibers corresponding to the nigrostriatal pathway in early PD?
PERTINENT FINDINGS: In a cohort study using combined analysis based on 11C-DTBZ PET and correlational tractography, striatal dopaminergic degeneration was significantly associated with the integrity of the dopaminergic nigrostriatal pathway in 30 patients with mild to moderate PD. These findings also suggest that 11C-DTBZ PET may reflect axonal dysfunction in these patients.
IMPLICATIONS FOR PATIENT CARE: The assessment of nigrostriatal tract integrity may be suitable as a biomarker of early-stage or even prodromal-phase PD by combining 11C-DTBZ PET and correlational tractography.
Acknowledgments
We thank Christine Minderovic, Cyrus Sarosh, Jacqueline Dobson, and the PET technologists, cyclotron operators, and radiochemists. We also thank the funding agencies: the NIH, the Department of Veterans Affairs, and the Michael J. Fox Foundation. We express special thanks to our patients with PD and the research volunteers, without whom our work would not have been possible.
Footnotes
Published online Aug. 28, 2020.
- © 2021 by the Society of Nuclear Medicine and Molecular Imaging.
REFERENCES
- Received for publication April 29, 2020.
- Accepted for publication July 25, 2020.


Jump to section
Related Articles
Cited By...
- Assessing changes in whole-brain structural connectivity in the unilateral 6-hydroxydopamine rat model of Parkinsons Disease using diffusion imaging and tractography
- PET Imaging of Cholinergic Neurotransmission in Neurodegenerative Disorders
- Striatal Acetylcholine-Dopamine Imbalance in Parkinson Disease: In Vivo Neuroimaging Study with Dual-Tracer PET and Dopaminergic PET-Informed Correlational Tractography