


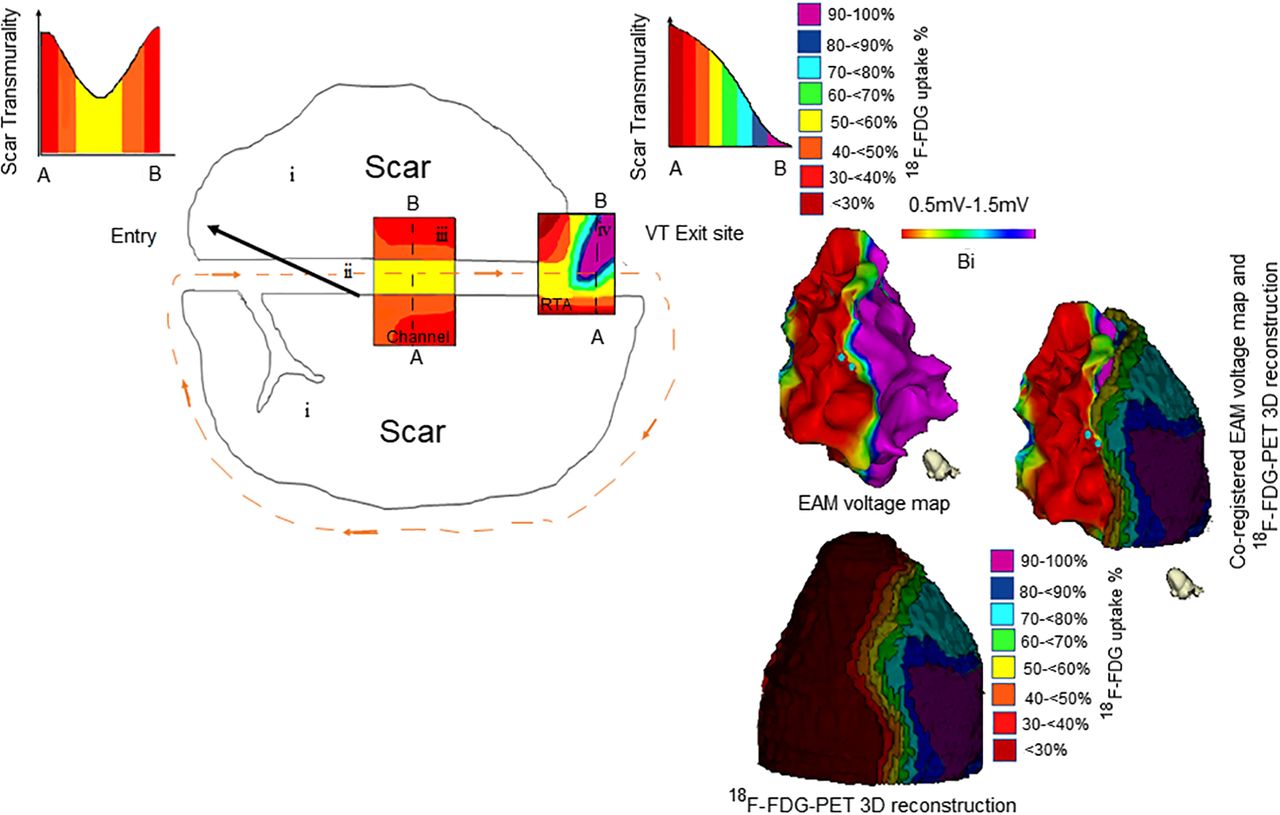
Visual Abstract

Abstract
The functional and molecular imaging characteristics of ischemic ventricular tachycardia (VT) substrate are incompletely understood. Our objective was to compare regional 18F-FDG PET tracer uptake with detailed electroanatomic maps (EAMs) in a more extensive series of postinfarction VT patients to define the metabolic properties of VT substrate and successful ablation sites. Methods: Three-dimensional (3D) metabolic left ventricular reconstructions were created from perfusion-normalized 18F-FDG PET images in consecutive patients undergoing VT ablation. PET defects were classified as severe (defined as <50% uptake) or moderate (defined as 50%–70% uptake), as referenced to the maximal 17-segment uptake. Color-coded PET scar reconstructions were coregistered with corresponding high-resolution 3D EAMs, which were classified as indicating dense scarring (defined as voltage < 0.5 mV), normal myocardium (defined as voltage > 1.5 mV), or border zones (defined as voltage of 0.5–1.5 mV). Results: All 56 patients had ischemic cardiomyopathy (ejection fraction, 29% ± 12%). Severe PET defects were larger than dense scarring, at 63.0 ± 48.4 cm2 versus 13.8 ± 33.1 cm2 (P < 0.001). Similarly, moderate/severe PET defects (≤70%) were larger than areas with abnormal voltage (≤1.5 mV) measuring 105.1 ± 67.2 cm2 versus 56.2 ± 62.6 cm2 (P < 0.001). Analysis of bipolar voltage (23,389 mapping points) showed decreased voltage among severe PET defects (n = 10,364; 0.5 ± 0.3 mV) and moderate PET defects (n = 5,243; 1.5 ± 0.9 mV, P < 0.01), with normal voltage among normal PET areas (>70% uptake) (n = 7,782, 3.2 ± 1.3 mV, P < 0.001). Eighty-eight percent of VT channel or exit sites (n = 44) were metabolically abnormal (severe PET defect, 78%; moderate PET defect, 10%), whereas 12% (n = 6) were in PET-normal areas. Metabolic channels (n = 26) existed in 45% (n = 25) of patients, with an average length and width of 17.6 ± 12.5 mm and 10.3 ± 4.2 mm, respectively. Metabolic channels were oriented predominantly in the apex or base (86%), harboring VT channel or exit sites in 31%. Metabolic rapid-transition areas (>50% change in 18F-FDG tracer uptake/15 mm) were detected in 59% of cases (n = 33), colocalizing to VT channels or exit sites (15%) or near these sites (85%, 12.8 ± 8.5 mm). Metabolism–voltage mismatches in which there was a severe PET defect but voltage indicating normal myocardium were seen in 21% of patients (n = 12), 41% of whom were harboring VT channel or exit sites. Conclusion: Abnormal 18F-FDG uptake categories could be detected using incremental 3D step-up reconstructions. They predicted decreasing bipolar voltages and VT channel or exit sites in about 90% of cases. Additionally, functional imaging allowed detection of novel molecular tissue characteristics within the ischemic VT substrate such as metabolic channels, rapid-transition areas, and metabolism–voltage mismatches demonstrating intrasubstrate heterogeneity and providing possible targets for imaging-guided ablation.
Catheter ablation for ventricular tachycardia (VT) is an effective treatment option for patients with ischemic heart disease and drug-refractory VT (1). Entrainment and activation mapping are the preferred VT mapping modalities but can be performed in only 10%–30% of patients because of hemodynamic instability (2). Therefore, surrogate strategies are commonly used, including pace mapping, ablation of diastolic potentials or of late abnormal ventricular activation (3), or substrate-guided linear ablations (4).
The current approaches using the gold standard, bipolar voltage mapping, to define ischemic scarring have a VT recurrence rate of up to 50% at 6 mo (5). Bipolar voltage mapping has inherent limitations (e.g., assessing intramural scarring and epicardial fat, limited spatial resolution, and imperfect catheter contact). Therefore, structural imaging with late-gadolinium-enhancement cardiac MRI or multidetector CT (6–9) has been used to assess anatomic changes (e.g., wall thickness or myocardial fibrosis). In contrast, functional imaging can successfully detect abnormal cellular function (e.g., metabolism or innervation) using 18F-FDG PET (10,11) and 123I-metaiodobenzylguanidine scintigraphy (12–14).
18F-FDG is recognized as one of the gold standards for the evaluation of ischemic substrate (15,16). It can provide direct information about the postischemic myocardial remodeling in ischemic heart disease patients with VT and can safely be applied in implantable cardioverter–defibrillator patients without metal artifacts affecting imaging quality. Prior small single-center studies suggested a good correlation between areas of decreased 18F-FDG uptake and low bipolar voltage (10,11,17–21).
This study sought to compare—in a larger cohort of ischemic VT patients—detailed electroanatomic maps (EAMs) with 3-dimensional (3D) 18F-FDG PET metabolic reconstructions to provide novel insights into the regional functional adaptation and heterogeneity of the postischemic VT substrate and identify possible imaging characteristics of VT channel or exit sites. The PET thresholds used were based on our prior work and that of other laboratories (17,18,22). Results might have differed if other potential cutoffs had been used.
MATERIALS AND METHODS
Study Population
The study was designed as a single-center retrospective feasibility study of 56 consecutive patients who had ischemic cardiomyopathy and were scheduled for radiofrequency ablation for drug-refractory VT. Study protocols were approved by the University of Maryland Institutional Review Board.
Imaging
PET imaging was performed using a Gemini system (Philips) or a Biograph mCT PET/CT scanner (Siemens Healthcare).
The patients received an oral load of approximately 25–50 g of glucose after an overnight fast. Approximately 1 h later, 370–500 MBq of 18F-FDG were injected, and data were acquired over 25–30 min (23). Because the increase in plasma insulin levels after glucose loading may be attenuated in some patients, particularly those with diabetes mellitus, supplemental insulin was administered in these subsets of patients before the administration of 18F-FDG, and plasma glucose levels were monitored while taking into account whether the patient was taking medications that may either antagonize or potentiate the effects of insulin (23).
Regional myocardial blood flow was assessed by a pre-18F-FDG PET perfusion scan using 82Rb PET (n = 50), 201Tl SPECT (n = 5), or 99mTc-sestamibi SPECT (n = 1).
PET perfusion images were obtained at rest using a 1,850-MBq injection of 82Rb-chloride. List-mode (i.e., time-stamped coincidence) data were acquired for 8 min after injection. An ungated perfusion image was reconstructed using data acquired 1.5–8 min after injection. A rotating 137Cs line source was used to perform a 3- to 4-min attenuation correction scan for the 18F-FDG and 82Rb datasets. Attenuation correction was not done for SPECT data (24,25). Myocardial perfusion images were reconstructed analogously to the 18F-FDG PET images. Both quantitative and qualitative assessments by nuclear cardiology experts were used.
EAMs
High-density left ventricular (LV) voltage maps were created with the CARTO 3 mapping system (Biosense Webster, Inc.) and a PentaRay catheter (Biosense Webster, Inc.). Electroanatomic data were collected with the catheter moving within the blood pool of the respective chamber with a less than 10-mm filling threshold. The system displays the endocardial surface created from usually more than 1,000 individual mapping points color-coded on the basis of the endocardial voltage. An endocardial bipolar voltage of more than 1.5 mV recorded from the catheter is considered normal, representing healthy myocardium (purple color), whereas voltage of less than 0.5 mV is considered a dense scar (red color). Voltages of 0.5–1.5 mV are considered border zones representing a mixture of scarring and normal myocardium (yellow to blue color) (4).
PET Map Reconstruction and Integration with EAMs
A short-axis series of PET DICOM files was loaded into Amira Visual Imaging software (Visage Imaging). An LV shell was created by manual tracing of the middle third of the left ventricle in the short-axis series to accurately represent peak tracer uptake in each LV segment. The wall of the right ventricle was partially traced to aid the registration process (Figs. 1A and 1B). Radiotracer uptake was analyzed using the Cardiac PET Modeling Tool, version 3.4 (PMOD Technologies). For quantitative analysis, standard 17-segment myocardial segmentation was used, and the radiotracer uptake of each segment on both the perfusion and the metabolism tomograms was measured (26).

Workflow of 18F-FDG reconstructions. (A) Raw 18F-FDG PET DICOM showing left ventricle with central region of interest (purple). (B) Resulting 3D LV (purple) and right ventricle (blue) reconstruction. (C) Same slice as shown in A, with color map according to value of 18F-FDG uptake in each segment, showing decreased uptake in inferolateral scar area. (D) Generated 3D color PET reconstruction from short-axis slices with inferolateral scar based on 18F-FDG uptake percentage.
Segmental myocardial perfusion was labeled as normal (>85% of peak activity), moderately reduced (50%–85%), or severely reduced (<50%). The 18F-FDG uptake was then normalized to the highest 18F-FDG value of any segment with more than 85% perfusion uptake, and a 10% decremental, color-coded strata of the normalized myocardial metabolism was created (Figs. 1C and 1D).
Segments with concordant severely reduced perfusion and metabolism (<50% of peak perfusion and glucose metabolism) were considered to be severe PET defects suggesting transmural scarring, whereas reduction of both perfusion and glucose metabolism to 50%–70% was labeled as a moderate PET defect consistent with nontransmural scarring (27,28). Areas with more than 70% uptake were considered normal PET areas. Hibernating areas were defined as segments with 18F-FDG uptake that is at least 10% higher than corresponding segmental perfusion (20).
Three predefined metabolic map characteristics were identified on each 18F-FDG reconstruction before registration. First, metabolic channels were defined as continuous corridors of abnormal metabolism (≤70%) that traversed an area with an even less preserved metabolic activity (≥10% lower than the metabolic channel activity) (Fig. 2; Supplemental Fig. 1; supplemental materials are available at http://jnm.snmjournals.org). Second, rapid-transition areas (RTAs) were defined as areas that demonstrated an at least 50% increase in PET tracer uptake over a distance of 15 mm or less in any direction (Fig. 3; Supplemental Fig. 2). Third, metabolism–voltage mismatch (MVM) areas were defined as areas showing a severe PET defect of 18F-FDG < 50% but with a corresponding coregistered LV voltage map showing normal myocardium and accounting for at least 20% of the total LV EAM surface area (Fig. 4; Supplemental Fig. 3).

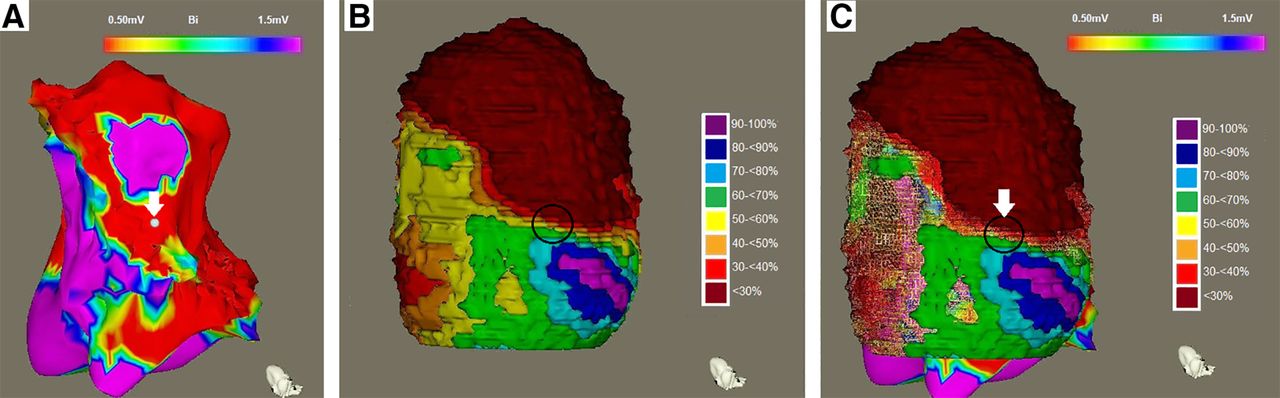
Metabolic channel. (A) EAM showing inferior scar with 0.5- to 1.5-mV setting and VT channel or exit site (white point and arrow). (B) Corresponding PET 3D reconstruction showing metabolic channel (dashed lines). (C) Coregistration of EAM and PET 3D reconstruction showing VT channel or exit (arrow) within metabolic channel (dashed lines). Additional example is shown in supplemental materials.
RTA. (A) EAM showing apical and inferior scars with 0.5- to 1.5-mV setting and VT channel or exit site (white point and arrow). (B) PET 3D reconstruction demonstrating RTA (circle, change of ≥50% uptake/15 mm [red to blue color shift]). (C) Coregistration showing VT channel or exit within RTA; arrow points to VT channel or exit site within RTA (circle). Additional example is shown in supplemental materials.
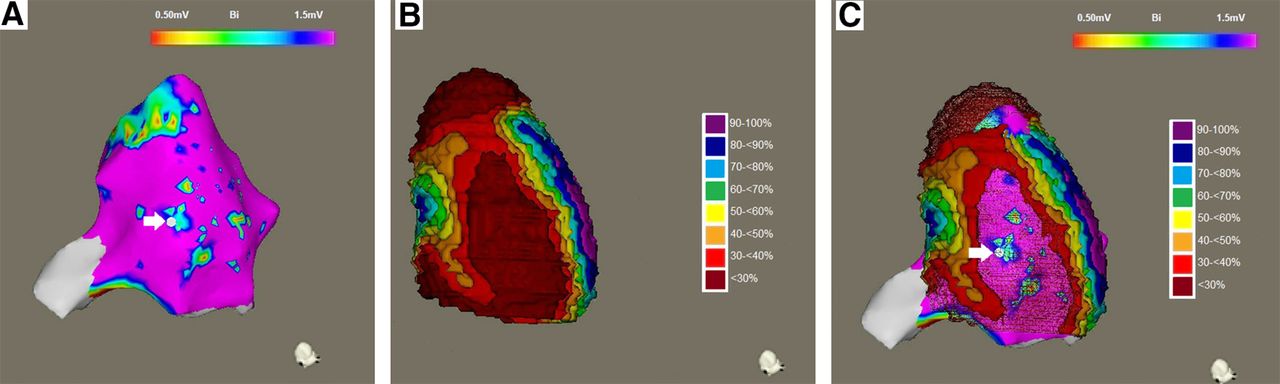
MVM. (A) EAM showing apical and inferior scars with 0.5- to 1.5-mV setting and VT channel or exit site (white point and arrow). (B) PET 3D reconstruction demonstrating larger severe PET defect (red area = MVM). (C) Coregistration of 3D PET reconstruction and EAM demonstrating VT channel or exit within MVM (arrow). Additional example is shown in supplemental materials.
DICOM3 formatting was applied to Amira output files to allow recognition by the proprietary CartoMERGE software (Biosense Webster) and converted to CARTO 3 readable mesh files. The 3D shells were transferred and coregistered to high-density voltage maps using multiple matching-landmark pairs (superior or inferior right ventricle septal insertion, mitral valve, apex) using the CartoMerge Image Processing Tool.
VT Ablation
Ablation procedures were performed with a 3.5-mm open irrigated-tip catheter (ThermoCool SmartTouch; Biosense). Targeted VT was any clinical VT documented by 12-lead electrocardiograms or any presumed clinical VT defined by matching the cycle length, the far-field morphology, and the relationship between the local electrogram and the far-field electrogram from implantable cardioverter–defibrillator recordings.
Radiofrequency ablation was performed orthogonally to the defined channel by creating single, overlapping radiofrequency lesions (40- to 50-W ablations for 60 s each). After the ablation, programmed electric stimulation with up to 3 extra stimuli and the shortest coupling interval (200 ms) from at least 2 right ventricular or LV sites was repeated. Successful ablation of the clinical VT was defined as the inability to reinduce the targeted VT.
Statistical Analysis
All statistical analyses were performed with SPSS software, version 16.0 (SPSS Inc.). Continuous variables were expressed as mean ± SD and were compared using the Student t test (normally distributed) or the Mann–Whitney U test (nonnormally distributed). For paired variables, the paired t test or the Wilcoxon signed-rank test was used, respectively. Differences were considered significant at a P value of less than 0.05.
RESULTS
Patient Population
Patient characteristics are shown in Table 1.
Patient Characteristics
All 56 patients had ischemic cardiomyopathy, with an ejection fraction of 29% ± 12%. Most of the patients were male (46 men and 10 women), and the average age was 63 ± 11 y. All patients had a history of prior myocardial infarction based on history, electrocardiography results, or cardiac imaging results. An ischemic etiology was confirmed by previous coronary intervention with either bypass grafting (n = 20) or coronary stenting (n = 36) (29).
Comparison of EAM and PET Results
In all patients, PET reconstructions were successfully created and registered. The average reconstruction and registration time was 25 ± 12 min. Patients had an average of 1.2 ± 0.4 areas with moderate/severe PET defects (minimum size, 14.5 cm2), including, in all patients, a core area of severe PET defects.
Severe PET defects measured 63.0 ± 48.4 cm2, whereas PET moderate/severe defects (≤70% uptake) measured 105.1 ± 67.2 cm2, accounting for 23% and 39% of the total LV surface area, respectively.
EAM dense scarring measured 13.8 ± 33.1 cm2, and EAM border zones measured 56.2 ± 62.6 cm2, accounting for 5% and 21% of the total LV surface area, respectively. Severe and moderate PET defects were significantly larger than EAM dense scarring and EAM border zones (P < 0.001), respectively. However, severe PET defects and EAM border zones were similar in area (P = 0.139) (Table 2; Supplemental Fig. 4).
Imaging Characteristics
Severe PET defects overlapped with EAM dense scarring and EAM border zones in 86% ± 22% and 82% ± 18%, respectively. Moderate PET defects overlapped with EAM dense scarring (<0.5 mV) in 91% ± 13% and EAM border zones in 76% ± 33%.
Analysis of all mapping points (n = 23,389) showed that EAM voltage increased incrementally from areas with severe PET defects (n = 10,364; 0.47 ± 0.28 mV) to areas with moderate PET defects (n = 5,243; 1.51 ± 0.86 mV; P < 0.01) and normal PET areas (n = 7,782; 3.2 ± 1.3 mV; P < 0.001; Fig. 5).
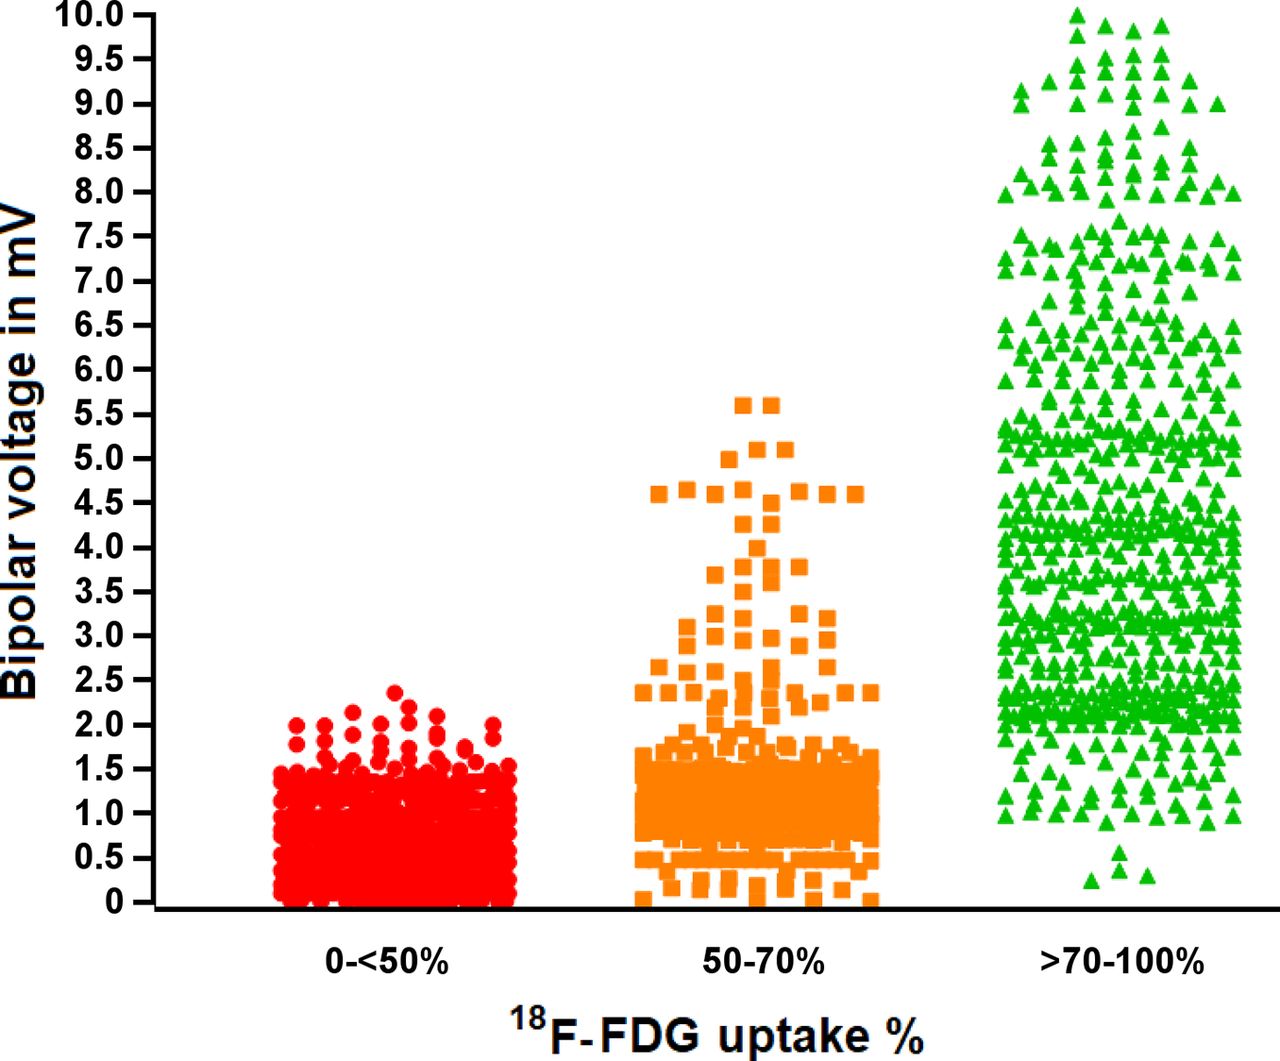
Scatterplot showing average bipolar voltage of severe PET defect, moderate PET defect, and normal PET areas. There is stepwise increase in bipolar voltage with each step in 18F-FDG PET uptake.
VT Ablation and Correlation to PET Maps
Clinical VTs were successfully induced in 91% of patients (n = 50). The average cycle length for the induced VTs was 343 ± 96 ms. The areas with moderate PET defects harbored 88% (n = 44, 0.91 ± 0.7 3 mV) of the VT channel or exit sites. Areas with severe PET defects harbored 78% of the VT channel or exit sites (n = 39; 0.51 ± 0.32 mV), with 28% (n = 14), 32% (n = 16), and 18% (n = 9) localized to areas with 18F-FDG uptake of less than 30%, 30%–40%, and 40%–50%, respectively. Ten percent (n = 5; 0.96 ± 0.87 mV) of VT channel or exit sites localized to areas with moderate PET defects, and 12% of VT channel or exit sites (n = 6; 1.31 ± 0.45 mV) were in normal PET areas, with an average distance of 6.5 ± 3.9 mm and 13.6 ± 4.5 mm from the border of the moderate and severe PET areas, respectively (Table 3; Supplemental Fig. 5).
Distribution of 18F-FDG Uptake Percentage and Bipolar Voltage Characteristics of 50 Clinically Determined VT Channel or Exit Sites
Hibernation
Hibernation was found in 4 patients (89.2 ± 22.3 cm2), representing 15.7% ± 10.3% of the left ventricle. The bipolar voltage of the hibernating area (n = 1,655 points) was 2.3 ± 1.6 mV, significantly higher than the severe PET defects (P = 0.001). Clinical VTs (n = 4; cycle length, 259 ± 38 ms) were inducible in 3 of the 4 patients. One VT channel or exit site (25%) localized to the hibernating myocardium (1.2 mV; cycle length, 343 ms). The other 3 VT channel or exit sites (75%) localized to areas with severe PET defects (0.4 ± 0.2 mV). Either patients were poor surgical candidates (n = 3), or the hibernating area was deemed too small to benefit from revascularization (n = 1).
Metabolic Scar Characterization
Metabolic Channels
Metabolic channels (n = 26) were found in 25 patients (45%; 1.1 ± 0.3 channels per patient). The anonymized datasets were independently assessed by an independent masked reader with more than 20 y of experience in VT ablation to determine the reproducibility of the metabolic channel delineation. All channels (n = 26) were identified in the same anatomic locations (100% reproducibility).
The average length and width of the channels were 17.6 ± 12.5 mm and 10.3 ± 4.2 mm, respectively. In total, 77% (n = 20) of the channels demonstrated less than 50% PET uptake; of those, 60% (n = 12) showed PET uptake of 30%–40% and 40% (n = 8) showed PET uptake of 40%–50%. Of the metabolic channels, 23% (n = 6) showed PET activity of 50%–70%; of those, 33% (n = 2) and 67% (n = 4) demonstrated PET uptake of 50%–60% and 60%–70%, respectively. Channel orientation was more commonly base-to-apex (86%) than lateral-to-septal (14%) (P = 0.01).
Thirty-one percent (n = 8) of the metabolic channels harbored VT channel or exit sites. All channels that harbored the VT channel or exit sites demonstrated a PET uptake of less than 50%; 63% (n = 5) localized to PET uptake of 40%–50%, and 37% (n = 3) localized to PET uptake of 30%–40%. Metabolic channels without colocalized VT channel or exit sites (69%; n = 18) were at a distance of 12.3 ± 6.4 mm from the VT channel or exit sites (Fig. 2; Supplemental Fig. 1).
RTAs. In total, 35 RTAs was found in 33 patients (59%; 1.1 ± 0.2 RTAs per patient). RTAs were always localized at points of metabolic scarring or preserved-metabolism transition and were more likely to encompass only a part of (81%; n = 26)—versus the whole (19%; n = 6)—metabolic scar circumference (P = 0.01). The average RTA width and length were 11.8 ± 1.9 mm and 53.5 ± 20.4 mm, respectively. Ninety percent of RTAs (n = 32) demonstrated areas with uptake ranging from less than 30% to 70% or higher, whereas 10% (n = 3) encompassed areas with uptake ranging from 30% to 80% or higher.
RTAs were spatially associated with VT channel or exit sites. Fifteen percent (n = 5) of the RTAs harbored the VT channel or exit sites, whereas the rest of the RTAs (n = 30) were found to be near (12.8 ± 8.5 mm) the closest VT channel or exit site (Fig. 3; Supplemental Fig. 2).
MVMs. MVMs were detected in 21% (n = 12) of patients. The average MVM area accounted for 27% ± 6% of the LV surface. In 41% (n = 5) of the patients with MVMs, the MVM area harbored the VT channel or exit sites. The rest of the MVMs (n = 7), not harboring the VT channel or exit sites, were 14.5 ± 7.8 mm from the nearest VT channel or exit site (Fig. 4; Supplemental Fig. 3).
DISCUSSION
The main findings of this study are that functional imaging using decremental color-coded 18F-FDG PET strata maps can detect areas of abnormal myocardial metabolism that harbor approximately 90% of VT channel or exit sites, identify decreased bipolar voltage regions, and provide a detailed map of regional metabolic remodeling enabling detection of molecular intra-VT substrate heterogeneities or characteristics and possible novel VT ablation targets.
18F-FDG PET is an established gold standard for imaging and differentiating viable from scarred myocardium. 18F-FDG is taken up into the myocardial cells analogously with the serum glucose without further metabolism after phosphorylation, allowing molecular imaging of the metabolic characteristics of myocardial cells. Under normal conditions, free fatty acids are the preferred and highly effective cellular pathway for adenosine triphosphate production. Ischemia impairs this mitochondrial pathway and shifts it to cytosolic, less efficient glycolysis-based adenosine triphosphate generation. Under glucose-loaded conditions, plasma insulin levels increase and tissue lipolysis is inhibited, resulting in reduced fatty acid delivery to the myocardium and preferred glucose utilization in all viable myocardial cells, regardless of whether they are hypoperfused or ischemic. Regions with scarred myocardium will have severely decreased or no glucose utilization. Both processes can occur in parallel and with regional heterogeneity within the VT substrate and reflect the molecular and cellular postischemic myocardial remodeling and adaption that can be imaged using 18F-FDG (23).
Several studies have shown that 18F-FDG has the highest sensitivity in detecting viable myocardium. The cutoff for myocardial viability was different among those studies, but most agreed that to be viable, segments required uptake of at least 50% or at least 70% (27,28).
Scar Delineation and Scar Size Comparison
Delineation of the myocardial scar using 18F-FDG PET was able to guide assessment of areas with abnormal bipolar voltage. In this study, the 18F-FDG scar was able to predict abnormal bipolar voltage, with voltage improving along with the 3 predefined categories of severe PET defect, moderate PET defect, and normal PET area (preserved PET uptake). The cutoff for severe PET defects, used in clinical decisions on revascularization, correlated better with EAM border zones than did the cutoff for moderate to severe PET defects, suggesting that significant metabolic remodeling has to occur before the bipolar voltage is decreased (27,28).
In the original 18F-FDG PET and VT feasibility study (22), EAM dense scarring showed 42% ± 7% uptake on PET, whereas EAM border zones showed 67% ± 15% uptake on PET, with a good PET-to-EAM correlation (r = 0.89, P < 0.05). By extension, Tian (11) reported a segmental match of 83.7%–94.4% between PET and EAM scars. A receiver-operating-characteristic–based analysis suggested that a PET uptake of 46% identified the best abnormal voltage, which is similar to the correlation between a 50% PET uptake and a voltage of less than 1.5 mV found in this study. Furthermore, Fahmy et al. (17) identified a bipolar voltage of 0.9 mV to be the best match for a PET cutoff of less than 50% with an EAM of less than 0.5 mV, underestimating PET scar burden. Our finding of a significant increase in PET activity with bipolar voltage is in line with findings of Kettering et al. (18), who showed that EAMs of less than 0.5 mV, 0.5–1 mV, and 1–1.5 mV correlated with PET activities of 43%, 49.5%, and 60.1%, respectively. The parallel increase in 18F-FDG PET tracer or voltage and the overlap of 86% and 82% between a PET cutoff of less than 50% and EAMs of less than 0.5 and no more than 1.5 mV, respectively, found in this study, confirms that 18F-FDG PET uptake can reliably predict low-voltage areas in ischemic patients.
All successful ablation sites were located within the PET moderate/severe scar ≤70% (88%) or within 1 cm of its border in metabolically normal tissue (12%). This observation either raises the possibility of more subtle structural or metabolic changes or may favor functional reentry (30).
Metabolic Substrate Characterization of the Postinfarction VT Substrate
Surviving myocardium within fibrotic areas is a prerequisite for reentrant VT, allowing slow conduction channels to persist (31,32). However, recent high-density mapping of postinfarction VT demonstrated that a functional block rather than a fixed anatomic block defines the boundaries of the VT isthmus in up to 80% of cases (33).
Functional postischemic remodeling may change the electrical conduction properties of the myocardium and potentially contribute to a functional block and promote arrhythmicity. To better characterize functional remodeling within the postischemic VT substrate, our study assessed 3 predefined metabolic characteristics.
First, 45% of patients were seen as metabolic channels and were oriented more commonly apex-to-base, consistent with reported voltage-based VT channels (34,35). Interestingly, the clinical VT channel or exit sites localized in 31% of patients to the metabolic channels. This finding suggests a potential correlation between functional imaging data–derived channels and clinical VT.
Second, RTAs were predefined as regions with more than a 50% metabolic uptake change within 15 mm, presumptively identifying a heterogeneous substrate (metabolically preserved adjacent to severe metabolically impaired myocardium). Structural imaging with cardiac MRI found that a rapid shift in scar transmurality and heterogeneous late gadolinium enhancement (gray zone) was associated with the location of the VT channel (7,36,37). Nearly 60% of patients demonstrated RTAs, and VT circuits colocalized with RTA in 15% of them. Interestingly, VT channel or exit sites were found either within the RTA or near it, raising the question of whether such functional characteristics may correlate with substrate proarrhythmicity, such as a functional block and a fixed block.
Third, MVM areas with severe metabolic defects but preserved bipolar voltage were found in 21% of patients. This observation demonstrates that severe functional remodeling of the myocardium can occur in a significant number of patients before resulting in measurable bipolar voltage abnormalities. A similar functional discordance has been observed in denervated myocardium with preserved voltage (12). Tissue categories with such profound functional heterogeneity may be of arrhythmogenic interest, and 41% of the MVM areas in this study harbored the VT channel or exit sites.
Study Limitations
Although this study included the largest (to our knowledge) series to date, the study design was retrospective, and a prospective evaluation will be required for future assessment. The spatial resolution of PET is currently 4–7 mm (38). PET technology compares favorably with SPECT (12 mm) and is currently the gold standard for functional imaging of the human heart. Registration of the PET imaging datasets and the EAMs was required to compare the 2 datasets. Registration errors are inherent in any such process. Still, multiple registration points were used, and each registration was carefully reviewed to minimize any such confounder. The analysis was performed using various predefined thresholds and definitions of the PET datasets (such as the <50% and ≤70% cutoffs, the channels, the RTAs, and the MVMs). It is possible that other cutoffs would have yielded other, yet unknown, insights and should be included in future studies.
Further research is needed to compare functional PET images with late-gadolinium-enhancement MR images, the gold standard in scar identification.
CONCLUSION
3D reconstruction and integration of 18F-FDG functional datasets are feasible and allow the comprehensive assessment of functional remodeling and its heterogeneity in the postischemic VT substrate. Detailed 10%-step gradient metabolic maps can reliably predict areas of severe metabolic defects, predict areas of abnormal voltage, and identify approximately 90% of VT channel or exit sites. Importantly, newly defined metabolic characteristics such as metabolic channels, RTAs, and MVM areas are common and demonstrate heterogeneous intrasubstrate remodeling and adaptations within the postinfarct VT substrate.
DISCLOSURE
No potential conflict of interest relevant to this article was reported.
KEY POINTS
QUESTION: Is functional imaging using 18F-FDG PET before VT ablation useful?
PERTINENT FINDINGS: 3D reconstruction and registration of 18F-FDG PET studies were feasible and revealed that severe PET defects were comparable in size to EAM border zones. The study also found that new features such as metabolic channels and RTAs provide information about potential VT substrates.
IMPLICATIONS FOR PATIENT CARE: Use of 18F-FDG PET 3D reconstructions integrated into CARTO 3 maps before VT ablations will add valuable information that guides successful substrate identification and ablation.
Footnotes
Published online April 23, 2021.
- © 2021 by the Society of Nuclear Medicine and Molecular Imaging.
REFERENCES
- Received for publication April 3, 2020.
- Accepted for publication March 1, 2021.
In this issue


Jump to section
Related Articles
Cited By...
- No citing articles found.