


Abstract
Our purpose was to explore the value of 68Ga-prostate-specific membrane antigen (PSMA) PET/CT for detection of phosphatase and tensin homolog (PTEN)–loss prostate cancer. Methods: We retrospectively enrolled 75 patients who underwent multiparametric MRI and 68Ga-PSMA PET/CT before radical prostatectomy. Lesions were outlined on pathologic images, and regions of interest were drawn on matched multiparametric MRI and PET/CT images. Imaging parameters, including average apparent diffusion coefficient and SUVmax, were derived. Immunohistochemical staining was performed to evaluate the PTEN status. The diagnostic performance of imaging parameters was analyzed by receiver-operating-characteristic analysis. Univariate logistic regression analyses were used to evaluate the association between clinical and imaging variables and PTEN status. Results: In total, 103 lesions from 75 patients were analyzed. Of these lesions, 38 of 103 (36.9%) showed PTEN-loss status. Our study showed a strong association between SUVmax and PTEN-loss tumors both in the per-patient analysis (P < 0.01) and in the per-lesion analysis (P < 0.01), yielding sensitivity and specificity of 0.80 and 0.77, respectively, in the per-patient analysis and 0.83 and 0.74, respectively, in the per-lesion analysis. Meanwhile, higher pathologic PSMA expression was found in the PTEN-deficiency tumors. However, there was no significant difference between PTEN-loss tumors and PTEN-intact tumors using parameters such as average apparent diffusion coefficient (P > 0.05) and score on the Prostate Imaging Reporting and Data System, version 2 (P > 0.05). Surprisingly, SUVmax was a significant predictor for detection of PTEN-loss tumors (odds ratio of 7.56 and 95% confidence interval of 2.18–26.24 on per-patient analysis; odds ratio of 13.66 and 95% confidence interval of 4.32–43.24 on per-lesion analysis). Conclusion: 68Ga-PSMA PET/CT could effectively detect aggressive PTEN-loss tumors.
Prostate cancer (PCa) is the most common cancer in men and the second most common cause of male cancer-related death in western countries (1). Several parameters, including Gleason score, prostate-specific antigen (PSA) density, number of positive cores, and percentage of cancer in each core, are currently included in nomograms to assess the risk of PCa, with an accuracy of 70% (2). Despite improvement in early detection, we still lack molecular markers to effectively distinguish men with high-risk disease from the indolent majority of disease. Phosphatase and tensin homolog (PTEN) is located on human chromosome 10q23.3 and is the most commonly deleted tumor suppressor gene in PCa (3). Loss of PTEN, at either the genomic or the protein level, has previously been demonstrated to have an association with more aggressive disease, faster progression to androgen independence, and increased risk for tumor recurrence (4,5). Besides, deletion of PTEN activates the phosphatidylinositol-3′-kinase/protein kinase B (PI3K-Akt) pathway, and it is estimated that most advanced tumors have alterations in this pathway (6). Thus, identifying patients with PTEN loss would be of great significance because such identification might guide treatment. Imaging is a promising approach to detect patients with PTEN loss in that information about the entire tumor can be obtained at multiple time points during the course of therapy.
Multiparametric MRI (mpMRI) is playing an important role in the detection, staging, and localization of PCa (7). Some studies have been performed to determine tumor aggressiveness by means of mpMRI, demonstrating a significant correlation between quantitative MRI parameters such as apparent diffusion coefficient (ADC) and Gleason score (7). The association between PTEN deficiency and ADC has also been investigated by several groups (8,9). However, they were not identical in views. Hence, determination of PTEN-deficiency PCa using mpMRI is still unavailable.
Prostate-specific membrane antigen (PSMA) is almost exclusively expressed in prostate tissue and is usually overexpressed on PCa cells (10). PET with PSMA (e.g., 68Ga-PSMA-11) is a relatively new nuclear imaging modality with good performance for the staging and diagnosis of primary PCa, detection of recurrent PCa, and evaluation of PCa aggressiveness (11–13). Increasing pathologic PSMA expression is associated with a higher likelihood of PCa aggressiveness, in accordance with tracer uptake on PSMA PET imaging (14,15).
However, as of yet, there has been no study that has specifically evaluated the diagnostic performance of 68Ga-PSMA PET/CT for the aggressive PTEN-loss PCa.
The aim of this study was to evaluate the performance of 68Ga-PSMA PET/CT to distinguish PTEN-deficiency PCa from PTEN-intact PCa in a consecutive cohort who underwent radical prostatectomy.
MATERIALS AND METHODS
Study Population
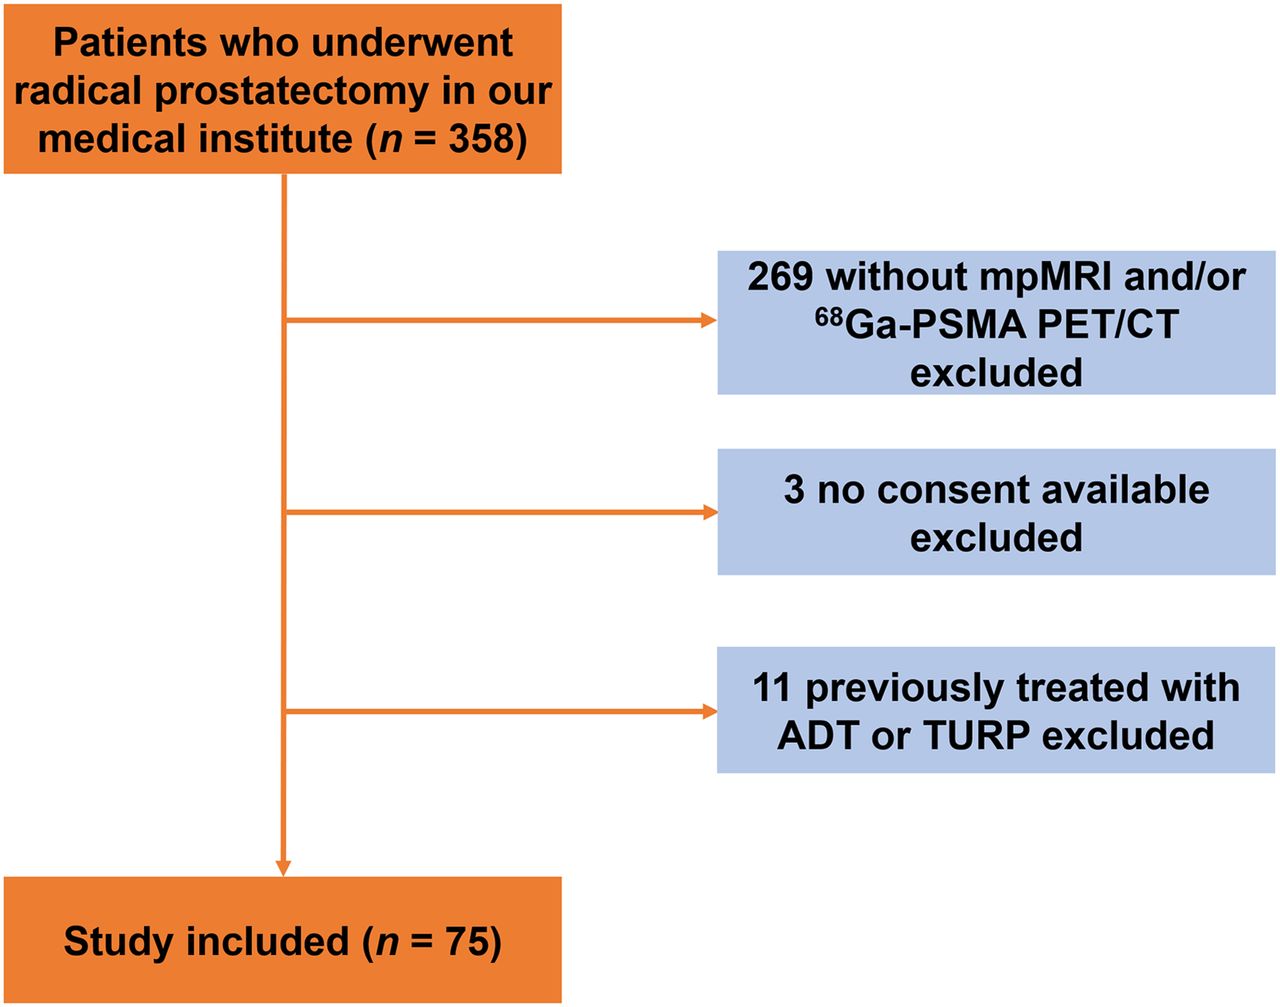
From November 2017 to March 2019, we retrospectively enrolled 358 patients who underwent radical prostatectomy in our medical institute based on histologic confirmation of PCa. We excluded patients without mpMRI or PSMA PET/CT (n = 269), patients without consent (n = 3), and patients previously treated with androgen deprivation therapy or transurethral resection of the prostate (n = 11) (Fig. 1). Finally, 75 patients were included in the study. The study was approved by the Ethics Committee of Nanjing Drum Tower Hospital (approval 2017-147-01), and all patients provided written informed consent.

Study flowchart with excluded patients and reason for exclusion. ADT = androgen deprivation therapy; TURP = transurethral resection of prostate.
mpMRI Examination
All patients underwent pelvic mpMRI using a 3.0-T MR scanner (Achieva 3.0 TTX; Philips) by a 16-channel phased-array coil as described previously (16). Transverse, coronal, and sagittal T2-weighted turbo spin-echo images were acquired (18 slices 3 mm thick with a 0.5-mm gap; repetition time, 3,744 ms; echo time, 120 ms; 2 signals acquired; resolution, 1.49 ×1.51 mm). Diffusion-weighted spin-echo echo-planar images were also acquired (18 slices 3 mm thick with a 1-mm gap; repetition time, 925; echo time, 41 ms; 1 signal acquired; resolution, 3 × 3 mm; b-factor, 0/800/1,500 s/mm2). T1-weighted high-resolution isotropic volume with fat suppression after gadolinium injection was used for dynamic contrast-enhanced images (133 slices 3 mm thick with no gap; repetition time, 3.1 ms; echo time, 1.46 ms; 1 signal acquired; resolution, 1.49 × 1.51 mm; dynamic scan time, 00:06.9). ADC maps were then generated from the diffusion-weighted imaging data on a Philips workstation using United Imaging Healthcare software.
68Ga-PSMA PET/CT Examination
All patients were intravenously injected with 68Ga-PSMA-11 (median, 131.72 MBq; range, 130.6–177.6 MBq). PET/CT was performed in a uMI 780 PET/CT scanner (United Imaging Healthcare). A CT scan (130 keV, 80 mAs) and static emission scans corrected for dead time, scatter, and decay were acquired from the vertex to the proximal legs. First, a CT scan (130 keV, 80 mAs, 3.0-mm slice thickness) was obtained 45 min after tracer injection without using contrast medium. Second, corrected for dead time, scatter, and decay, static emission scans were acquired from the vertex to the proximal legs in 3 dimensions (matrix, 200 × 200). This required 8 bed positions with 3 min per bed position. The images were iteratively reconstructed and included CT-based attenuation correction using the ordered-subsets expectation-maximization algorithm with 4 iterations and 8 subsets and gaussian filtering to an in-plane spatial resolution of 5 mm in full width at half maximum.
Whole-Mount Histopathology
After robot-assisted radical prostatectomy, whole-mount tissue was fixed in 10% formalin, embedded in paraffin, cut into 4- to 5-mm slices using a microtome, and stained with hematoxylin and eosin. All whole-mount histology slides were subsequently digitalized by a scanning system (NanoZoomer Digital Pathology). All pathologic images were interpreted in consensus by 2 dedicated genitourinary urologic pathologists according to the 2014 International Society of Urological Pathology modified criteria for PCa (17). To identify pathologic regions of interest, tumor lesions were outlined and corresponding Gleason scores were assigned. Outlined regions were masked for further radiopathologic comparison.
Immunohistochemistry
Immunohistochemistry for PTEN was performed using rabbit antihuman PTEN antibody clone D4.3 XP (9188; Cell Signaling) at a 1:50 dilution as described previously (18). A lesion was considered to have PTEN protein loss if the intensity of cytoplasmic and nuclear staining was markedly lower or entirely negative across more than 10% of tumor cells compared with surrounding benign tissue or stroma, which provide internal positive controls (18). Immunohistochemistry for PSMA was also done using monoclonal anti-PSMA (clone 1D6, 1:100, ZM-0476; ZSGB-BIO). As previously described (15), the immunohistochemical results are reported as both percentage of positively stained cells and staining intensity, together with the immunoreactive score (IRS) and a modified 4-point IRS classification (Supplemental Table 1; supplemental materials are available at http://jnm.snmjournals.org). Immunohistochemical results were analyzed by 2 independent urologic pathologists.
MpMRI and PET/CT Image Evaluation
All MRI scans were reviewed in consensus by 2 radiologists. Regions of interest, defined as regions with abnormal signal on mpMRI, were outlined and scored with Prostate Imaging Reporting and Data System version 2 (PI-RADS) (19). Each lesion suggestive of PCa (PI-RADS score ≥ 3) was reported. Then, each case was reviewed to match each lesion outlined on the pathologic slices with the corresponding mpMRI images by comparing the specific location, slide number, and identifiable anatomic landmarks (such as urethra and ejaculatory ducts). Histologically confirmed tumor corresponding to a previously identified lesion on mpMRI was considered visible. Subsequently, using MIStar software (Apollo Medical Imaging Technology), regions of interests were drawn freehand on continuous axial ADC images by the pathologists. ADCmean was calculated from the histograms of pixelwise ADCs within the whole-lesion volumes of interest as previously described (20).
PET/CT imaging was independently evaluated in consensus by 2 double-trained board-certified nuclear medicine physicians, who were masked to the mpMRI and pathologic results. Suspected lesions on PET/CT were defined as an area of increased uptake in prostate gland higher than the background level. Suspected lesions were reported, and images were matched with the corresponding pathologic slices. For each lesion, regions of interests were drawn on continuous PET/CT fusion images using a RadiAnt DICOM viewer, version 4.2.1 (Medixant). SUVmax was derived from whole-lesion volumes of interests.
Statistical Analysis
The Mann–Whitney U test was used for continuous variables, and the χ2 test for categoric variables. The diagnostic performance of the different imaging parameters for detection of PTEN status was assessed with receiver-operating-characteristic curves, areas under the curve, and 95% confidence intervals (95% CIs); sensitivity and specificity were also calculated. Univariate logistic regression analyses were performed to determine significant variables for differentiating PTEN-deficiency tumor from PTEN-intact tumor. Statistical analysis was performed using SPSS software (version 22.0; IBM Corp.). For tests of all variables, a P value of less than 0.05 signified statistical significance.
RESULTS
Patient Characteristics and Lesion Findings
The demographics and clinical characteristics of all patients included in the study are shown in Table 1. The median age was 69 y (range, 55–84 y). The median PSA was 13.61 ng/mL (range, 3.91–100.00 ng/mL). The general Gleason group (GG) distribution for all index lesions was GG 1 in 5 of 75 (6.7%), GG 2 in 26 of 75 (34.7%), GG 3 in 25 of 75 (33.3%), GG 4 in 10 of 75 (13.3%), and GG 5 in 9 of 75 (12.0%). In our samples, tumor multifocality included the following categories: 1 focus, 2 foci, 3 foci, and 4 foci. In total, 103 foci were identified.
Characteristics of All 75 Patients Included in Study
Clinical and Imaging Features Stratified by PTEN Status
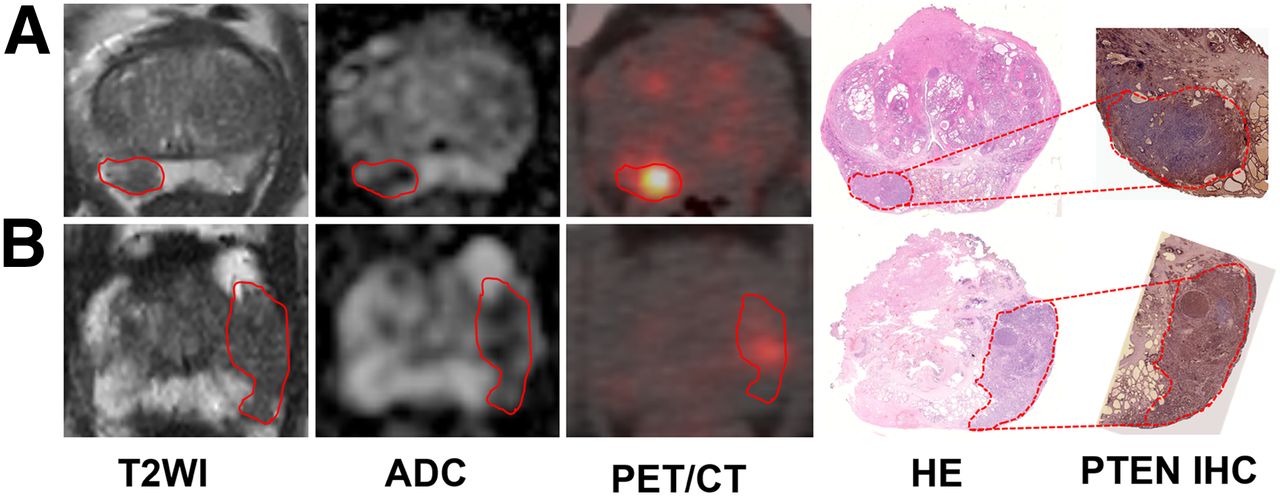
PTEN-loss status was detected in 36 of 75 patients (48.0%) and 38 of 103 lesions (36.9%). No significant differences were found in patient age, preoperative PSA level, pT stage, and pN stage. Though there was no statistical significance when GG 1/2/3 was compared with GG 4/5 in the per-patient analysis (P = 0.202) and per-lesion analysis (P = 0.062), PTEN-loss status was more frequently found in GG 4/5 than GG 1/2/3 in the per-patient analysis (11/18 [61.1%] vs. 25/57 [43.9%]) and per-lesion analysis (11/20 [55.0%] vs. 27/83 [32.5%]). To further compare the imaging variables, all lesions were matched on mpMRI, PET/CT, and pathologic imaging. Two PTEN-loss index lesions, 2 PTEN-intact index lesions, 1 PTEN-loss nonindex lesion, and 3 PTEN-intact nonindex lesions were not visible on mpMRI. In contrast, 1 PTEN-intact index lesion, 1 PTEN-loss nonindex lesion, and 7 PTEN-intact nonindex lesions were invisible on PET/CT. Representative radiopathologic matching of PTEN-deficiency and PTEN-intact lesions are shown in Figure 2. A distinct difference was seen on SUVmax, which is a PET/CT imaging parameter, when comparing PTEN-loss tumor and PTEN-intact tumor in the per-patient analysis (median, 22.5 vs. 8.7; P < 0.001) and per-lesion analysis (median, 22.0 vs. 8.2; P < 0.001), whereas mpMRI imaging parameters including PI-RADS score and ADCmean were similar in the per-patient and per-lesion analyses (Table 2; Fig. 3). There was also an obvious difference in SUVmax in different GGs and tumor diameters stratified by PTEN status in the per-patient analysis and per-lesion analysis (Fig. 3).

Representative PTEN-intact PCa lesions (A) and PTEN-loss PCa lesions (B). (A) A 63-y-old man with index tumor in peripheral zone (PSA level, 5.42 ng/mL; Gleason score, 4 + 3; maximal diameter, 1.8 cm; PTEN immunohistochemistry intact), demonstrating hypointense area on T2-weighted and ADC images and moderate uptake on PET/CT image. (B) A 67-y-old man with PCa in peripheral zone (PSA level, 5.46 ng/mL; Gleason score, 4 + 3; maximal diameter, 1.2 cm; PTEN immunohistochemistry loss), showing hypointense area on T2-weighted and ADC images and strong uptake on PET/CT image. Lesions are outlined. HE = hematoxylin and eosin; IHC = immunohistochemistry; T2WI = T2-weighted image.
Association of PTEN Immunohistochemistry Status with Clinical and Imaging Characteristics
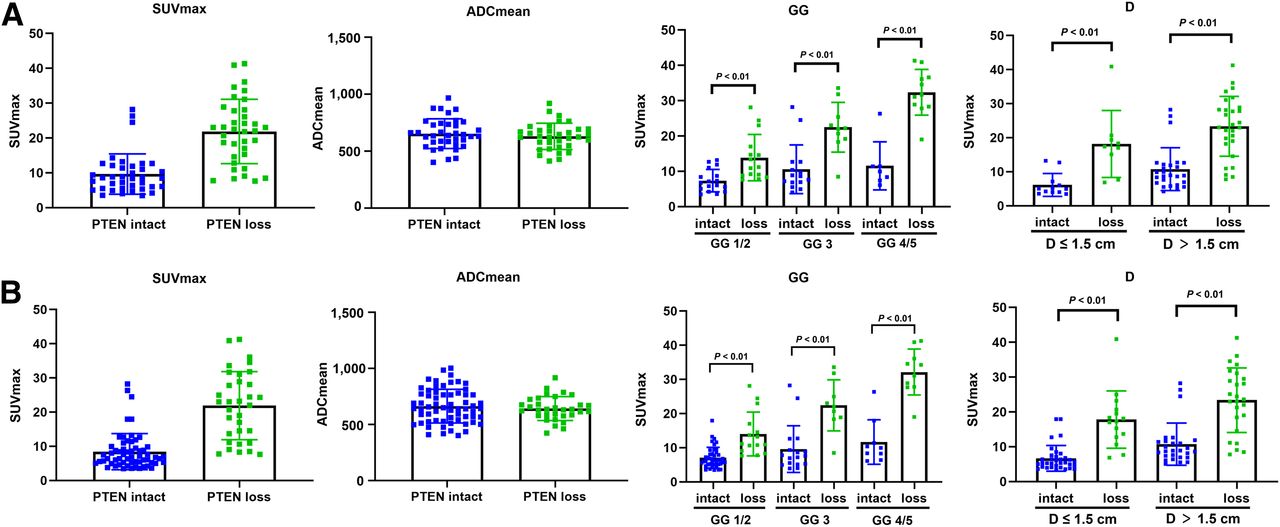
Distribution of SUVmax, ADCmean, GG, and tumor diameter (D) in lesions stratified by PTEN immunohistochemistry status in per-patient analysis (A) and per-lesion analysis (B).
Diagnostic Accuracy of Different Imaging Parameters for Detection of PTEN Status
Among all imaging parameters, including PI-RADS score, ADCmean, SUVmax, and maximum diameter of lesion on MRI, SUVmax showed the highest area under the curve in per-patient analysis (0.84; 95% CI, 0.73–0.94) and per-lesion analysis (0.88; 95% CI, 0.91–0.95). With a cutoff of 10.3 in SUVmax, the sensitivity and specificity for PTEN status were 0.80 and 0.77, respectively, in the per-patient analysis and 0.83 and 0.74, respectively, in the per-lesion analysis.
Univariate Logistic Regression Analyses of Clinical and Imaging Variables for the Identification of PTEN Status
To detect effective variables, univariate logistic regression analyses were performed for identification of PTEN status. Continuous variables including ADCmean and SUVmax were stratified by the cutoffs derived from the receiver-operating-characteristic analysis (Table 3). As shown in Table 4, SUVmax was the only effective variable to distinguish PTEN-loss PCa from PTEN-intact PCa, with odds ratios of 7.56 (95% CI, 2.18–26.24) and 13.66 (95% CI, 4.32–43.24) in the per-patient analysis and per-lesion analysis, respectively.
Diagnostic Accuracies of Different Imaging Parameters for Detection of PTEN Status
Univariate Logistic Regression Analyses of Clinical and Imaging Variables for Identification of PTEN Status
Pathologic PSMA Expression Between PTEN-Loss PCa and PTEN-Intact PCa
To compare the actual pathologic PSMA expression between PTEN-loss PCa and PTEN-intact PCa, 2 sets of 20 patients were randomly selected from both groups. Representative cases are shown in Figures 4A–4D. In line with the imaging findings, 18 of 20 (90.0%) PTEN-deficiency lesions showed an IRS score of more than 4, whereas 7 of 20 (35.0%) PTEN-intact lesions showed an IRS score of more than 4. Similarly, 30.0% (6/20) of PTEN-intact lesions showed an IRS classification of 2 or 3. However, 90.0% (18/20) of PTEN-loss lesions showed an IRS classification of 2 or 3 (Figs. 4E and 4F).

Pathologic PSMA expression in PTEN-intact PCa (n = 20) and PTEN-deficiency PCa (n = 20) by immunohistochemistry. (A) Patient 1, showing negative staining for PTEN in all tumor cells. (B) Similar region from adjacent section of patient 1 showing strong PSMA staining in all tumor cells. (C) Patient 2, showing intact staining for PTEN in all tumor cells. (D) Adjacent region of patient 2 showing weak PSMA staining in nearly all tumor cells. (E and F) IRS score and IRS classification distribution based on PTEN status. (F) P value was calculated using Fisher exact test for IRS classification < 2 vs. ≥ 2.
DISCUSSION
To our knowledge, this was the first study indicating the value of 68Ga-PSMA PET/CT for identifying aggressive PTEN-loss PCa. A higher SUVmax is a significant predictor of PTEN-loss tumor. With the cutoff, the sensitivity and specificity of SUVmax performs well for detection of PTEN-loss PCa in the per-patient analysis and per-lesion analysis. Furthermore, we found that higher pathologic PSMA expression correlates significantly with aggressive PTEN-loss PCa, as is in accordance with the SUVmax of 68Ga-PSMA PET/CT.
Recently, there has been a growing need for biomarkers that help to distinguish indolent from aggressive prostate tumors and add to current clinicopathologic risk stratification measures. PTEN is known as the most frequently deleted tumor suppressor gene in PCa, and the poor pathologic and clinical outcomes associated with its loss (21) have received much attention. An analytically validated assay, as shown by immunohistochemistry, demonstrated that PTEN protein loss is highly correlated with increased pathologic stage, Gleason grade, and decreased time to metastasis (18). Interestingly, a Fish analysis of 107 prostate tumors showed that PTEN genomic loss is an indicator of more advanced disease and a predictor of shorter time to biochemical recurrence, whereas they found that PTEN loss was not associated with Gleason score (4). Similarly, in our cohort, there was no specific relationship between GG and PTEN protein loss. The absence of a statistical relationship in our study may have arisen from the relatively small distribution of different GGs in our cohort.
MpMRI is currently regarded as an important tool in the management of PCa from diagnosis to risk stratification and surgical instruction. Determination of cancer aggressiveness using mpMRI has been addressed in several studies, and some studies have attempted to detect PTEN-inactivation PCa with the help of quantitative mpMRI parameters such as ADC. However, there is some debate as to whether ADC is associated with PTEN-deficiency PCa. McCann et al. demonstrated that ADCmean and ADC10% (tenth percentile ADC) are probably not associated with PTEN-efficiency PCa, as shown by immunohistochemistry (8). On the other hand, Switlyk et al. argued that ADC derived from DWI may be useful in selecting patients with potentially aggressive tumor caused by PTEN loss, using bead arrays and reverse-transcription quantitative polymerase chain reaction analysis (9). In our sample set, ADCmean played only a minor role in differentiation between PTEN-deficiency tumor and PTEN-intact tumor, unlike Switlyk et al. and in accord with the view of McCann et al. A possible explanation accounting for the differences is in the methods for detection of molecular aberrations. Our finding was based on immunohistochemistry analysis, whereas the results of Switlyk et al. were derived from bead arrays and reverse-transcription quantitative polymerase chain reaction analysis.
PSMA ligand PET/CT is an emerging modality to detect primary tumors, biochemical recurrence, and metastatic disease, especially in intermediate- and high-risk PCa (22). A multicenter trial has demonstrated that 68Ga-PSMA PET/CT is superior to morphologic imaging in predicting lymph node metastases in primary N staging in high-risk and very high-risk nonmetastatic PCa (23). In addition, 68Ga-PSMA PET/CT was demonstrated to have a role in identifying the aggressive cribriform morphology in PCa (24). Meanwhile, pathologic PSMA expression was analyzed and validated by immunohistochemistry, which demonstrated a good concordance with intake of PSMA ligand tracer (15). Hence, 68Ga-PSMA PET/CT is currently regarded as a promising noninvasive tool to characterize the aggressiveness of PCa, as has been confirmed in several other studies (13,25). In our study, we demonstrated that PSMA PET imaging may be a promising modality for the identification of PTEN-loss PCa. The diagnostic performance of SUVmax for distinguishing PTEN-loss tumor from PTEN-intact tumor was excellent, yielding sensitivity and specificity of 0.80 and 0.77, respectively, in the per-patient analysis and 0.83 and 0.74, respectively, in the per-lesion analysis. Similar results were observed in different GGs and tumor diameter. Surprisingly, higher SUVmax was the only significant predictor for detection of aggressive PTEN-deficiency tumor among a series of clinical and imaging parameters. Recently, tumor heterogeneity in PCa has attracted a lot of attention. Paschalis et al. (26) and Hofman et al. (27) have obtained achievements in this field. Their 2 publications emphasize the importance of identifying tumor heterogeneity in PCa to identify patients who may not respond to Lu-PSMA or will require additional therapies. Besides, they combined use of 68Ga-PSMA with 18F-FDG PET/CT and showed that 18F-FDG PET/CT–positive patients have a poor prognosis. In the same line, for patients with non–small cell lung cancer, Kaira et al. demonstrated that FDG PET/CT correlates with PTEN loss (28).
PTEN repression makes the PI3K/Akt pathway an important axis for new therapeutic targets (29–31). Caromile et al. demonstrated that an increased PSMA in prostate tumors contributes to progression by altering normal signal transduction pathways (from the mitogen-activated protein kinase to the PI3K-Akt) to drive PCa progression (32). On the basis of these novel therapeutic concepts, a potentially effective combination approach may be attempted for PTEN-silent PCa. Consequently, PTEN may be developed into a significant biomarker for detecting patients who could benefit from certain treatment regimens. On the basis of our results, tumors with higher intake of PSMA ligand on imaging should raise suspicion of PTEN loss. Our observations should be validated in larger cohorts and may be a preliminary exploration for identification of PTEN-loss tumor from information obtained on PSMA PET imaging.
Of course, our study had some limitations. First, it was retrospective and we used the final pathology result as a reference standard. Hence, a selection bias likely occurred. However, use of final pathology as a reference standard for evaluation of PTEN status is accurate and convincing. Second, our sample size was relatively small, although to compensate, we included every lesion on all images. Third, although combined PET/MRI is increasingly showing its superiority in PCa detection, further evaluation is needed on whether combined PET/MRI differentiates PTEN-loss tumors from PTEN-intact tumors with higher sensitivity and specificity.
CONCLUSION
This preliminary study revealed that 68Ga-PSMA PET/CT could effectively detect aggressive PTEN-loss PCa. These findings may help with the formation of therapeutic strategies to treat disease in a targeted way in patients with PTEN-loss tumors identified by PSMA PET/CT. Further investigations are warranted to validate our results with the aim of using PSMA PET imaging to provide prognostic information that can outperform current clinical criteria.
DISCLOSURE
This research was supported by the National Natural Science Foundation of China (81972388 and 81772710), the Project of Invigorating Healthcare through Science, Technology, and Education, Jiangsu Provincial Key Medical Discipline (Laboratory) (ZDXKB2016014), the National Natural Science Foundation of China (81802535), the China postdoctoral fund (223427), and the Nanjing Medical Science and Technique Development Foundation (YKK 18064). No other potential conflict of interest relevant to this article was reported.
KEY POINTS
QUESTION: What is the value of 68Ga-PSMA PET/CT for detection of aggressive PTEN-loss PCa?
PERTINENT FINDINGS: By analyzing 103 lesions in 75 patients who underwent mpMRI and 68Ga-PSMA PET/CT, we found that 68Ga-PSMA PET/CT could effectively detect aggressive PTEN-loss PCa. Besides, higher pathologic PSMA expression correlated significantly with aggressive PTEN-loss PCa, as is in accordance with SUVmax for 68Ga-PSMA PET/CT.
IMPLICATIONS FOR PATIENT CARE: Tumors with higher intake of PSMA ligand on imaging should raise suspicion of PTEN loss so that patients who could benefit from certain treatment regimens can be identified.
Footnotes
↵* Contributed equally to this work.
Published online Nov. 22, 2019.
- © 2020 by the Society of Nuclear Medicine and Molecular Imaging.
REFERENCES
- Received for publication September 4, 2019.
- Accepted for publication October 22, 2019.


Jump to section
Related Articles
Cited By...
- No citing articles found.