


Abstract
Type 1 diabetes mellitus (T1DM) has traditionally been characterized by a complete destruction of β-cell mass (BCM); however, there is growing evidence of possible residual BCM present in T1DM. Given the absence of in vivo tools to measure BCM, routine clinical measures of β-cell function (e.g., C-peptide release) may not reflect BCM. We previously demonstrated the potential utility of PET imaging with the dopamine D2 and D3 receptor agonist 3,4,4a,5,6,10b-hexahydro-2H-naphtho[1,2-b][1,4]oxazin-9-ol (11C-(+)-PHNO) to differentiate between healthy control (HC) and T1DM individuals. Methods: Sixteen individuals participated (10 men, 6 women; 9 HCs, 7 T1DMs). The average duration of diabetes was 18 ± 6 y (range, 14–30 y). Individuals underwent PET/CT scanning with a 120-min dynamic PET scan centered on the pancreas. One- and 2-tissue-compartment models were used to estimate pancreas and spleen distribution volume. Reference region approaches (spleen as reference) were also investigated. Quantitative PET measures were correlated with clinical outcome measures. Immunohistochemistry was performed to examine colocalization of dopamine receptors with endocrine hormones in HC and T1DM pancreatic tissue. Results: C-peptide release was not detectable in any T1DM individuals, whereas proinsulin was detectable in 3 of 5 T1DM individuals. Pancreas SUV ratio minus 1 (SUVR-1) (20–30 min; spleen as reference region) demonstrated a statistically significant reduction (−36.2%) in radioligand binding (HCs, 5.6; T1DMs, 3.6; P = 0.03). Age at diagnosis correlated significantly with pancreas SUVR-1 (20–30 min) (R2 = 0.67, P = 0.025). Duration of diabetes did not significantly correlate with pancreas SUVR-1 (20–30 min) (R2 = 0.36, P = 0.16). Mean acute C-peptide response to arginine at maximal glycemic potentiation did not significantly correlate with SUVR-1 (20–30 min) (R2 = 0.57, P = 0.05), nor did mean baseline proinsulin (R2 = 0.45, P = 0.10). Immunohistochemistry demonstrated colocalization of dopamine D3 receptor and dopamine D2 receptor in HCs. No colocalization of the dopamine D3 receptor or dopamine D2 receptor was seen with somatostatin, glucagon, or polypeptide Y. In a separate T1DM individual, no immunostaining was seen with dopamine D3 receptor, dopamine D2 receptor, or insulin antibodies, suggesting that loss of endocrine dopamine D3 receptor and dopamine D2 receptor expression accompanies loss of β-cell functional insulin secretory capacity. Conclusion: Thirty-minute scan durations and SUVR-1 provide quantitative outcome measures for 11C-(+)-PHNO, a dopamine D3 receptor–preferring agonist PET radioligand, to differentiate BCM in T1DM and HCs.
Type 1 diabetes mellitus (T1DM) has traditionally been characterized by a rapid and complete destruction of β-cell mass (BCM); however, there is growing evidence of possible residual BCM in individuals with T1DM (1). Measures of β-cell function (e.g., C-peptide release) are influenced by circulating glucose, insulin, and fatty acids levels, and individual β-cells may increase or decrease their functional demand, making measurements of β-cell function difficult to correlate with BCM (2–4). To add to the divergence of BCM and function, a recent study demonstrated that T1DM individuals could produce proinsulin but were not able to secrete insulin, suggestive of a residual, nonfunctional BCM in some T1DM individuals (5). With these factors in mind, total BCM must include measurement of functional β-cells and nonfunctional β-cells (viable cells that do not secrete insulin). The ability to quantify this total BCM in vivo in T1DM patients, combined with functional measures, would provide more accurate evaluation of disease progression and efficacy of therapies, such as islet transplantation or pharmacologic intervention (6). However, an in vivo clinical tool to measure total BCM, without residual binding on other cells besides β-cells, has remained elusive. We previously published a study demonstrating the potential utility of PET imaging with a dopamine D2 and D3 receptor agonist, 3,4,4a,5,6,10b-hexahydro-2H-naphtho[1,2-b][1,4]oxazin-9-ol (11C-(+)-PHNO), with 25- to 50-fold higher affinity for dopamine D3 receptors (7), to differentiate between healthy control (HC) and T1DM individuals as determined by pancreas radioligand uptake (8). In line with that publication, recent studies have demonstrated that dopamine is cosecreted with insulin and may act as an antiincretin by modulating insulin release through dopamine receptors on pancreatic β-cells (9–11). Given the potential utility of 11C-(+)-PHNO to measure BCM (8), an appropriate approach for quantitative analysis of radioligand uptake is warranted.
In the current study, we examined a cohort of HC and T1DM subjects and compared kinetic analysis methods to assess possible quantitative PET imaging measures for differentiating between HC and T1DM subjects. We then analyzed reference region approaches to examine the potential to provide accurate quantification without the need for arterial sampling. We also correlated quantitative PET imaging parameters to clinically relevant measures of β-cell function such as C-peptide, proinsulin, age at diagnosis, and duration of disease. In addition, we performed immunohistochemistry studies on independent samples of healthy and T1DM human pancreatic tissue samples to determine colocalization of dopamine receptors with endocrine hormones.
MATERIALS AND METHODS
Subjects
The study was approved by the Yale University Institutional Review Board and Radiation Safety Committees, and all subjects gave written informed consent. Sixteen individuals participated (10 men, 6 women; 9 HCs, 7 T1DMs). All HCs were screened to exclude existing diabetes (normal fasting C-peptide range, 0.8–3.1 ng/mL). Average age and weight of HCs were 29 ± 9 y (range, 22–52 y) and 78 ± 10 kg (body mass index, 25.6 ± 2.5 kg/m2), respectively. Average age and weight of the T1DM individuals were 34 ± 13 y (range, 22–53 y) and 78 ± 12 kg (body mass index, 24.2 ± 2.0 kg/m2), respectively. The differences in average age, weight, and body mass index between groups were not statistically significant (P = 0.38, 0.92, and 0.29, respectively). Average duration of diabetes at the time of the scan was 18 ± 6 y (range, 14–30 y).
β-Cell Function: Hyperglycemic Clamp with Arginine Stimulation
Individuals were studied as outpatients after an overnight fast (2 HCs, 5 T1DMs) after being admitted to the Yale University Hospital Research Unit and placed on a standard hospital protocol insulin drip overnight to normalize plasma glucose levels. In T1DM individuals, the insulin infusion was maintained during the study at a fixed rate of 1 unit/h in order to minimize the risk of ketosis. Hyperglycemia (target plasma glucose, 16.6 mmol/L) was maintained using a variable 20% dextrose infusion, adjusted every 5–10 min for 2 h, following the glucose clamp methodology described by DeFronzo et al. (12). During the clamp, arterialized blood samples were drawn and plasma samples for C-peptide and proinsulin measurements were immediately placed on ice, separated by centrifugation, and frozen before shipment to Northwest Lipid Metabolism and Diabetes Research Laboratories at the University of Washington and analyzed, as described previously (13).
Human Imaging
All subjects underwent PET/CT imaging on a Biograph mCT-X PET/CT system (Siemens Healthcare), with a 120-min dynamic scan (6 × 30 s, 3 × 60 s, 2 × 120 s, and 22 × 300 s) centered on the pancreas. The mean injected activity was 306 ± 54 MBq, and the mean injected mass was 0.022 ± 0.005 μg/kg. There were no differences in injected dose (HCs, 289 ± 43, vs. T1DMs, 327 ± 62 MBq; P = 0.28) or mass (HCs, 0.022 ± 0.006 μg/kg, vs. T1DMs, 0.023 ± 0.005 μg/kg; P = 0.79) between groups. Dynamic scans were reconstructed using an ordered-subset expectation maximization–based algorithm including point spread function and time of flight. Attenuation correction was performed using the CT acquisition. Regions of interest were drawn manually on a summed image (0–10 min) and then eroded to reduce partial-volume effects for pancreas and spleen. Time–activity curves were produced in SUV units, that is, normalized to tracer dose divided by body weight.
Kinetic Modeling of PET Data
Arterial cannulation was performed on a subset of subjects (6 HCs, 5 T1DMs). Blood glucose levels were measured before injection of the radioligand. Prescan blood glucose measurements were acquired (5 HCs, 5 T1DMs) with a small volume of blood (One Touch Ultra; Lifescan, Inc.). For radioactivity measurements, serial blood sampling was manually performed during the PET acquisition at defined intervals from 10 s to 120 min. Samples were measured on a γ-counter (1480 WIZARD 3” Automatic; Perkin Elmer) to determine radioactivity concentration in plasma. Arterial samples were processed for the time-varying fractions of 11C-(+)-PHNO and its metabolites using a high-performance liquid chromatography assay (14). The unmetabolized parent fraction was calculated as the ratio of the sum of radioactivity fractions containing the parent compound to the total amount of radioactivity collected. The arterial input function used for kinetic modeling was calculated as the product of the total plasma curve and the parent fraction curve.
Compartmental models using the arterial input function were applied to each time–activity curve to estimate the distribution volume (VT): the equilibrium ratio of tissue to plasma concentration (15). Both 1TC and 2-tissue-compartment models were used to estimate pancreas and spleen VT. Spleen VT was used as an index of nondisplaceable uptake to calculate binding potential (BPND, the ratio of specific to nonspecific radioligand concentration (15)), as has been proposed previously (16,17). Reference region methods were also investigated to quantify radioligand uptake without the need for arterial sampling. BPND was calculated using the simplified reference tissue model (SRTM) (18) (spleen as reference) with a maximum time (tmax) of 30, 70, or 120 min and the Logan reference region graphical model (19) (t* = 0, 10, or 20 min, and tmax = 30, 70, or 120 min). These model-based values were compared with static image values of SUV and pancreas SUV ratio minus 1 (SUVR-1) (spleen as reference) for the time periods 20–30 min and 60–70 min for all scans.
Immunohistochemistry
Formalin-fixed paraffin-embedded tissue samples were acquired from USB Biomax, Inc., the Yale Department of Pathology, or the Juvenile Diabetes Research Foundation Network for Pancreatic Organ Donors with Diabetes. Tissue sections were stained by direct or indirect immunofluorescence with an anti–dopamine D2 or D3 receptor antibody and costained with antibodies for insulin (β-cells), glucagon (α-cells), somatostatin (γ-cells), and polypeptide Y (PP cells), as described in Supplemental Table 1 (supplemental materials are available at http://jnm.snmjournals.org).
Statistical Analysis
Differences between groups were analyzed using a 2-tailed t test. Compartment modeling estimates of VT were correlated with pancreas SUV using a Pearson correlation. The 1TC model using spleen as a reference region to estimate BPND was correlated with SRTM BPND, Logan reference BPND, and SUVR-1 using Pearson correlation. Clinical outcome measures were also correlated to PET quantitative measures. SUVR-1 was correlated with age at diagnosis and duration of disease using the Pearson correlation coefficient, whereas C-peptide and proinsulin measurements were correlated with SUVR-1 using the Spearman rank correlation coefficient. All tests were performed using Minitab. A P value of less than 0.05 was considered statistically significant.
RESULTS
Metabolic Measures and β-Cell Function
Age at diagnosis, years of duration of T1DM, measured values of C-peptide release, and hemoglobin A1c values for T1DM individuals are shown in Table 1. Mean blood glucose levels before injection of radioligand significantly differed between HC and T1DM individuals, at 78.4 ± 7.6 mg/dL and 149.9 ± 37.0 mg/dL, respectively (P < 0.01) (Table 1). Quantitative measures of C-peptide release and proinsulin from plasma samples collected during the glucose clamp study are reported for T1DM individuals (n = 5) and HCs (n = 2) (Table 1). Table 1 demonstrates differences in proinsulin levels between subjects, whereas C-peptide was indistinguishable between most subjects.
Patient Data
Arterial Blood Measurements
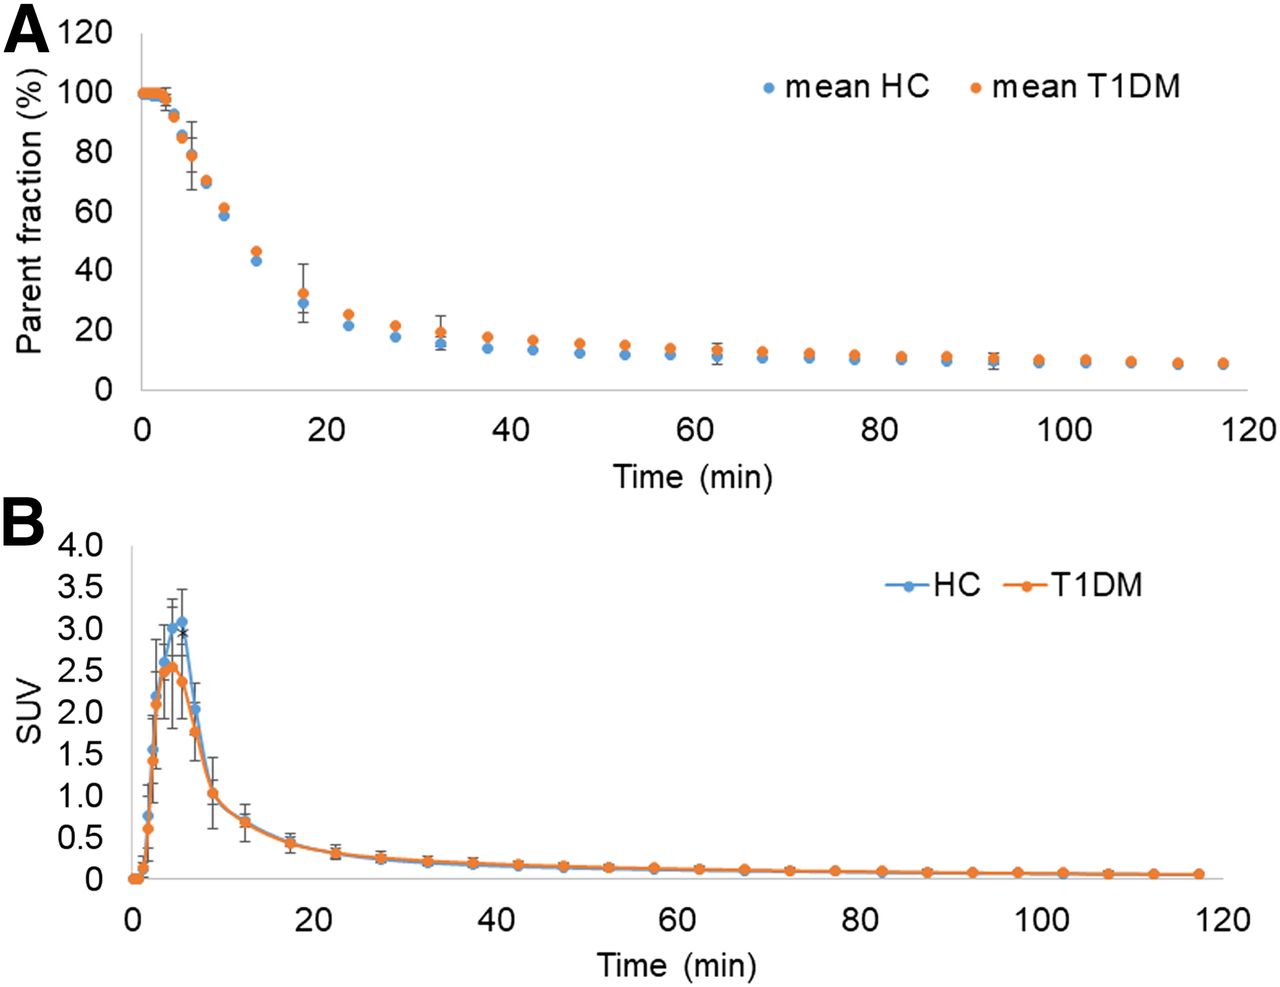
High-performance liquid chromatography analysis of radiolabeled metabolites of 11C-(+)-PHNO demonstrated the presence of 3 radiolabeled metabolites at 30 min after injection, compared with more than 90% unmetabolized radioligand at 3 min. The tracer had a rapid rate of metabolism and clearance, with less than 20% of the total radioactivity attributable to the parent at 30 min after injection (Fig. 1A). The plasma parent fraction did not differ significantly between groups at any time after injection (Fig. 1A). These data were used to construct the metabolite-corrected arterial input function: the values differed significantly at 5 min (P = 0.022) but did not differ significantly between groups at any other time after injection (Fig. 1B).

(A) Mean ± SD of parent fraction curves from HC and T1DM individuals. (B) Mean ± SD of metabolite-corrected arterial input functions from HC and T1DM individuals *Significant difference (P = 0.02) was seen between groups only at 5 min.
Kinetic Modeling and Quantitative Analysis of PET Image Data
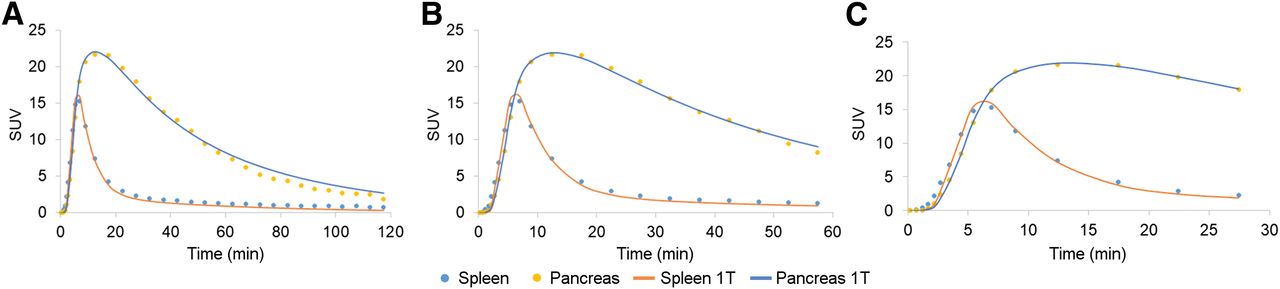
Representative PET SUV (20–30 min) maximum-intensity-projection images of 11C-(+)-PHNO for an HC and a T1DM demonstrate visual differences in pancreas radioligand uptake (Fig. 2). Compartment modeling was applied to the subset of subjects on whom arterial sampling was performed. The 1TC model fit the pancreas and spleen time–activity curves well for a tmax of 30 and 60 min but showed a clear lack of fit for a tmax of more than 60 min (Fig. 3). The 2-tissue-compartment model did not improve on the 1TC fits and in some cases did not provide reasonable estimates of VT. The effect of scan duration on VT estimates can be found in Supplemental Table 2.
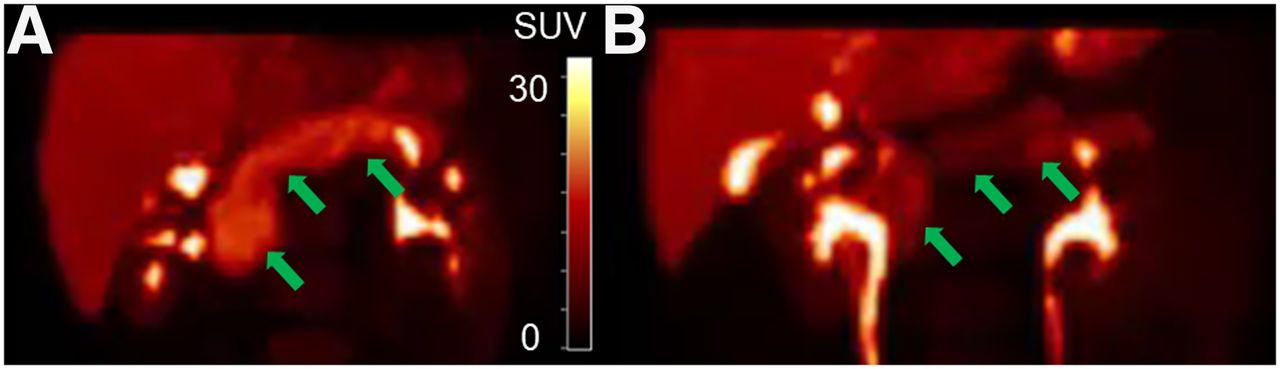
Representative maximum-intensity projections of PET SUV images (20–30 min) of 11C-(+)-PHNO pancreas (arrows) with uptake similar to SUV group means for HC (A) and type 1 diabetic mellitus (B) individuals. SUV scale = 0–30.

Representative time–activity curves for pancreas and spleen and 1TC model fits for tmax of 120 min (A), 60 min (B), and 30 min (C).
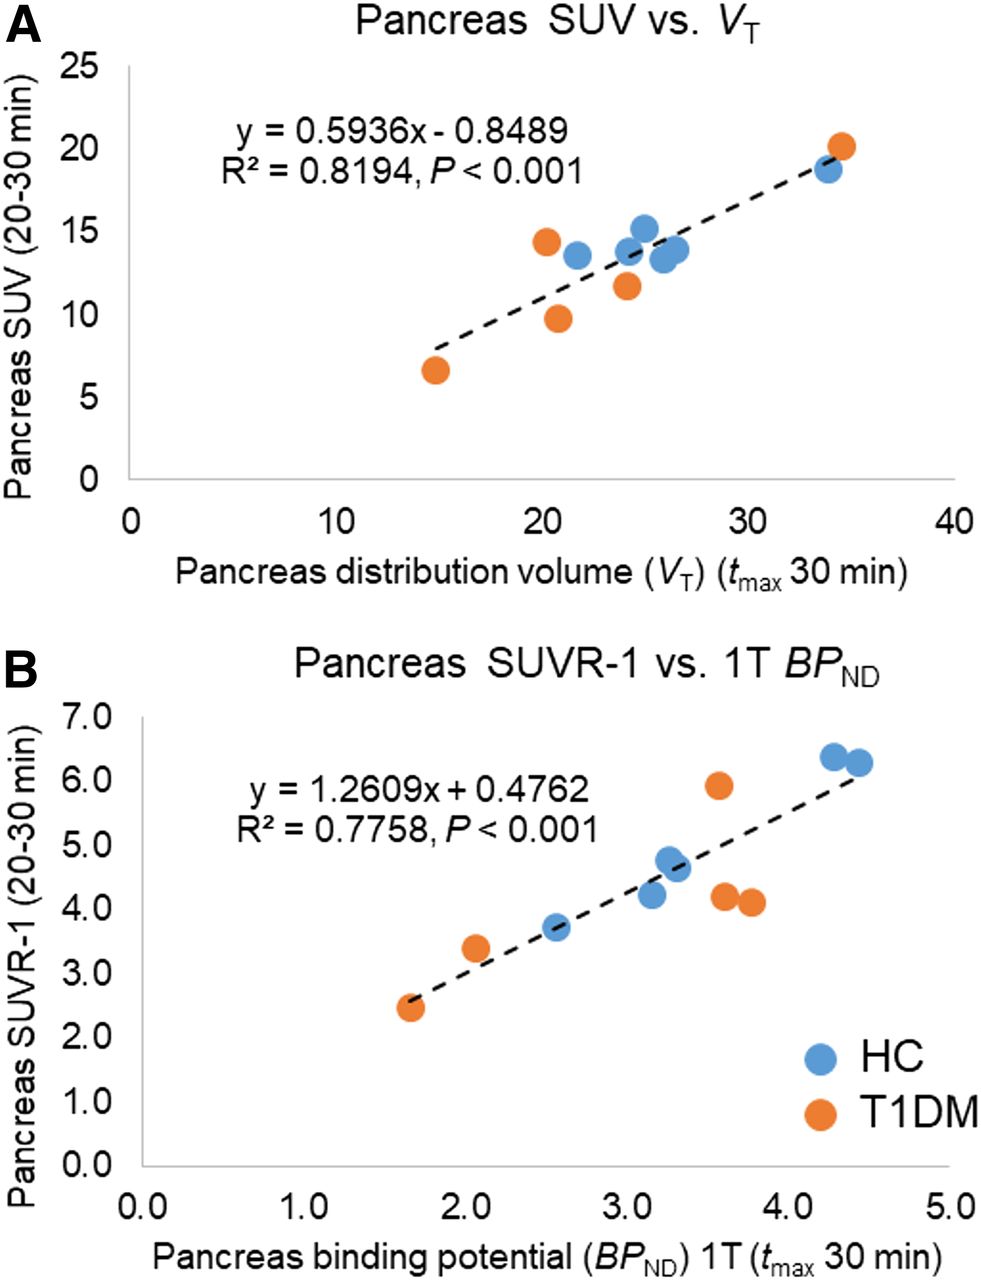
Simplified quantitative methods of SUV correlated well with pancreas VT estimates (Pearson R2 = 0.82, P < 0.001), and SUVR-1 (20–30 min) correlated well with pancreas BPND (Pearson R2 = 0.78, P < 0.001) estimated using the 1TC model in the cohort of subjects with arterial sampling, for whom the full kinetic modeling methods could be applied (Fig. 4). The good correlation of simplified methods without arterial sampling (SRTM, Logan, and SUVR-1) to the 1TC model allows for simplified group comparisons using the full dataset (Supplemental Figs. 1 and 2).

(A) Correlation of 1TC model (tmax, 30 min) pancreas VT values with pancreas SUV summed from 20 to 30 min. (B) Correlation of 1TC model (tmax, 30 min) pancreas BPND values (spleen as reference region) with pancreas SUVR-1 summed from 20 to 30 min.
Analysis of Group Differences
Pancreas SUVR-1 in T1DMs relative to HCs (20–30 min) demonstrated statistically significant lower (−36.2%) radioligand binding (HCs, 5.6; T1DMs, 3.6; P = 0.03) (Fig. 5). SRTM demonstrated a similar but nonsignificant difference of −31% in T1DM individuals versus HCs (BPND: HCs, 3.1, vs. T1DMs, 2.2; P = 0.06) (Supplemental Fig. 1C). Logan graphical analysis, with spleen as the reference region, also demonstrated a similar but nonsignificant difference of −31% in T1DM individuals versus HCs (BPND: HCs, 3.0, vs. T1DMs, 2.0; P = 0.05) (Supplemental Fig. 2C). Pancreas SUV (20–30 min) demonstrated a nonstatistically significant difference (−23%) in radioligand uptake (HCs, 14.5; T1DMs, 11.1; P = 0.14). No significant differences were seen between groups for spleen SUV from 20 to 30 min (HCs, 2.3; T1DMs, 2.4; P = 0.76).
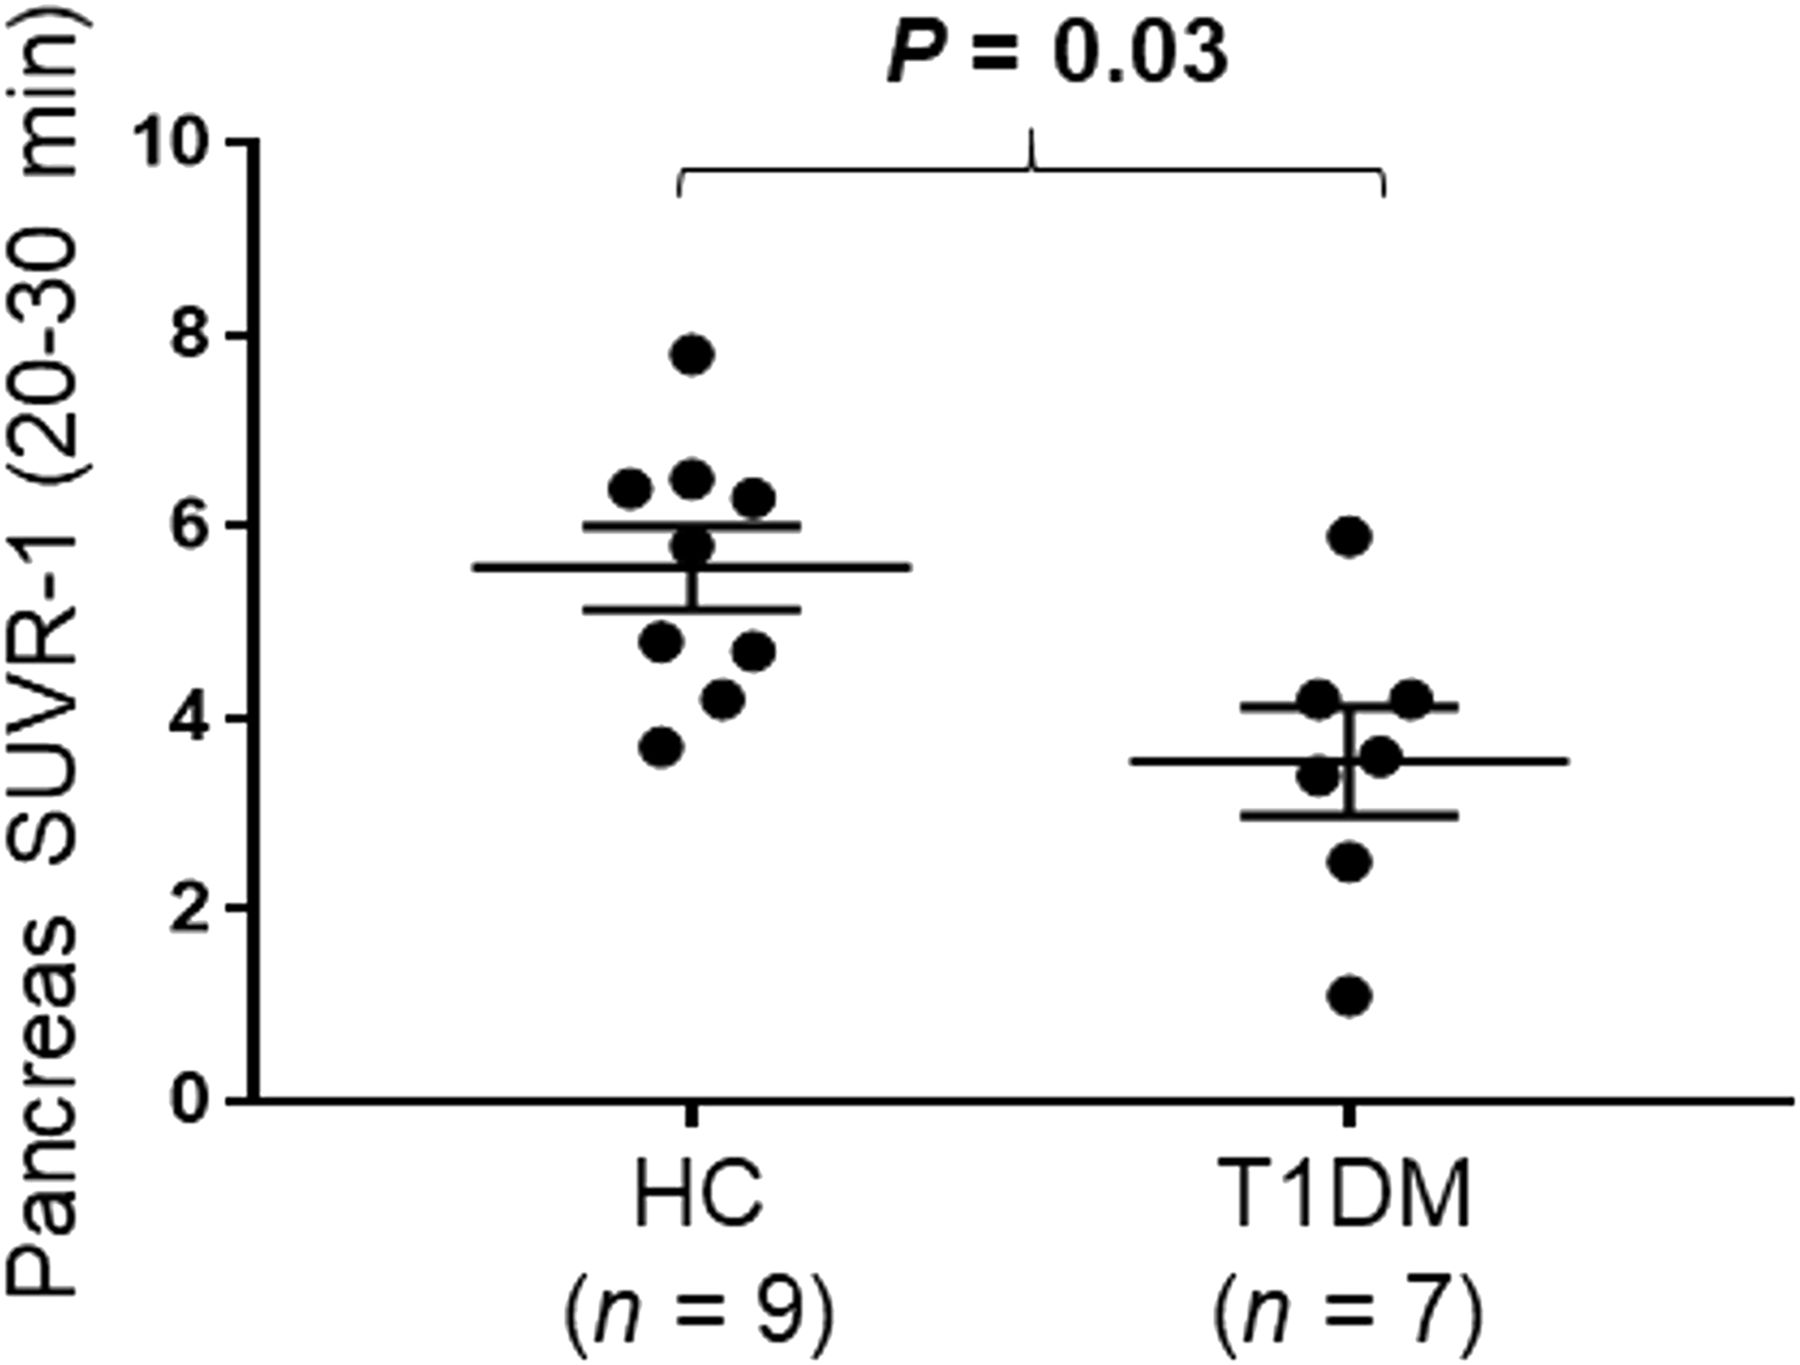
Dot plot demonstrating group differences between HCs and T1DMs for pancreas SUVR-1 (20–30 min). Data are mean ± SEM.
PET Radioligand Binding and Clinical Measures
Within the T1DM group, duration of diabetes did not significantly correlate with pancreas SUVR-1 (20–30 min) (R2 = 0.36, P = 0.16) (Fig. 6A). However, age at diagnosis correlated significantly with pancreas SUVR-1 (20–30 min) (R2 = 0.63, P = 0.032) (Fig. 6B). Age at diagnosis also significantly correlated with BPND estimated from both SRTM (R2 = 0.67, P = 0.025) and Logan (R2 = 0.72, P = 0.016). Mean acute C-peptide (arginine-stimulated maximum C-peptide) response to arginine at maximal glycemic potentiation approached trend-level significance with SUVR-1 (20–30 min) (Spearman rank correlation, R2 = 0.57, P = 0.05) (Fig. 6C). Mean baseline proinsulin also approached trend level in the correlation with SUVR-1 (20–30 min) (R2 = 0.45, P = 0.10) (Fig. 6D). Because of significant differences in pre-PET blood glucose levels between T1DMs (n = 7) and HCs (n = 5), we examined the relationship of pre-PET blood glucose levels to measures of PET radioligand binding: we found no significant correlations with pancreas BPND estimated using SRTM (R2 = 0.06, P = 0.46) or Logan (R2 = 0.06, P = 0.43) and pancreas SUVR-1 (20–30 min) (R2 = 0.14, P = 0.23).

(A and B) Pearson correlations of age at diagnosis with pancreas BPND SRTM (tmax, 30 min) (A) and age at diagnosis with pancreas SUVR-1 (20–30 min) (B). (C and D) Spearman rank correlation of C-peptide release from arginine stimulus test with SUVR-1 (20–30 min) (C) and proinsulin release from arginine stimulus test with SUVR-1 (20–30 min) (D). All methods use spleen as reference region.
Immunohistochemistry
Immunohistochemistry (Supplemental Fig. 3) demonstrated colocalization of dopamine D3 receptor and dopamine D2 receptor with insulin in HCs. No colocalization of the dopamine D3 receptor or dopamine D2 receptor was seen with somatostatin, glucagon, or polypeptide Y. In a T1DM individual, no immunostaining was seen with dopamine D3 receptor, dopamine D2 receptor, or insulin, suggesting the loss of dopamine D3 receptor and dopamine D2 receptor with loss of β-cell functional insulin capacity.
DISCUSSION
We had previously identified 11C-(+)-PHNO, a dopamine-3 receptor–preferring radioligand, as a potential tracer to measure BCM with PET imaging (8). In the current study, we first examined a cohort of HC and T1DM individuals with full kinetic modeling and arterial sampling to determine the most appropriate quantitative approach to measure radioligand binding of 11C-(+)-PHNO in the pancreas. Care must be taken when simplifying quantitative methods for potential use in clinical settings (20). Here, strong correlations were seen using full kinetic modeling (1TC) and using several reference region approaches (SRTM, Logan, and SUVR-1), which allowed for accurate quantification without arterial sampling. These reference region approaches demonstrated similar differences between T1DMs and HCs. We found correlations with PET quantitative measures that trended toward significance with AST C-peptide release or proinsulin. Using immunohistochemistry, we demonstrated a lack of staining for dopamine D2 receptor, dopamine D3 receptor, and insulin using immunohistochemistry in a T1DM tissue, whereas dopamine D2 receptor, dopamine D3 receptor, and insulin were colocalized in HCs. These studies suggest that 11C-(+)-PHNO, using rapid and simple quantification measures, can be useful to differentiate BCM in T1DMs and HCs.
There are various technical challenges for proper quantification of PET signals in abdominal organs. The rapid metabolism of the parent radioligand, 11C-(+)-PHNO, is demonstrated by the low percentage of parent ligand (<20%) by the end of our proposed scan duration (tmax = 30 min) (Fig. 1). Thus, radiolabeled metabolites are present in the blood and may be present in pancreas or spleen tissue. If there is substantial uptake of such metabolites, we would expect that 1TC estimates of VT, using the metabolite-corrected input function, would increase with time. However, the lack of increasing pancreas or spleen VT estimates with longer scan durations (Supplemental Table 2) suggests that radiolabeled metabolites are not a major confounding issue for these quantification methods. In any case, given the progressive lack of fit with the 1TC model with longer scans, and the good agreement between 30-min and 60-min VT values, we chose a 30-min scan to maximize patient comfort. There is the possibility that radiolabeled metabolites enter the pancreas and spleen tissues but are at equilibrium with plasma values, which would create stable VT estimates, since VT is the ratio of tissue to plasma radioligand concentrations at equilibrium. It is also possible that radiolabeled metabolites may not be at equilibrium with plasma but that, instead, both pancreas and spleen tissues are accumulating radiolabeled metabolites at similar fractions, as was seen in a previous study with 18F-FP-(+)-DTBZ (16). The metabolite-driven overestimation of VT is equal in the pancreas and the spleen. Since a reference region approach uses, for example, BPND = (VT target / VT reference) − 1, the proportions of equal metabolite VT contributions to pancreas (target) and spleen (reference) will cancel out.
The use of reference region approaches, when properly validated, allows for clinical protocols with shorter scan durations without the need for arterial sampling to accurately quantify radioligand uptake (20). In this study, no differences were seen between HC and T1DM individual spleen VT estimates, BPND, and SUV measures, suggesting the possibility of using the spleen as a reference region (Supplemental Table 1).
In our previous study, we did demonstrate reductions in spleen SUV in blocking studies on nonhuman primates with both dopamine D2 (−37%) and D3 receptor antagonists (−13%), suggesting that there may be some specific binding of 11C-(+)-PHNO in the spleen (8). Rat immunohistochemistry has demonstrated the presence of all 5 dopamine receptor subtypes in the spleen (21).
Immunohistochemistry staining demonstrated colocalization of dopamine D2 receptor and dopamine D3 receptor with insulin but was not colocalized with somatostatin, glucagon, or polypeptide Y, suggesting that that 11C-(+)-PHNO is bound only to insulin-producing β-cells. However, since both dopamine D2 receptor and dopamine D3 receptor stains were negative when insulin was negative in T1DM tissue, and both dopamine D2 receptor and dopamine D3 receptor were colocalized to insulin-producing cells, residual binding of dopamine D2 receptor in endocrine or exocrine tissue may not be an issue. Further tissue studies are warranted to confirm this hypothesis. Previous preclinical immunohistochemistry staining in mice suggested more diffuse dopamine D2 receptor and dopamine D3 receptor staining both in endocrine and in exocrine cells (9,10,22–29). These differences between murine and human receptor distributions were also seen in genetic expression reported in our previous study, where human dopamine D3 receptor gene expression was seen only in human β-cells, not in exocrine cells. Human dopamine D2 receptor gene expression was diffusely expressed throughout the exocrine and endocrine pancreas (8), in contradiction to our current immunohistochemistry results. The lack of residual functional and nonfunctional β-cells seen in our immunohistochemistry results may reflect only the small sample size of our human T1DM tissue slides obtained from the tissue bank of the Juvenile Diabetes Research Foundation Network for Pancreatic Organ Donors with Diabetes and may not reflect the full variability of T1DM subjects, who may have some nonfunctional BCM (30) that was not captured in the small volume of pancreas tissue examined. Evidence of both functional and nonfunctional BCM has been demonstrated in other immunohistochemistry characterizations of T1DM individuals (31,32); however, similar studies with the addition of dopamine immunostaining remain to be performed on a larger scale.
Interestingly, C-peptide release did not significantly correlate with our SRTM or SUVR-1 reference region binding measures. Our proinsulin measures did not significantly correlate with SRTM or SUVR-1; however, the measurable differences in proinsulin in our T1DM individuals who had no measurable C-peptide has been seen in several other studies and may be indicative of residual BCM (5,13). The wider spread of proinsulin values (Fig. 6D) than of C-peptide (Fig. 6C) detected in T1DM individuals may suggest differences in BCM in this cohort, as was previously demonstrated (5,13). In that longitudinal study of longstanding T1DM individuals (>3 y), 89.9% of individuals with no detectable C-peptide had detectable proinsulin, and these individuals included subjects with a duration of disease from 3 to more than 10 y, suggesting possible residual BCM (13). The understanding that residual BCM (both functional and nonfunctional [total BCM]) lasts well into the disease has been demonstrated in human tissue of T1DMs at various ages and durations of disease up to 50 y (1,5,13,30–32). In addition, the age at diagnosis has been interpreted to reflect the severity of T1DM and whether the subject has residual BCM (31,32). The younger the patient is at diagnosis, the more severe is the immune reaction and the more severe the subsequent β-cell death. Our strong correlation of PET radioligand uptake with age at diagnosis, and not with duration of disease, indirectly suggests we may be measuring residual BCM. Taken in combination with the lack of C-peptide correlation, but measurable proinsulin and 11C-(+)-PHNO uptake, we hypothesize that we are possibly measuring both functional and nonfunctional BCM. If true, the clinical utility of using 11C-(+)-PHNO to guide treatment options would be great. For example, if subjects have low C-peptide release (low function) but residual proinsulin and high radioligand uptake (high mass), they might be candidates for β-cell restoration therapy, because they appear to have a residual BCM population that is nonfunctional. If subjects have no C-peptide release (low function) and low proinsulin and radioligand uptake (no mass), they would more likely be candidates for islet transplantation therapy, as they would appear not to have any residual BCM.
To further understand the role of dopamine receptors in spleen and pancreas, additional studies are needed on larger HC and T1DM populations, both in vivo with 11C-(+)-PHNO PET and in vitro with more expansive immunohistochemistry and receptor homogenate–binding studies. The importance of doing such studies on human tissue was recently highlighted and needs to be addressed when validating PET radioligands to measure BCM (33). Additional studies examining pancreatic uptake of 11C-(+)-PHNO in the same individual across multiple previously examined radiotracers targeting VMAT2 (34), exendin (35), and serotonin (36) could be performed. Such studies could examine differences and similarities between proposed radioligands in HCs and T1DMs and help determine whether dopamine D2 and D3 receptor agonists are more sensitive than previous radioligands to changes in BCM.
CONCLUSION
These studies suggest that SUVR-1 can be useful to provide quantitative outcome measures for 11C-(+)-PHNO, a dopamine D3 receptor–preferring agonist PET radioligand, to differentiate BCM in T1DMs and HCs. The correlation of SUVR-1 with both proinsulin and age at diagnosis suggests that 11C-(+)-PHNO may be measuring BCM. Scan times of 30 min, without the need for arterial blood sampling, are sufficient and facilitate translation to clinical PET scan protocols.
DISCLOSURE
This study was supported by NIH grant DP3DK104092. This work was also made possible by S10RR029245 and by CTSA grant UL1 TR000142 from the National Center for Advancing Translational Sciences (NCATS), a component of the NIH. Its contents are solely the responsibility of the authors and do not necessarily represent the official view of the NIH. No other potential conflict of interest relevant to this article was reported.
KEY POINTS
QUESTION: Can PET imaging with the dopamine D2 and D3 receptor agonist 11C-(+)-PHNO be used as a measure of BCM?
PERTINENT FINDINGS: PET imaging quantification using SUVR-1 can be useful to provide quantitative outcome measures for 11C-(+)-PHNO, a dopamine D3 receptor–preferring agonist PET radioligand, to differentiate BCM in T1DMs and HCs. Clinically feasible short scan times of 30 min are sufficient for accurate PET quantification. The correlation of SUVR-1 with both proinsulin and age at diagnosis suggests that 11C-(+)-PHNO may be measuring BCM.
IMPLICATIONS FOR PATIENT CARE: In the future, 11C-(+)-PHNO, in combination with C-peptide and proinsulin measures, may provide the ability to guide treatment options between β-cell restoration therapy (residual nonfunctional BCM) or islet transplantation (no residual BCM).
Acknowledgments
We appreciate the excellent technical assistance of the Yale PET Center staff.
Footnotes
Published online Oct. 10, 2019.
- © 2020 by the Society of Nuclear Medicine and Molecular Imaging.
REFERENCES


Jump to section
Related Articles
Cited By...
- No citing articles found.