


Abstract
18F-BMS-986192, an adnectin-based human programmed cell death ligand 1 (PD-L1) tracer, was developed to noninvasively determine whole-body PD-L1 expression by PET. We evaluated the usability of 18F-BMS-986192 PET to detect different PD-L1 expression levels and therapy-induced changes in PD-L1 expression in tumors. Methods: In vitro binding assays with 18F-BMS-986192 were performed on human tumor cell lines with different total cellular and membrane PD-L1 protein expression levels. Subsequently, PET imaging was performed on immunodeficient mice xenografted with these cell lines. The mice were treated with interferon γ (IFNγ) intraperitoneally for 3 d or with the mitogen-activated protein kinase kinase inhibitor selumetinib by oral gavage for 24 h. Afterward, 18F-BMS-986192 was administered intravenously, followed by a 60-min dynamic PET scan. Tracer uptake was expressed as percentage injected dose per gram of tissue. Tissues were collected to evaluate ex vivo tracer biodistribution and to perform flow cytometric, Western blot, and immunohistochemical tumor analyses. Results: 18F-BMS-986192 uptake reflected PD-L1 membrane levels in tumor cell lines, and tumor tracer uptake in mice was associated with PD-L1 expression measured immunohistochemically. In vitro IFNγ treatment increased PD-L1 expression in the tumor cell lines and caused up to a 12-fold increase in tracer binding. In vivo, IFNγ affected neither PD-L1 tumor expression measured immunohistochemically nor 18F-BMS-986192 tumor uptake. In vitro, selumetinib downregulated cellular and membrane levels of PD-L1 in tumor cells by 50% as measured by Western blotting and flow cytometry. In mice, selumetinib lowered cellular, but not membrane, PD-L1 levels of tumors, and consequently, no treatment-induced change in 18F-BMS-986192 tumor uptake was observed. Conclusion: 18F-BMS-986192 PET imaging allows detection of membrane-expressed PD-L1 as soon as 60 min after tracer injection. The tracer can discriminate a range of tumor cell PD-L1 membrane expression levels.
Programmed cell death protein 1 (PD-1) and programmed cell death ligand 1 (PD-L1) inhibitors have radically improved treatment of patients with cancer. These drugs have been approved for treatment of many tumor types and for unresectable and microsatellite instable and mismatch repair deficient metastatic solid tumors (1). Combining a PD-1 antibody with the cytotoxic T-lymphocyte–associated protein 4 antibody ipilimumab increases efficacy in melanoma (2). In addition, numerous studies aim to improve efficacy by combining PD-1/PD-L1 antibodies with novel immune checkpoint inhibitors, targeted agents, chemotherapies, and radiotherapy (3).
Despite impressive antitumor effects, many patients do not respond to PD-1/PD-L1–targeted treatment. Still, these patients are at risk for side effects (4,5). To select patients who are most likely to respond to immune checkpoint inhibitors, immunohistochemical quantification of tumor cell PD-L1 expression can be performed (6). However, discrepancy between PD-L1 status and tumor response occurs (7,8). Immunohistochemical analysis of a single tumor-biopsy sample may fail to capture the heterogeneity of PD-L1 expression within and between lesions or the change in expression over time (9–12).
PET is a potential method to noninvasively evaluate whole-body PD-L1 expression levels. Radiolabeled antibodies targeting PD-1 or PD-L1 have been used in this context (7,13,14). Imaging with radiolabeled antibodies requires several days of tracer clearance from circulation to obtain PET images with adequate contrast (13). Given their fast tumor penetration and short serum half-lives, radiolabeled small molecules targeting PD-L1 could yield adequate contrast for imaging within 1 h, allowing imaging on the day of tracer injection (7). The approximately 12-kDa adnectin-based human PD-L1–targeting PET tracer 18F-BMS-986192 has been developed for this purpose (15). In preclinical studies, 18F-BMS-986192 imaging allowed distinction of a PD-L1–positive from a PD-L1–negative tumor within 2 h after tracer injection (16).
Here, we aimed to evaluate whether 18F-BMS-986192 PET can be used to distinguish different intrinsic PD-L1 expression levels in tumor cell lines and tumor xenografts in mice. Moreover, we investigated whether 18F-BMS-986192 PET can be used to detect therapy-induced modulation of PD-L1 expression levels. Ex vivo analysis of tumor tissue using flow cytometry, Western blotting, and immunohistochemistry was performed to evaluate PD-L1 expression levels.
MATERIALS AND METHODS
Cell Lines and Reagents
The human tumor cell lines H292 (lung mucoepidermoid carcinoma) and H358 (lung adenocarcinoma) were obtained from the American Type Culture Collection, H322 (human lung adenocarcinoma) was obtained from Sigma-Aldrich, and ES2 (human ovarian clear cell carcinoma) was a kind gift from Dr. Els Berns (Erasmus University Medical Center). All cells were cultured in RPMI 1640 (Invitrogen) medium with 10% fetal calf serum (Bodinco BV) (supplemented with 2 mM l-glutamine for H322 cells) and maintained in a humidified atmosphere with 5% CO2 at 37°C. Cells were regularly tested for Mycoplasma contamination and were proven to be Mycoplasma-negative. Cell line authentication was regularly performed using short tandem repeat profiling.
Tracer Production
The human PD-L1–specific PET tracer 18F-BMS-986192 was produced with a radiochemical purity of more than 90% and molar activity of more than 6,100 GBq/mmol according to a slightly modified version of a previously published protocol (supplemental methods (16); supplemental materials are available at http://jnm.snmjournals.org). In short, 18F-BMT-187144 is formed by fluorination of the precursor BMT-180478-01 (Bristol-Myers Squibb) with 18F-fluoride. Next, 18F-BMS-986192 is generated by a [2,3]-cycloaddition reaction of the cyclooctyne moiety in the anti-PD-L1 adnectin precursor BMT-192920 (Bristol-Myers Squibb) with the azide group in 18F-BMT-187144. Ultra-high-performance liquid chromatography was used to determine chemical and radiochemical purity, radiochemical identity, and molar activity (supplemental methods). In vitro and in vivo tracer stability were demonstrated previously (16).
Tracer-Binding Studies
For binding assays, 0.1 × 10⁶ cells were grown for 24 h in RPMI medium with 10% fetal calf serum in 24-well plates and treated with the inducer of PD-L1, interferon-γ (IFNγ; R&D systems), with a final concentration up to 6 × 10⁵ IU/mL (30 ng/mL, diluted in sterile water) (17). Tracer (1 MBq, 50 μL, 3,330 ng/mL, 167 ng) was added to each well, and cells were incubated for 60 min at 37°C. Competition assays were performed by adding 50 μL of a mixture of 1,400 ng/mL tracer solution with increasing amounts of nonradioactive 19F-BMS-986192 (from 5 ng/mL to 4 × 10⁵ ng/mL) to each well. After incubation, the cells were washed twice with 1 mL of ice-cold phosphate-buffered saline ([PBS] 9.7 mM Na2HPO4, 1.6 mM KH2PO4, 150 mM NaCl, pH 7.2) containing 1% human serum albumin. The cells were trypsinized, and medium was added. Cell suspensions were transferred to plastic tubes. Radioactivity in the cell fraction was measured in a γ-counter (Wizard2 2480-0019, SW 2.1; PerkinElmer). To correct for IFNγ-induced cytotoxicity, radioactivity was corrected for the number of viable cells, counted using trypan blue, and expressed as counts/min per 100,000 cells. Binding assays were performed in triplicate as a single assay. For modulation experiments, tumor cell lines were treated with 10 μM of the mitogen-activated protein kinase kinase 1/2 inhibitor selumetinib (AZD6244; Axon Medchem) for 24 h before analysis. Modulation experiments were performed in 3 independent biologic replicates.
Animal Studies
Animal studies were performed according to the Dutch Regulations for Animal Welfare. The protocol was approved by the animal ethical committee of the University of Groningen. To assess tracer binding in vivo, 5- to 8-wk-old immune-deficient BALB/c nude mice (BALB/cOlaHsd-Foxn1nu; Envigo) were subcutaneously inoculated with tumor cells in a mixture of Matrigel (high protein concentration; Corning) and PBS (H292, 5 × 10⁶ in 300 μL of Matrigel/PBS (1:1); H358, 2 × 10⁶ in 300 μL of Matrigel/PBS (1:1); ES2, 5 × 10⁶ in 300 μL of PBS). Tumor size and animal weight were measured 2 times per week. When tumors were 100–200 mm3, treatment studies and PET imaging studies were performed.
Treatment Studies
Mice xenografted with H292 cells were randomized between vehicle (diluent only) and IFNγ treatment. Recombinant human IFNγ was administered at different daily doses (1 × 10³, 1 × 10⁴, and 1 × 10⁵ IU, corresponding to 0.05, 0.5, and 5 μg; 5–6 mice per group) by intraperitoneal injection once daily for 3 d. On day 3, PET imaging studies were performed.
Mice xenografted with ES2 cells were randomized between vehicle treatment (diluent only) and selumetinib treatment groups (4–5 mice per group). Selumetinib was diluted in 0.2% polysorbate-80 and 0.5% hydroxyl-propyl methylcellulose (Sigma-Aldrich) and administered at 10 mg/kg twice daily by oral gavage, starting 24 h before PET scanning. The dosage was based on earlier research indicating minimal effects on tumor growth at this concentration (18).
PET Studies
For PET imaging, 18F-BMS-986192 (8.20 ± 4.74 MBq; average, 3 MBq/μg) was injected intravenously via the penile vein. Immediately after tracer injection, a 60-min dynamic PET scan was performed. The mice were placed in a Focus 220 rodent scanner (CTI Siemens) and kept warm on heating mats. After the emission scan, a transmission scan of 515 s was performed using a 57Co point source to correct for scatter, random coincidences, and tissue attenuation. After the scan, the mice were killed for an ex vivo biodistribution analysis. Organs were dissected and weighed, and their radioactivity was measured in a γ-counter. Uptake in the organs was calculated as percentage injected dose per gram of tissue (%ID/g).
PET Reconstruction
PET data were reconstructed into 10-min frames, and in vivo quantification was performed using PMOD software (version 4.0; PMOD Technologies LCC). Three-dimensional regions of interest were drawn around the tumor, based on ex vivo measured tumor volume, and a threshold equal to 40% of the maximum intensity was used to determine uptake. Necrotic parts of the tumor were excluded. For other organs, a fixed-size sphere was drawn in representative parts of the organs. Tracer uptake was calculated as the average uptake in the last frame (50–60 min after injection) and presented as %ID/g, based on previous results (16).
Ex Vivo and In Vitro Tumor Cell Analyses
For PD-L1 measurements with flow cytometry, xenograft tumors were incubated overnight in RPMI 1640, with 10% fetal calf serum, 16.7 μg/mL DNase (Roche Diagnostics Nederland B.V.), and 1 mg/mL collagenase type IV (Thermo Fischer Scientific) at room temperature. Single-cell suspensions were created using 70-μm cell strainers. For in vitro PD-L1 measurements, cells growing in monolayer were harvested using trypsin. For both ex vivo and in vitro cells, 100,000 cells were stained with anti-PD-L1 (clone 29E.2A3; BioLegend) and secondary antibodies against mouse IgG (polyclonal goat antimouse PE; Southern Biotec) or directly stained with phycoerythrin-labeled anti-PD-L1 (MIH-I; Invitrogen). At least 10,000 events were measured on the Accuri C6 (BD Biosciences) or FACSverse (BD Biosciences) apparatus. Data analysis was based on mean fluorescence intensity. For Western blot analysis, xenograft tumors were homogenized using the Bel-Art Micro-Tube Homogenizer (Thermo Fisher Scientific). Lysates from homogenized xenograft tumors and cell lines growing in monolayer were made using a mammalian protein extraction reagent with phosphatase and protease inhibitors diluted 1:100 (Thermo Fisher Scientific). Proteins were separated using sodium dodecyl sulfate polyacrylamide gel electrophoresis. Membranes were stained with 1:1,000 rabbit anti-PD-L1 (E1L3N; Cell Signaling Technology), glyceraldehyde 3-phosphate dehydrogenase (EPR6256; Abcam), and secondary horseradish peroxidase–antimouse or horseradish peroxidase–antirabbit antibodies at 1:1,500 (Dako). Detection was performed using Lumi-Light Western blotting substrate (Roche Diagnostics Nederland B.V.) and a digital imaging system (Bio-Rad). Western blot signals were quantified by measuring the relative optical density of the target protein, compared with the relative glyceraldehyde 3-phosphate dehydrogenase optical density using imageJ after subtraction of the background signal.
For immunohistochemistry, formalin-fixed paraffin-embedded xenograft tumors were cut into 4-μm slices and placed on glass slides. Antigen was retrieved using universal heat-induced epitope retrieval reagent (Abcam), followed by endogenous peroxidase block (S2003; Dako), endogenous IgG block (X0909; Dako), and incubation with anti-PD-L1 antibody (clone 28–8; Abcam) for 60 min. Next, sections were incubated with antirabbit Dako EnVision+ polymer for 30 min (K4010; Dako). The staining was visualized using 3,3′-diaminobenzidine+ substrate (K3468; Dako) and counterstained using hematoxylin.
Statistical Analysis
Data are presented as mean ± SD. A t test, Kruskal–Wallis test with Dunn multiple-comparison test, or ANOVA with Bonferroni multiple-comparison test was performed to compare groups (GraphPad; Prism 7). P values of less than 0.05 were considered statistically significant.
RESULTS
18F-BMS-986192 Binding Increases with Higher PD-L1 Expression
To study the ability of 18F-BMS-986192 to detect a range of PD-L1 levels, we selected 4 tumor cell lines with different basal PD-L1 membrane expression levels in vitro as measured by flow cytometry (Fig. 1A). Binding assays confirmed 2-fold increased binding of 18F-BMS-986192 to H358 cells, compared with H292 cells, corresponding to the difference in basal PD-L1 expression (Supplemental Fig. 1A). Tracer binding could be blocked by adding nonradioactive 19F-BMS-986192, indicating specific binding (Supplemental Fig. 1B). In vivo PET experiments were performed with xenograft models of H292, H358, and ES2. 18F-BMS-986192 uptake in the different xenograft models when measured with PET imaging (%ID/g ± SD: H292, 1.33 ± 0.37; H358, 1.62 ± 0.86; ES2, 2.36 ± 1.07) and ex vivo biodistribution (%ID/g ± SD: H292, 1.64 ± 0.60; H358, 2.81 ± 1.84; ES2, 4.25 ± 2.3) was associated with PD-L1 expression (Figs. 1B and 1C). Western blot and immunohistochemical analysis confirmed the differential PD-L1 expression levels in vivo, with ES2 showing the highest PD-L1 levels (Figs. 1D and 1E). Tracer levels in other organs were low, except at the site of renal excretion (Supplemental Figs. 1C and 1D).
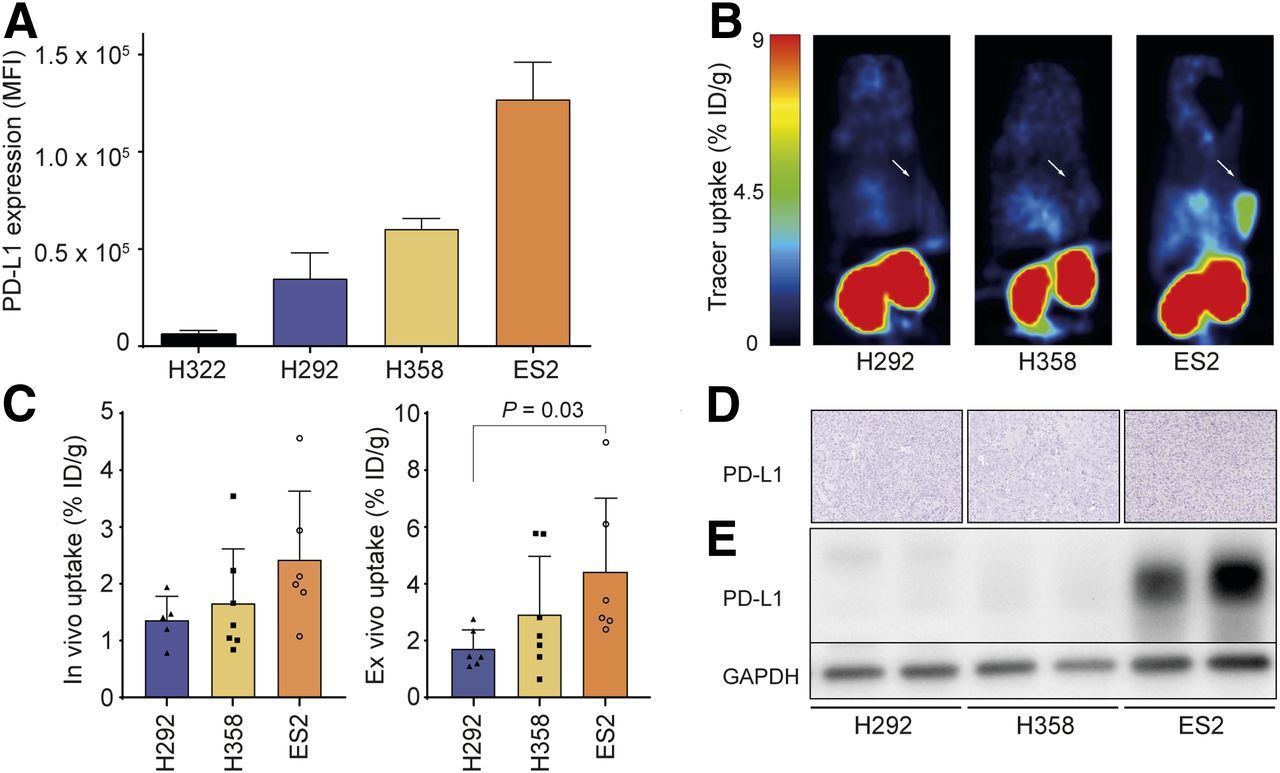
PD-L1 expression correlates with tracer uptake. (A) Basal PD-L1 membrane expression of panel of in vitro cultured cell lines as determined with flow cytometry. (B) In vivo tracer distribution in %ID/g 60 min after injection of 18F-BMS-986192 in BALB/c nude mice with subcutaneous H292, H358, or ES2 tumors. White arrow indicates location of tumor. (C) In vivo and ex vivo 18F-BMS-986192 uptake in xenografts 60 min after tracer injection. (D and E) Tumor PD-L1 expression levels as analyzed using immunohistochemistry (D) and Western blotting (E). Data are presented as mean + SD. GAPDH = glyceraldehyde 3-phosphate dehydrogenase; MFI = mean fluorescence intensity.
18F-BMS-986192 Tumor Uptake Reflects Failure of IFNγ to Induce PD-L1 Expression In Vivo
We have previously demonstrated that the proinflammatory cytokine IFNγ activates the IFNγ signaling pathway and increases both total protein and membrane levels of PD-L1 in H292 and H358 cells in vitro (19). In the present study, these cell lines showed increased tracer binding after 24 h of treatment with IFNγ in vitro (Supplemental Fig. 2A). Both in vivo PET results and ex vivo analyses showed a minor trend toward higher 18F-BMS-986192 uptake in H292 tumors after treatment of the mice with up to 105 IU of IFNγ daily for 3 d (Fig. 2A). Treatment did not influence tumor volume. In other organs, no difference in tracer distribution was observed (Supplemental Figs. 2B and 2C). Western blot and immunohistochemical analysis confirmed that IFNγ treatment failed to increase PD-L1 expression in tumors, with only a nonsignificant increase in IFNγ-signaling protein pSTAT1, a known activator of PD-L1 transcription (Figs. 2B and 2C).
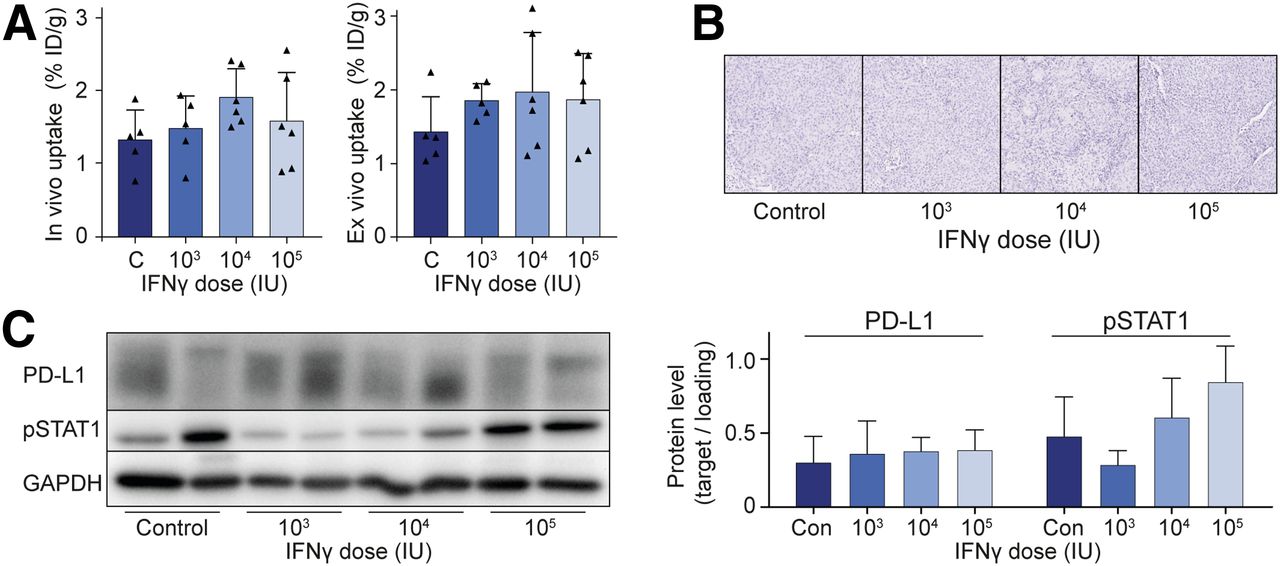
IFNγ fails to induce PD-L1 expression in vivo. (A) In vivo and ex vivo tracer uptake in %ID/g 60 min after injection of 18F-BMS-986192 in BALB/c nude mice, with subcutaneous H292 xenografts treated with IFNγ once daily for 3 d by intraperitoneal injection. (B and C) H292 xenograft PD-L1 expression after treatment with different doses of IFNγ as measured using immunohistochemistry (B) and Western blotting (C). PD-L1 and pSTAT1 were measured in triplicate and quantified relative to glyceraldehyde 3-phosphate dehydrogenase (GAPDH). Data are presented as mean + SD. C and Con = control; IU = international units.
18F-BMS-986192 Tumor Uptake Reflects Failure of Selumetinib to Reduce Tumor Cell PD-L1 Membrane Expression Levels In Vivo
Next, we investigated whether 18F-BMS-986192 could detect treatment-induced downregulation of PD-L1. In vitro treatment of the strongly PD-L1–positive ES2 cells with selumetinib for 24 h resulted in a complete blockade of mitogen-activated protein kinase kinase 1/2 signaling and approximately 50% downregulation of PD-L1 membrane expression levels and total PD-L1 protein expression (Fig. 3A). In vivo and ex vivo analyses showed that 1 d of treatment with 10 mg/kg selumetinib by oral gavage did not alter 18F-BMS-986192 tumor uptake or biodistribution compared with vehicle-treated mice (Figs. 3B; Supplemental Figs. 3A and 3B). Moreover, flow cytometric analysis confirmed that selumetinib treatment did not lead to a reduction of tumor cell PD-L1 membrane expression levels (Fig. 3C). Ex vivo analysis, however, showed that the treatment effectively inhibited mitogen-activated protein kinase kinase 1/2 signaling and cellular PD-L1 expression (Figs. 3D and 3E). Treatment did not influence tumor volume. These results indicate that 18F-BMS-986192 specifically detects PD-L1 membrane levels and that tracer uptake is not influenced by cellular PD-L1 levels.
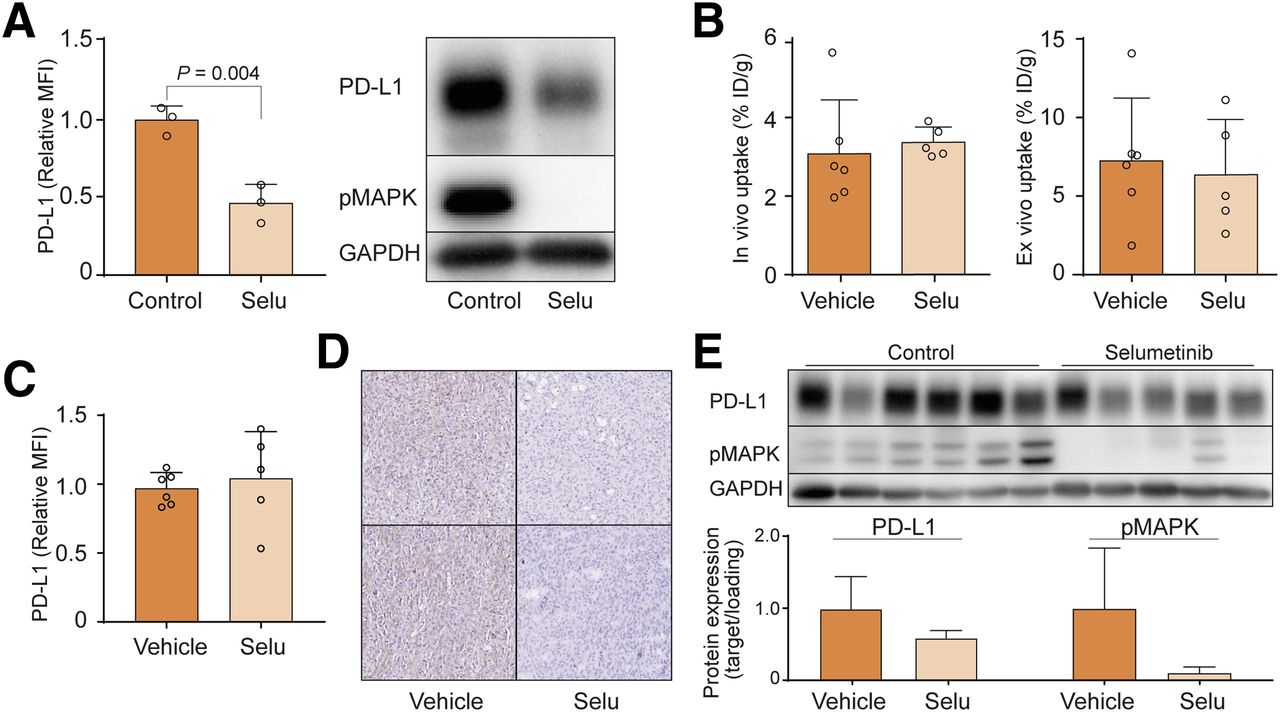
Selumetinib decreased PD-L1 expression in vitro and in vivo. (A) ES2 cells were treated in vitro with 10 μM selumetinib for 24 h, followed by flow cytometry and Western blotting of PD-L1 membrane and total protein expression and MAPK signaling. (B) In vivo and ex vivo tracer uptake in %ID/g 60 min after injection of 18F-BMS-986192 in BALB/c nude mice with subcutaneous ES2 tumors and treated 2 times with 10 mg/kg selumetinib for 24 h by oral gavage. (C–E) Tumor cell PD-L1 levels as measured using flow cytometry (C), immunohistochemistry (D), and Western blotting (E). Additionally, pMAPK and PD-L1 were quantified by measuring their signal relative to glyceraldehyde 3-phosphate dehydrogenase (GAPDH) signal. Data are presented as mean + SD. MFI = mean fluorescence intensity; pMAPK = phosphorylated mitogen-activated protein kinase; Selu = selumetinib.
DISCUSSION
In this study, we assessed the utility of 18F-BMS-986192 PET to noninvasively measure PD-L1 expression levels. 18F-BMS-986192 tumor uptake was related to basal PD-L1 expression in cell lines and in xenograft models, enabling noninvasive detection of differential PD-L1 membrane levels. Selumetinib treatment reduced cellular PD-L1 expression. However, PD-L1 membrane levels were not altered by treatment with IFNγ or selumetinib. Tracer uptake was not affected by treatment, suggesting that 18F-BMS-986192 PET reflects membrane levels, rather than cellular expression, of PD-L1.
To our knowledge, this was the first study demonstrating that same-day PET imaging with an adnectin-based tracer discriminates low from moderate and high tumor cell PD-L1 expression using preclinical in vivo models. 18F-BMS-986192 can detect 2-fold differences in PD-L1 membrane levels. Tumor uptake of 18F-BMS-986192, expressed as %ID/g, is lower than uptake with monoclonal antibody–based tracers, although similar to results in other preclinical studies evaluating same-day imaging of PD-L1 (20–24). 18F-BMS-986192 is specific for human PD-L1, with picomolar dissociation constants (<35 pM). This prevents mouse tissues from influencing tracer uptake (16). However, in humanized immune-competent models, with human PD-L1–expressing immune cells, tracer distribution might be different. Moreover, in these models and in patients, tracer uptake in the tumor might differ because of increased tumor cell PD-L1 expression and PD-L1–positive tumor immune cell infiltration (25).
To study imaging of treatment-induced changes in PD-L1 expression, we aimed to modulate PD-L1 expression levels in tumor xenografts. IFNγ, a well-known inducer of tumor cell PD-L1 expression in vitro (26), failed to increase tumor cell PD-L1 expression in vivo. Although intravenous administration of IFNγ increases mouse lung PD-L1 expression and intraperitoneal administration of IFNγ sensitizes xenograft models for pemetrexed, direct evidence of tumor cell PD-L1 upregulation by IFNγ in vivo is sparse (4,27,28). Because PD-L1 expression is regulated on many levels, it may be that factors critical for PD-L1 upregulation are missing in the tumor microenvironment of H292 xenografts (4). Additionally, we aimed to reduce PD-L1 expression of tumors by treatment with selumetinib. Despite reduced total PD-L1 protein levels, PD-L1 membrane levels and tumor 18F-BMS-986192 uptake were not affected after treatment in vivo. Multiple posttranslational mechanisms, including altered recycling of PD-L1 to the cell membrane, may give rise to the lack of correlation between total PD-L1 protein levels and PD-L1 membrane levels (29–32). In our model, the reduction of total protein levels in vivo may be followed by a delayed reduction in PD-L1 membrane levels, after the 24-h time point. In addition, tracer uptake corresponded better with PD-L1 membrane expression than with total protein levels of PD-L1 (Supplemental Fig. 4). These modulation experiments show the challenges of studying immune checkpoint biology in preclinical models. The complex interaction between cell types in the tumor microenvironment is suboptimally reflected in mouse models, urging critical evaluation of clinical validity of preclinical findings. However, we were still able to detect different tumor cell PD-L1 levels, indicating that serial imaging with this tracer in patients may provide insight into treatment effects on PD-L1 membrane levels. Interestingly, most approved PD-L1 immunohistochemical assays measure the membrane-bound fraction of PD-L1, because this is hypothesized to be immunologically most active (33).
Clinically, PD-L1 imaging has the potential to predict response to immunotherapy better than PD-L1 immunohistochemistry, as shown in the first-in-human clinical study with the anti-PD-L1 monoclonal antibody 89Zr-atezolizumab (34). Comparing 89Zr-atezolizumab imaging with a clinical study using 18F-BMS-986192, results suggest that this PD-L1 antibody-based PET tracer reaches higher target uptake levels than 18F-BMS-986192 (34,35). However, the short serum half-life and rapid diffusion of 18F-BMS-986192 enable same-day imaging with high-contrast images and reduced radiation burden (35,36). This advantage might allow rapid follow-up of treatment-induced changes in PD-L1 expression with PET imaging. Also, it enables combined PET imaging of multiple targets on subsequent days, providing more information. The feasibility of imaging multiple immunotherapy-related targets in a single patient was shown in a small study using 18F-BMS-986192 in combination with PD-1–targeting 89Zr-nivolumab in 13 patients (35). Currently, 18F-BMS-986192 is being further investigated in metastatic melanoma, non–small cell lung cancer, and oral cancer. 18F-BMS-986192 PET imaging is performed at baseline and during nivolumab treatment (ClinicalTrials.gov identifiers NCT03520634 and NCT03843515). In both studies, PET uptake will be correlated with PD-L1 expression in biopsy samples measured by immunohistochemistry. Future larger studies will have to define the precise role of PET imaging in predicting tumor response to immune checkpoint inhibitors or to study treatment effects on PD-L1 expression by performing serial imaging.
CONCLUSION
18F-BMS-986192 PET imaging can be used to noninvasively quantify PD-L1 membrane levels. This ability makes it a potential tool to study PD-L1 expression dynamics and predict responses to immunotherapy. Further clinical evaluation will be necessary to validate these findings in humans.
DISCLOSURE
Erik de Vries reports grants from ZonMW (grants 95104008 and 95105010) and from the Dutch Cancer Foundation (grant RUG2015-7235) during the conduct of the study and has performed contract research studies with Rodin Therapeutics, Lysosomal Therapeutics Inc., Hoffmann-La Roche Ltd., and Ionis Pharmaceuticals, with funds made available to the institution outside the submitted work. Geke Hospers reports a consulting and advisory role for Amgen, Roche, MSD, BMS, Pfizer, and Novartis and has received grants from BMS and Seerave, made available to the institution outside the submitted work. Elisabeth de Vries reports grants from IMI TRISTAN (GA grant 116106) during the conduct of the study; has a consulting and advisory role for NSABP, Daiichi Sankyo, Pfizer, Sanofi, Merck, and Synthon Biopharmaceuticals; and has received grants from Amgen, Genentech, Roche, Chugai Pharma, CytomX Therapeutics, Nordic Nanovector, G1 Therapeutics, AstraZeneca, Radius Health, and Bayer, all made available to the institution outside the submitted work. Cooperators at Bristol Meyers Squibb approved the preclinical design and the final version of the manuscript. Thijs S. Stutvoet is supported by a fellowship of the Junior Scientific Master Class of the University of Groningen. No other potential conflict of interest relevant to this article was reported.
KEY POINTS
QUESTION: Can 18F-BMS-986192 PET be used to detect different PD-L1 expression levels and therapy-induced changes in tumor cell PD-L1 expression?
PERTINENT FINDINGS: 18F-BMS-986192 PET imaging in immune-competent tumor-bearing mice allows detection of PD-L1 membrane levels as soon as 60 min after tracer injection. The tracer can discriminate a range of tumor cell PD-L1 membrane levels.
IMPLICATIONS FOR PATIENT CARE: 18F-BMS-986192 PET imaging might be a potential tool to study PD-L1 expression dynamics and predict responses to immunotherapy in humans.
Acknowledgments
We thank Ralph Adam Smith, Wendy Hayes, David Leung, David J. Donnelly, Samuel J. Bonacorsi, and Paul Morin for their efforts to support the work performed during this study.
Footnotes
↵* Contributed equally to this work.
Published online May 1, 2020.
- © 2020 by the Society of Nuclear Medicine and Molecular Imaging.
REFERENCES
- Received for publication January 9, 2020.
- Accepted for publication March 31, 2020.


Jump to section
Related Articles
Cited By...
- 89Zr-DFO-Durvalumab PET/CT Before Durvalumab Treatment in Patients with Recurrent or Metastatic Head and Neck Cancer
- Optimizing Immuno-PET Imaging of Tumor PD-L1 Expression: Pharmacokinetic, Biodistribution, and Dosimetric Comparisons of 89Zr-Labeled Anti-PD-L1 Antibody Formats
- 18F-BMS986192 PET Imaging of PD-L1 in Metastatic Melanoma Patients with Brain Metastases Treated with Immune Checkpoint Inhibitors: A Pilot Study