


Abstract
The aim of this work was to quantify the uptake of 18F-BMS-986192, a programmed cell death ligand 1 (PD-L1) adnectin PET tracer, in patients with non–small cell lung cancer. To this end, plasma input kinetic modeling of dynamic tumor uptake data with online arterial blood sampling was performed. In addition, the accuracy of simplified uptake metrics such as SUV was investigated. Methods: Data from a study with 18F-BMS-986192 in patients with advanced-stage non–small cell lung cancer eligible for nivolumab treatment were used if a dynamic scan was available and lesions were present in the field of view of the dynamic scan. After injection of 18F-BMS-986192, a 60-min dynamic PET/CT scan was started, followed by a 30-min whole-body PET/CT scan. Continuous arterial and discrete arterial and venous blood sampling were performed to determine a plasma input function. Tumor time–activity curves were fitted by several plasma input kinetic models. Simplified uptake parameters included tumor-to-blood ratio as well as several SUV measures. Results: Twenty-two tumors in 9 patients were analyzed. The arterial plasma input single-tissue reversible compartment model with fitted blood volume fraction seems to be the most preferred model as it best fitted 11 of 18 tumor time–activity curves. The distribution volume (VT) ranged from 0.4 to 4.8 mL⋅cm−3. Similar values were obtained with an image-derived input function. From the simplified measures, SUV normalized for body weight at 50 and 67 min after injection correlated best with VT, with an R2 of more than 0.9. Conclusion: A single-tissue reversible model can be used to quantify tumor uptake of the PD-L1 PET tracer 18F-BMS-986192. SUV at 60 min after injection, normalized for body weight, is an accurate simplified parameter for uptake assessment of baseline studies. To assess its predictive value for response evaluation during programmed cell death protein 1 or PD-L1 immune checkpoint inhibition, further validation of SUV against VT based on an image-derived input function is recommended.
Non–small cell lung cancer has the highest mortality rate of solid tumors worldwide (1). Over the last few years, treatment with immune checkpoint inhibitors has improved both progression-free survival and overall survival in these patients (2–4). Selecting patients who benefit most from immune checkpoint inhibitor treatment remains challenging. Tumor PD-L1 expression as measured by immunohistochemistry is predictive for response and survival to some extent (2,5). However, only approximately 40% of all programmed cell death ligand 1 (PD-L1)–positive patients respond to therapy, whereas 10% of the PD-L1–negative patients show a favorable response to immune checkpoint inhibitors (6). These differences may be explained by the heterogeneity of PD-L1 expression in tumors (7). Moreover, tumor microenvironment, tumor mutational burden, activated oncogenic pathways, and neoantigen presentation are only some of the additional factors that might influence the response to the immunotherapy (8–10). PET can be used for in vivo visualization of specific molecular targets (11).
Recently, 18F-BMS-986192 (an 18F-labeled anti–PD-L1 adnectin) was introduced to visualize PD-L1 expression in non–small cell lung cancer. In vivo PET imaging demonstrated PD-L1 expression in mice implanted with PD-L1–positive L2987 xenograft tumors along with radioligand binding blocked in a dose-dependent manner (12). Subsequently, a proof-of-principle study showed that in vivo molecular imaging of PD-L1 is feasible and safe in patients with non–small cell lung cancer (13). Tumors expressing at least 50% PD-L1 expression had a higher uptake of 18F-BMS-986192 than lesions expressing less than 50% PD-L1 expression, and responding lesions tended to have higher uptake of 18F-BMS-986192. Additionally, heterogeneity in uptake both between and within patients was demonstrated, suggesting a potential role for 18F-BMS-986192 PET as a clinical biomarker. This may explain why a subset of tumor PD-L1–negative patients responds to immune checkpoint inhibitors.
The aim of this study was to identify the optimal pharmacokinetic model to quantify 18F-BMS-986192 kinetics in patients with non–small cell lung cancer. To this end, kinetic modeling of dynamic tumor uptake data was performed with arterially sampled blood as input function. In addition, the applicability of simplified uptake metrics, such as SUV, was investigated.
MATERIALS AND METHODS
Patients
Data were derived from a clinical trial (EUDRACT 2015-004760-11 (14)). In this trial, 13 patients with advanced non–small cell lung cancer eligible for nivolumab (programmed cell death protein 1 [PD-1] inhibitor) treatment were included. All patients were immune checkpoint inhibitor–naïve. Inclusion and exclusion criteria were previously published (13). Only patients with a dynamic scan and lesions in the field of view were included in this analysis. This study was approved by the local Institutional Review Board (Medical Ethics Committee of the Amsterdam University Medical Centre, VU University Medical Centre, Amsterdam) and conducted in accordance with the Declaration of Helsinki. Written informed consent was obtained before study enrollment of all human participants.
Biopsies
Ten biopsy samples were obtained before the start of the scans. In 3 patients, archival material was used (range, 12–20 mo before the start of nivolumab). PD-L1 immunohistochemistry was performed using the DAK 28.8 antibody (15), and PD-L1 expression was assessed as the percentage of tumor cells showing positive cell membrane staining for PD-L1 (tumor proportion score). Total PD-L1 expression, both immune cells and tumor cells, was assessed as well.
Synthesis of 18F-BMS-986192
18F-BMS-986192 was synthesized as per a prior publication (12,13) at the good-manufacturing-practice lab of the Department of Radiology and Nuclear Medicine of the Amsterdam University Medical Centre. 18F-BMS-986192 synthesis resulted in more than 95% radiochemical purity and 3%–7% radiochemical yield, with a molar activity of more than 6.1 GBq/μmol.
Scan Protocol
The PET/CT study was performed on a Gemini TF-64 or an Ingenuity TF-128 PET/CT scanner (Philips Healthcare). The scan protocol started with a low-dose CT scan (120 kV, 30 mAs). The CT scan was followed by injection of a mean dose of 162 ± 37 MBq of 18F-BMS-986192 and a subsequent 60-min single-bed-position PET scan. The field of view was positioned over the chest and included the ascending aorta. Afterward, a whole-body PET/CT scan (3 min per bed position; 10–12 bed positions, depending on the height of the patient) from the vertex to mid thigh was acquired. The 60-min single-bed-position dynamic scan was reconstructed into 19 time frames (1 × 15, 3 × 5, 3 × 10, 4 × 60, 2 × 150, 2 × 300, and 4 × 600 s) with time-of-flight ordered-subsets expectation maximization into a 144 × 144 matrix with 4 × 4 × 4 mm voxels.
Volumes of Interest (VOIs)
Images were read by a nuclear medicine physician, and areas of tumor uptake (defined as focal uptake exceeding local background) were identified. VOIs were delineated either semiautomatically or manually with the ACCURATE tool (16) on the dynamic PET scans. Tumor VOIs were delineated on the sum of the last 4 frames (representing the time-averaged tumor uptake at 20–60 min after injection). A blood-pool VOI was defined on the sum of frames 6–10 (representing the uptake at 50–290 s after injection), in 4 transversal planes located at the aortic arch and part of the ascending aorta. Per plane, the complete aorta was delineated. The tumor and blood-pool VOI were used to derive tumor and blood time–activity curves (based on the mean activity concentration in the VOI) from the dynamic PET data. In addition, the tumor VOIs were imported to the static PET scan.
Blood Sampling
In addition to the dynamic scanning, continuous arterial sampling was performed at 5 mL⋅min−1 during the first 5 min and 2.5 mL⋅min−1 until the end of the first (single-bed-position) PET scan, using a dedicated online blood sampler (17). Continuous sampling was interrupted at 5, 10, 20, 30, 40, and 60 min after injection in order to draw 7 mL of arterial blood. For all arterial blood samples, whole-blood and plasma activity concentrations were measured with a well counter (Wallac1480 Wizard; Perkin Elmer).
In 6 patients, manual venous samples were drawn simultaneously with the arterial samples and processed similarly to the arterial samples. The venous-over-arterial whole-blood concentrations were obtained as a function of time. In addition, the venous whole-blood–over–plasma ratios were compared with the arterial whole-blood–over–plasma ratios.
Blood Sampler–Derived Input Function (BSIF)
The continuously sampled arterial whole-blood activity concentration was recalibrated to the manual arterial samples and corrected for the arterial plasma–to–whole-blood activity concentration ratio as well as for delay in order to obtain the BSIF.
Image-Derived Input Function (IDIF)
Blood-pool VOI–derived whole-blood time–activity curves were multiplied by the arterial plasma–to–whole-blood activity concentration ratios as well as delay in order to obtain the IDIF.
Pharmacokinetic Analysis of 18F-BMS-986192
Pharmacokinetic modeling was performed using in-house–developed software in MATLAB (MathWorks). 18F-BMS-986192 tumor time–activity curves were analyzed using both irreversible and reversible 1- and 2-tissue-compartment models in combination with the BSIF. All models included a delay term between BSIF and time–activity curve as well as an additional blood volume fraction fit parameter.
The quality of the fit was assessed visually, and the optimal compartment model was chosen on the basis of the Akaike information criterion (18). On the basis of the optimal model, the preferred parameter to quantify tracer uptake was determined. Subsequently, the optimal compartment model was applied to the tumor time–activity curve in combination with the IDIF. The preferred parameter estimate obtained with the IDIF was compared with the estimate obtained with the BSIF. All values reported from compartmental modeling were obtained with the optimal compartmental model.
The use of simplified uptake measures was explored by comparing these measures with the preferred fully quantitative parameter. Simplified uptake measures included SUV normalized to plasma concentration, SUV normalized to injected activity over body weight (SUVBW) or lean body mass at 50 min after injection, and SUVBW and SUV normalized to lean body mass at 80 min after injection.
Statistical Analysis
Each simplified variable was tested for correlation with the parameter derived from full kinetic modeling by linear regression analysis (R2) using GraphPad Prism, version 6.02.
RESULTS
Patients, Lesions, and Biopsies
Nine patients, with a total of 22 lesions, were enrolled in this study. Six of the biopsied lesions were in the field of view of the dynamic scan. Three lesions with a volume smaller than 1 cm3 were excluded from the analysis. Another lesion was too close to a blood vessel, resulting in a lesion time–activity curve that was dominated by spillover from the vessel. In total, 18 lesions from 9 patients were available for kinetic modeling (Table 1). For 6 lesions, the PD-L1 immunohistochemistry score in the biopsy was known: 3 biopsies were negative for PD-L1, and 3 biopsies were positive for PD-L1 immunohistochemistry (tumor proportion scores, 10%, 90%, and 95%, respectively).
Tumors in Field of View
Tumor Time–Activity Curve and Blood Sampling
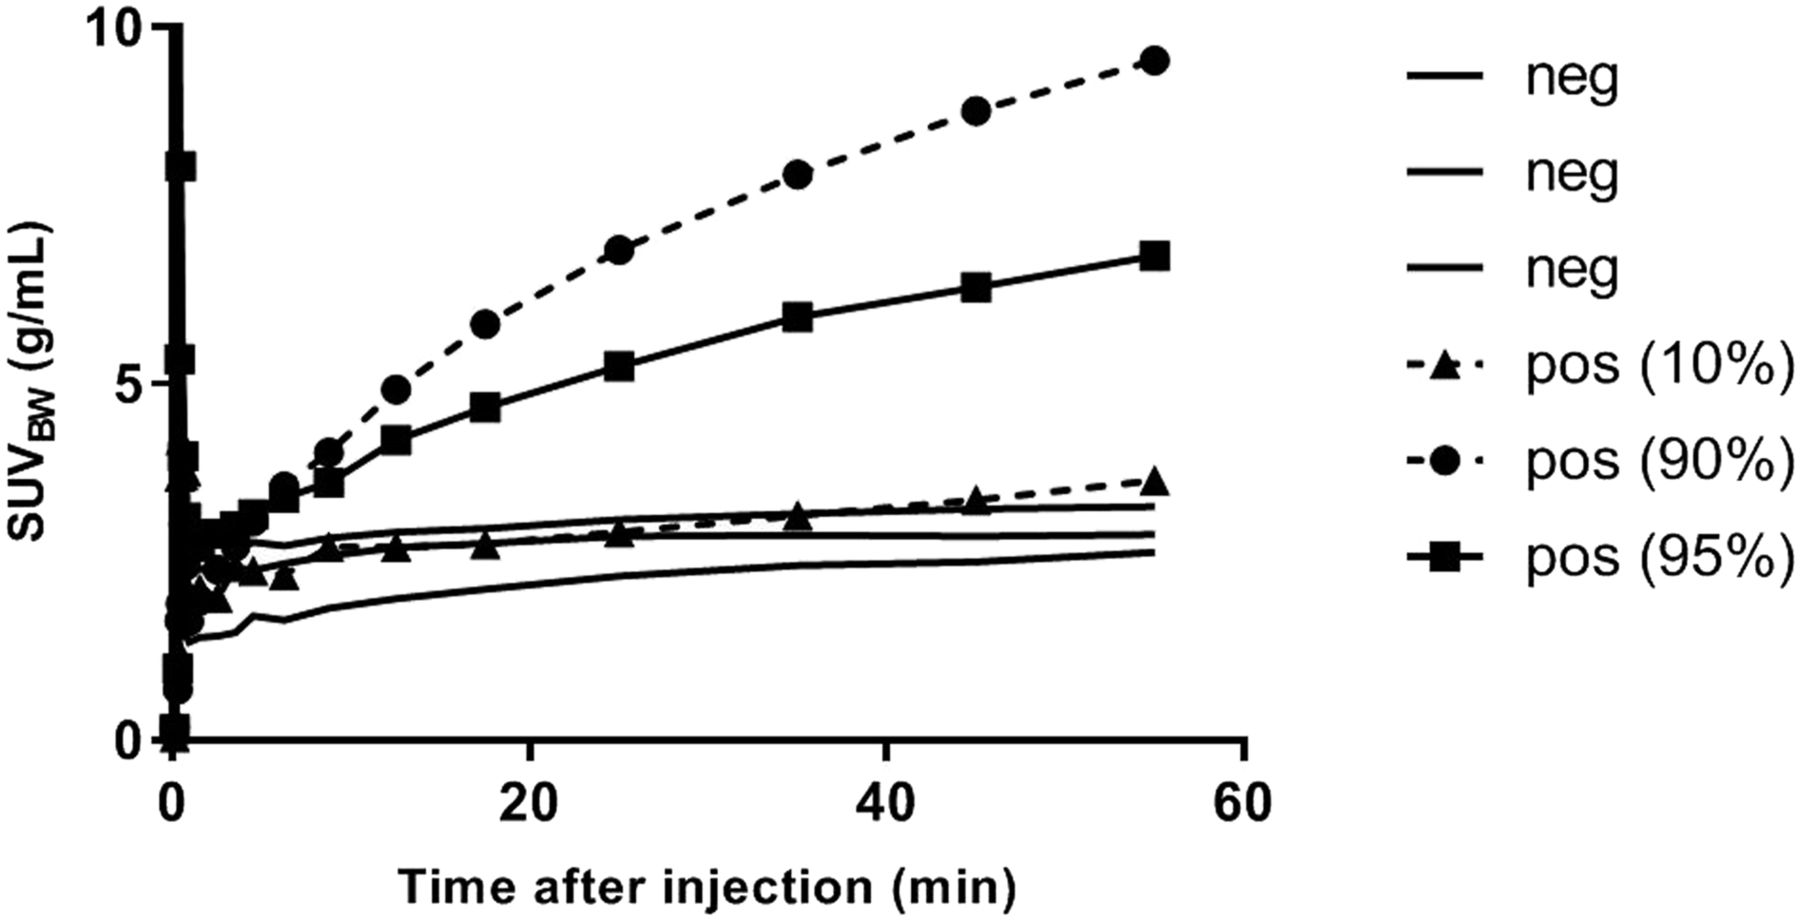
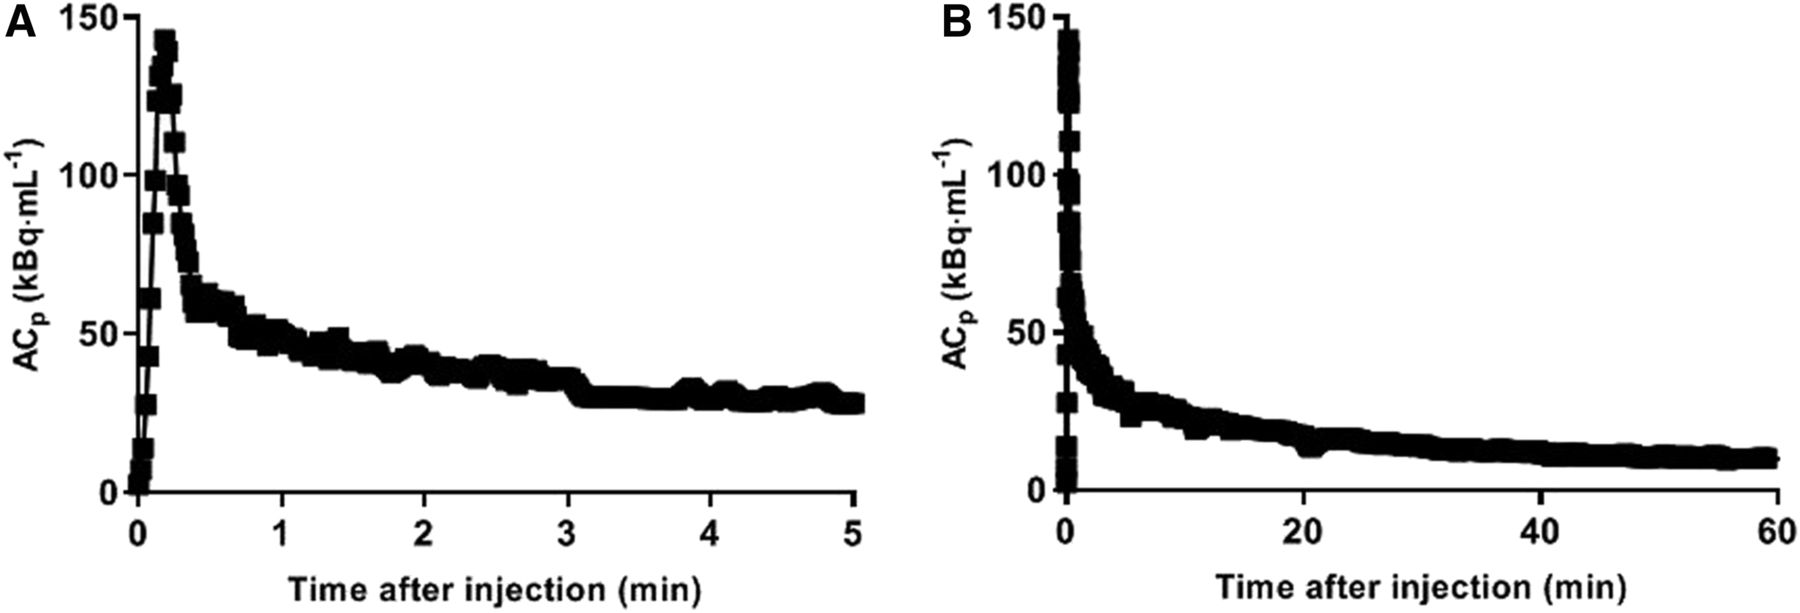
Figure 1 shows the time–activity curve for the 6 lesions with a biopsy-derived PD-L1 score. In general, time–activity curves for PD-L1–positive lesions were increasing over time, whereas the time–activity curves for PD-L1–negative tumors remained more or less flat after 40 min after injection. Figure 2 compares arterial and venous blood sample–derived activity concentrations, and Figure 3 shows an example of the blood sampler–derived arterial input function. The venous plasma–to–whole-blood ratios correlated well with the arterial ratios (R2 = 0.99), with a slope of 1.01. The whole-body PET/CT scan started at 67 ± 1 min after injection (average ± SD).

Time–activity curves for PD-L1–positive (pos) and PD-L1–negative (neg) tumors.

Comparison of arterial and venous blood–derived activity concentrations. (A) Observed venous–over–arterial whole-blood (WB) concentration ratios as function of time after injection. (B) Venous whole-blood–over–plasma ratios as function of arterial whole-blood–over–plasma ratios.

Example blood sampler–derived input: first 5 min (A) and full BSIF (B). ACp = activity concentration in plasma (in Bq/mL).
Kinetic Modeling
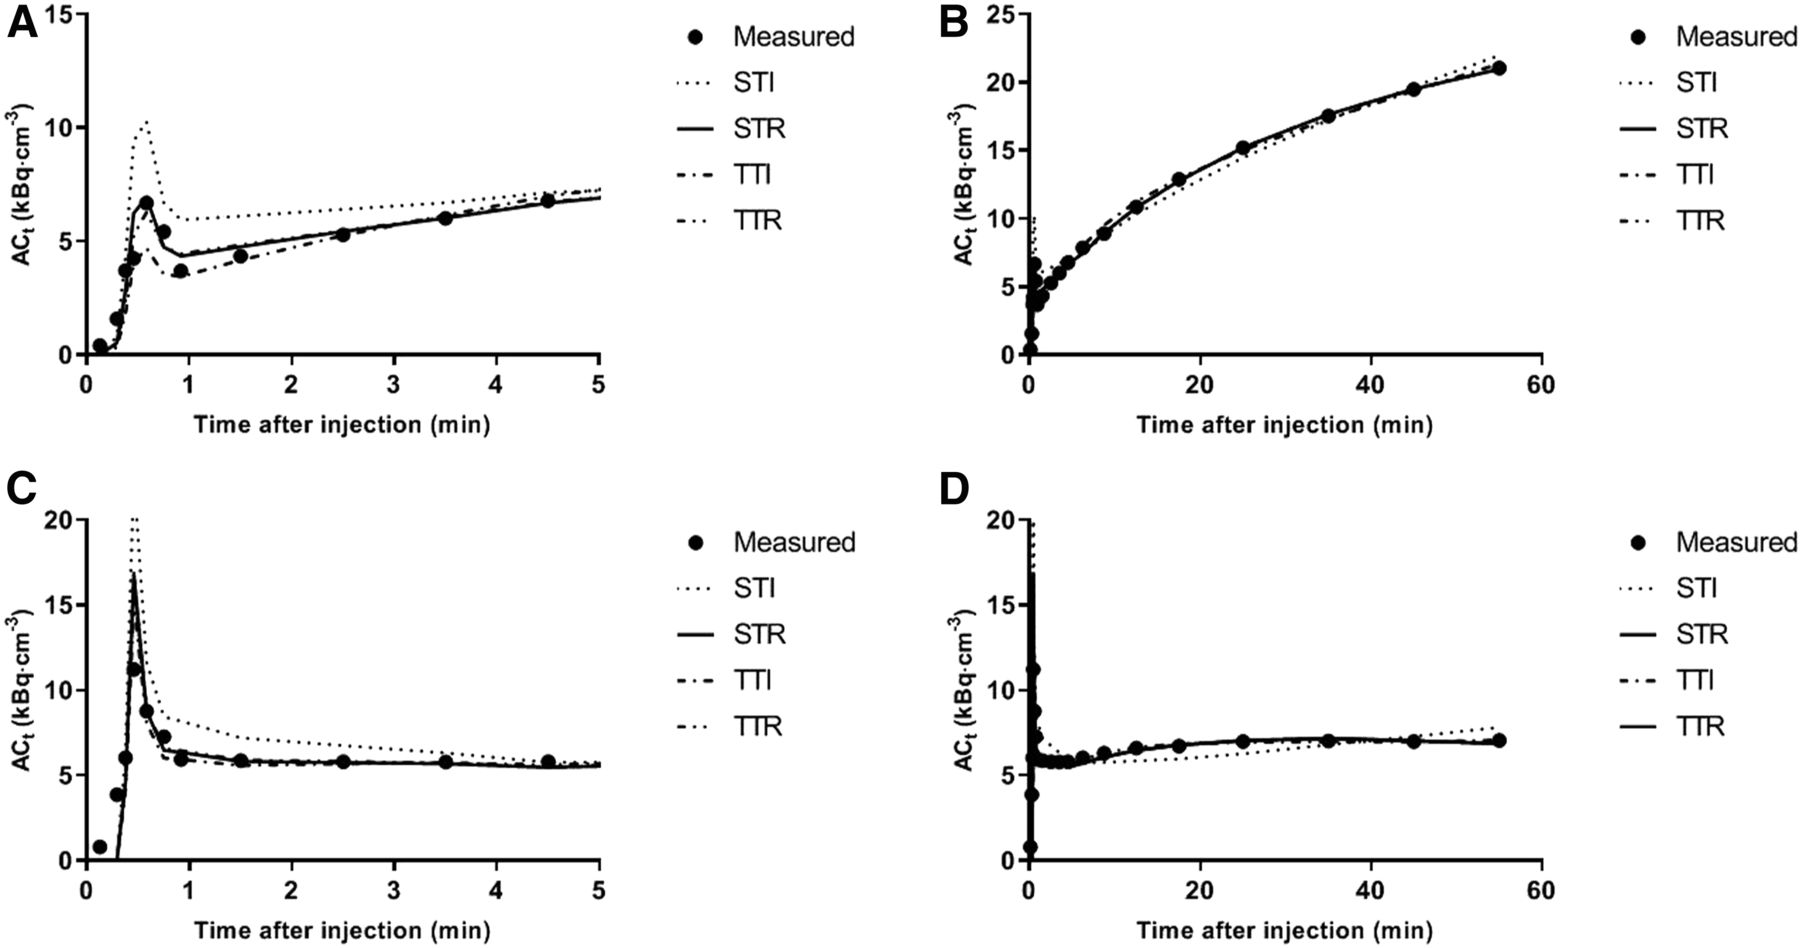
Four conventional pharmacokinetic models were used: the single-tissue irreversible model, the single-tissue reversible model, the 2-tissue irreversible model, and the 2-tissue reversible model. All models included a blood volume fraction as fit parameter. The goodness of fits was visually assessed. The Akaike information criterion was used to determine the preferred model for tumor tracer uptake. On the basis of this criterion, time–activity curves were best described by a reversible single-tissue model in 11 lesions (61%), followed by the irreversible 2-tissue model in 7 lesions (39%; Table 1). Although in these 7 lesions the irreversible model was preferred, it was seen that the single-tissue reversible model still resulted in good fits (Fig. 4B) and that the obtained VT (mL⋅cm−3) estimates correlated well with other (simplified) uptake metrics. The preferred parameter to quantify tracer uptake was therefore the distribution volume (VT), which ranged from 0.4 to 4.8 mL⋅cm−3, as shown in Table 1. In this table, the fitted blood volume fraction is also indicated. In all cases, it was below 35% and did not affect the quality of the fits or the ability to obtain reliable estimates for the other fit parameters.

Example fitted time–activity curve for PD-L1–positive tumors (A for first 5 and B for full duration of time–activity curve) and PD-L1–negative tumors (C for first 5 and D for full duration of time–activity curve) with single-tissue (reversible [STR] and irreversible [STI]) and 2-tissue (reversible [TTR] and irreversible [TTI]) compartmental model fits to data. ACt = activity concentration in tissue (in Bq/mL).
A typical example of a fitted time–activity curve of a PD-L1–positive and a PD-L1–negative tumor is shown in Figure 4. For these 6 fits, 1 PD-L1–negative and 10% of the PD-L1–positive lesion showed, on the basis of the Akaike information criterion, a preference for the 2-tissue irreversible model. The other 4 showed a preference for the single-tissue reversible model. The volume of distribution for the PD-L1–negative lesions was lower than 1, whereas VT for the PD-L1–positive lesions was larger than 1 and increasing with the immunohistochemistry score (Table 1). Replacing the BSIF with the IDIF provided similar VT results (Fig. 5; the correlation line has a slope of 0.99 and an R2 of 0.98).
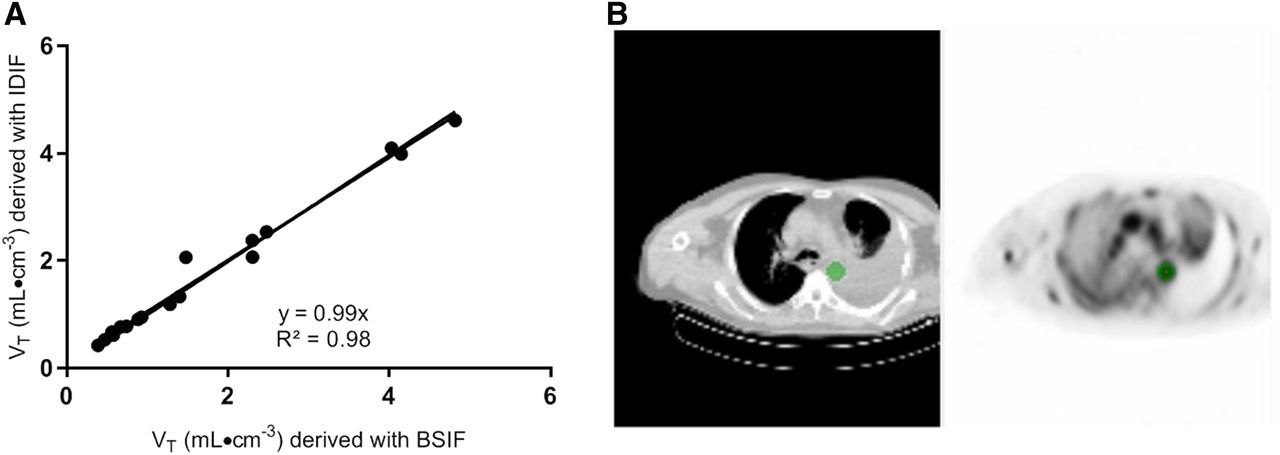
Correlation of VT values derived with blood sampler–derived (BSIF) or image-derived (IDIF) input function (A). In B, example blood-pool VOI is shown as delineated on sum of frames 6–10 (representing uptake at 50–290 s after injection).
Simplified Analysis
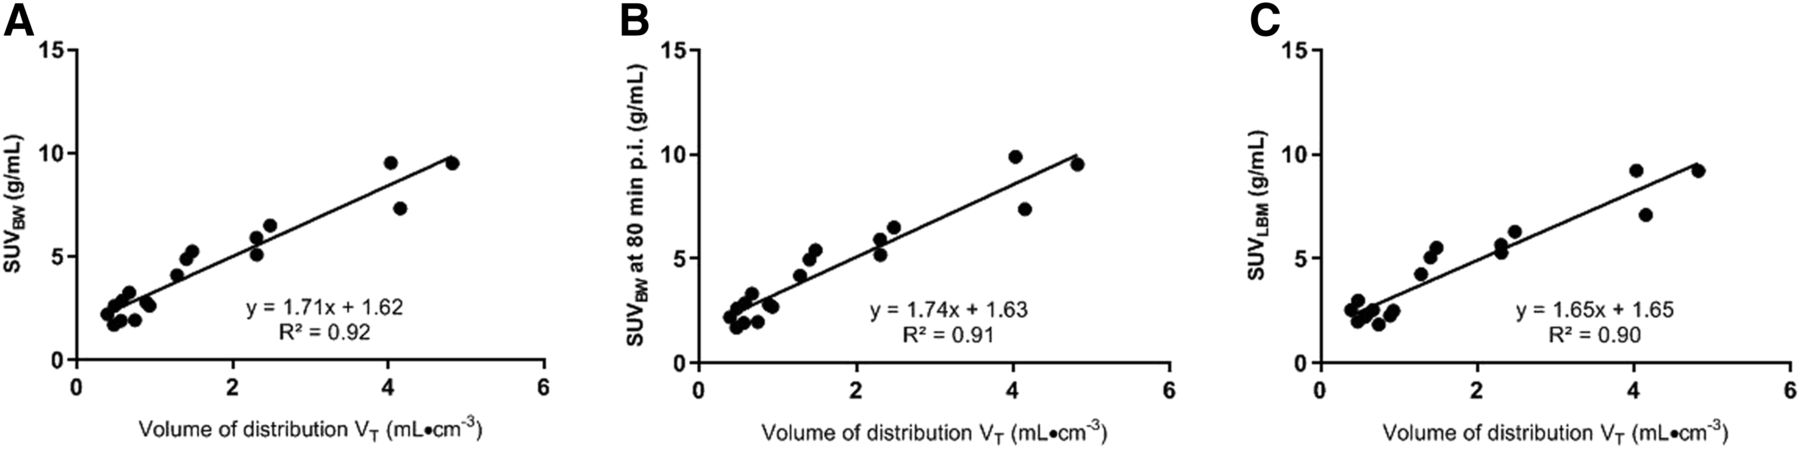
VT derived from the reversible single-tissue model in combination with the BSIF was used to validate simplified methods. SUVBW 50 min after injection correlated best with VT (R2 = 0.92, Fig. 6A), followed by SUVBW at 80 min after injection (R2 = 0.91, Fig. 6B), SUV normalized for lean body mass 50 min after injection (R2 = 0.90, Fig. 6C), and SUV normalized to plasma concentration (R2 = 0.84).

Correlation of SUVBW (A), SUVBW at 80 min after injection (B), and SUVLBM (C) with VT from the single-tissue reversible model. p.i. = after injection.
DISCUSSION
In this study, we performed a full pharmacokinetic analysis of 18F-BMS-986192 with a dynamic scanning protocol and arterial blood activity input. A metabolite analysis of the tracer was not performed because it has been shown that in mice no metabolites were found within 2 h after injection (12). Although tracer uptake seemed to be still increasing with time at the end of the dynamic scan interval, at 60 min after injection a reversible single-tissue model best described the uptake of 18F-BMS-986192 in 61% of the tumors. An irreversible 2-tissue model was preferred in 39% of the fits, notably in 1 lesion with a 10% positive immunohistochemistry score and in 1 lesion with a negative immunohistochemistry score. Consequently, VT was found to be the preferred parameter for tumoral PD-L1 uptake. This parameter was higher for PD-L1 (biopsy)–positive tumors than for negatively scored lesions, based on the 6 lesions for which immunohistochemistry data were available. However, the small number of tumor tissues in which PD-L1 was determined precludes firm conclusions on the relation between tracer uptake and immunohistologic expression of PD-L1.
Full kinetic modeling with a BSIF is the preferred method for tracer uptake quantification. Given the burden of arterial sampling, the use of an IDIF was explored and the resulting VT values correlated closely to those obtained with the BSIF. However, a significant variation of plasma-to-whole blood ratio was observed. Therefore, arterial sampling is not needed for quantification of this tracer when the ascending aorta is in the field of view, but at least 1 venous sample is needed to correct for the patient-specific plasma–to–whole-blood ratio. In a next step, the accuracy of simplified measurements based on a shortened scan protocol was explored. In this study, we found that SUVBW correlated best with VT. This finding validates the use of SUVBW to quantify uptake of 18F-BMS-986192 as, for example, was done in a previous publication (13).
The relationship between tracer bioavailability and tracer uptake in tumor tissue may be influenced by concurrent medication or other interventions. Therefore, in the setting of monitoring of response to anti-PD-1 or PD-L1 therapy, it will be important to confirm the appropriateness of the single-tissue reversible model to describe adnectin uptake, as well as to validate SUV against VT.
Given the rise in uptake in PD-L1–positive lesions, the results of this paper cannot be readily applied to simplified measures (SUV) at time intervals other than 50–80 min after injection. Moreover, the results suggest the importance of adhering to strict standardized uptake time intervals in case static whole-body imaging is performed.
CONCLUSION
The results of this study allow for clinical implementation and quantification of 18F-BMS-986192 PD-L1 uptake in baseline PET studies. A single-tissue reversible compartment model describes the kinetics of 18F-BMS-986192 uptake in lesions. SUVBW at 60 min after injection seems to be a good surrogate to quantify tumor tracer uptake for baseline PET studies. Dynamic scanning combined with an image-derived input function and at least one blood sample would allow assessment of the value of this surrogate marker in the setting of response evaluation during PD-L1 immune checkpoint inhibition.
DISCLOSURE
David Leung and Wendy Hayes are employees and stockholders of BMS. No other potential conflict of interest relevant to this article was reported.
KEY POINTS
QUESTION: How can PD-L1 expression be quantified on the basis of 18F-BMS-986192 PET/CT?
PERTINENT FINDINGS: This methodologic paper applied kinetic modeling to tissue and plasma time–activity curves of baseline non–small cell lung cancer patients. A single-compartment reversible model or SUVBW at 60 min after injection as a simplified measure should be used.
IMPLICATIONS FOR PATIENT CARE: Dynamic scanning combined with an IDIF and at least 1 blood sample allow investigation of the role of 18F-BMS-986192 PET/CT in response evaluation during PD-1 or PD-L1 immune checkpoint inhibition therapy.
Footnotes
↵* Contributed equally to this work.
Published online Feb. 14, 2020.
- © 2020 by the Society of Nuclear Medicine and Molecular Imaging.
REFERENCES
- Received for publication December 12, 2019.
- Accepted for publication January 29, 2020.


Jump to section
Related Articles
Cited By...
- No citing articles found.