


Abstract
This investigation evaluated the changes of pulmonary perfusion at 4 different points of follow-up within 1 y in patients with pulmonary embolism (PE) and the factors predictive of complete or incomplete recovery of pulmonary perfusion. Methods: Patients with symptomatic PE underwent perfusion lung scintigraphy and blood gas analysis within 48 h from clinical presentation, after 1 wk, and after 1, 6, and 12 mo; echocardiography was performed at baseline and after 6 and 12 mo. All perfusion lung scintigraphy scans were examined by 2 expert nuclear medicine physicians with a scoring method that attributed a score of 0, 0.5, or 1 for extension (maximum score, 18) to the presence of perfusion defects (PD), both at baseline and on each follow-up scan. Results: Among 183 patients who completed 1 y of follow-up, the median baseline PD score was 8.2; it decreased significantly at each follow-up time point until 6 mo (P < 0.001). Median baseline alveolar–arterial difference in oxygen partial pressure (PA-aO2) was 50.9 and decreased significantly up to 1 mo (P < 0.001); median pulmonary artery systolic pressure (PAsP) was 45.9 mm Hg and decreased significantly until 12 mo (P < 0.001). A correlation was found between PD and both PA-aO2 (P < 0.05) and PAsP (P < 0.05). We found a correlation between PD ≠ 0 and PAsP ≥ 40 mm Hg at 12 mo (P < 0.05); in 6 (3.3%) of these patients such a correlation was still present after 24 mo, suggesting they could develop chronic thromboembolic pulmonary hypertension. Low baseline PD (odds ratio, 0.80; P < 0.0001) and high 1-wk percent recovery (odds ratio, 1.04; P < 0.0001) were predictive factors of complete 6-mo recovery. Conclusion: Perfusion scintigraphy may be useful to follow patients with PE. The follow-up should consist of 3 steps: the baseline examination, which reflects the severity of PE; the scan at 1 wk, which indicates the early amount of reperfusion; and the scan at 6 mo, which demonstrates the maximum attainable recovery. Patients with incomplete recovery and persistence of pulmonary hypertension on the 24-mo control should be further studied for possible development of chronic thromboembolic pulmonary hypertension.
The risk of adverse events in patients with acute pulmonary embolism (PE) continues beyond the acute phase, since PE may recur both in the early days after the acute event and after months or years (1–3) and may, in a few cases, result in pulmonary hypertension (4,5). Patients at high risk for unfavorable outcomes, who may benefit from prolonged anticoagulation, should therefore be identified early. However, currently there is no practical way to know whether a patient is at high risk of early and late complications. Recently, Pesavento et al. demonstrated that the persistence of a residual pulmonary arterial obstruction on perfusion lung scintigraphy (PLS) 6 mo after an index event represents a risk factor for recurrence and for the development of chronic postembolic pulmonary hypertension after a first episode of PE (6). This suggests a role for scintigraphic follow-up to identify patients at higher risk for adverse events after PE. However, this result needs out-of-sample confirmation. Even if confirmed, it would still not be clear when the scintigraphic follow-up would be most effective. Is a single 6-mo follow-up of the incident event the most appropriate metric? How does pulmonary perfusion change before and after 6 mo? Could the adverse outcomes be predicted sooner? Are there correlations between perfusion improvement and functional parameters, such as gas exchange and pulmonary artery pressure, that could help in identifying patients at risk for chronic thromboembolism? Are there factors that facilitate or hamper restoration of pulmonary perfusion?
The main purpose of the present study was to investigate, in patients with a symptomatic episode of acute PE, the changes in pulmonary perfusion at 4 different times of follow-up within 1 y. Secondary purposes were to investigate, first, the presence of factors predictive of complete or incomplete recovery of pulmonary perfusion at different follow-up times and, second, the correlations between changes in pulmonary perfusion and both pulmonary gas-exchange and pulmonary artery pressure that might be useful to identify patients at risk for late complications.
MATERIALS AND METHODS
This study was conducted in the Respiratory Unit of the University Hospital of Pisa, Italy; all patients had been diagnosed with a symptomatic episode of PE by CT angiography (CTA) or by PLS combined with a high clinical probability of PE, according to previously published criteria (7,8).
According to Respiratory Unit policy, all patients were routinely scheduled for follow-up PLS controls at 1 wk, 1 mo, 6 mo, and 1 y after the incident event (9,10). If PE was diagnosed initially by CTA, a baseline PLS was also obtained according to Respiratory Unit policy within 24–48 h of the CTA. The PLS scans were reviewed using a single-center, longitudinal, observational design. The institutional review board approved this study, and the requirement to obtain informed consent was waived.
The following baseline data were collected: age, sex, and presence of cardiovascular disease, chronic obstructive pulmonary disease, active cancer, previous venous thromboembolism, or current symptomatic deep vein thrombosis. Patients were classified as having transiently provoked PE if they reported any of the following risk factors: recent surgery, immobilization, fracture, or estrogen therapy. All patients without these risk factors were regarded as having unprovoked PE. Blood gas analysis was performed in association with the scans while the patients were breathing room air, except for a limited number of patients (n = 11, 5.9%) who had supplemental oxygen administered. From blood gas analysis, the alveolar–arterial difference in oxygen partial pressure PA-aO2 = [(760 − 47) × FiO2 (fraction of inspired oxygen)] − (PaCO2/0.8) − PaO2 (partial pressure arterial oxygen) was calculated. Values of pulmonary artery systolic pressure (PAsP) were calculated by transthoracic echocardiography at baseline and 6 and 12 mo later; if PAsP was higher than 40 mm Hg at 1 y, a control echocardiogram was performed 2 y after the acute episode.
Lung Perfusion Analysis
All scans were examined by 2 nuclear medicine specialists who had many years of clinical experience in reading PLS and had participated on the reading committees of several studies of the image database of the Prospective Investigation of Pulmonary Embolism Diagnosis (PIOPED) and the Prospective Investigative Study of Acute Pulmonary Embolism Diagnosis (PISA-PED). Each PLS examination consisted of 6 views (anterior, posterior, right and left lateral, and right and left posterior oblique). The PISA-PED method adopted here was the same successfully used to reread the PIOPED cases, and it is approved by the Society of Nuclear Medicine and Molecular Imaging guidelines (11,12).
To quantify the perfusion impairment at diagnosis and to evaluate changes during follow-up, we used a scoring system originally developed in our institution. The system was based on lung segmental divisions (right lung, 10 segments; left lung, 8 segments). The readers evaluated by consensus the perfusion characteristics of each of the 18 segments reported in the scheme (Fig. 1). In detail, a score of 0 was attributed to a normally perfused segment, 0.5 to a segment with up to a 50% reduction of perfusion, and 1 to a segment with underperfusion ranging from 50% to 100%. A total score that could range from 0 to 18 for the 2 lungs was then calculated. The score was assigned at baseline and at each follow-up scan. On the basis of previous clinical observations (13,14), a second parameter was investigated: the presence of areas of hyperperfusion in the upper and middle lung lobes. This is a newly introduced parameter that indicates the appearance of areas of increased perfusion in lung zones normally less perfused: those in the upper and anterior regions. Such a phenomenon is due to redistribution of perfusion to lung regions free of embolization. The presence of hyperperfusion was investigated at baseline and on the follow-up scans.

Reading scheme reporting anatomic distribution of lung segments. Right lung (1–10): upper lobe (apical [1]; posterior [2]; anterior [3]); middle lobe (lateral [4]; medial [5]); lower lobe (superior [6]; medial-basal [7; 7 is not shown in the figure because the anterior medial segment could only be visualized on the oblique anterior projection, which is not used in this article]; posterior-basal [8]; lateral-basal [9]; anterior-basal [10]). Left lung (11–18): upper lobe (apical-posterior [11]; anterior [12]); lingula (superior [13]; inferior [14]); lower lobe (superior [15]; medial-basal [16]; lateral-basal [17]; posterior-basal [18]). ANT = anterior; POST = posterior; R LAT = right lateral; L LAT = left lateral; RPO = right posterior oblique; LPO = left posterior oblique.
Statistical Analysis
Continuous variables were expressed as mean ± SD. Categoric variables were expressed as numbers and percentages. Changes in perfusion defects (PDs), blood gases, and PAsP over time were graphed as box plots. Correlations were evaluated by the t test of the Pearson correlation. Differences between groups, classified by complete versus incomplete recovery, were evaluated by the Student t test for continuous variables and the χ2 test for categoric variables. The significance level was set at 5% (P < 0.05). Factors conditioning perfusion improvement were investigated by a logistic model using the backward-stepwise approach to select variables.
RESULTS
The total number of consecutive patients diagnosed with PE during 3 y was 321. Of those, 80 (24.9%) were excluded because their baseline scintigraphy was performed more than 48 h after the PE diagnosis; 58 (18.1%) were lost to follow-up, either for logistic reasons or because they did not return after the baseline scintigraphy. The final study population, therefore, consisted of 183 (57%) patients who had completed the full 1-y follow-up. The baseline characteristics of patients are reported in Table 1.
Baseline Characteristics of Patients
Recovery of Pulmonary Perfusion
Changes in PD score at different points of follow-up are reported in Figure 2. The median baseline PD score was 8.2; it significantly decreased on each follow-up step until 6 mo, when it became stable. Perfusion recovery was complete in 12% of patients at 1 wk, in 46% at 1 mo, and in 59% at both 6 and 12 mo.
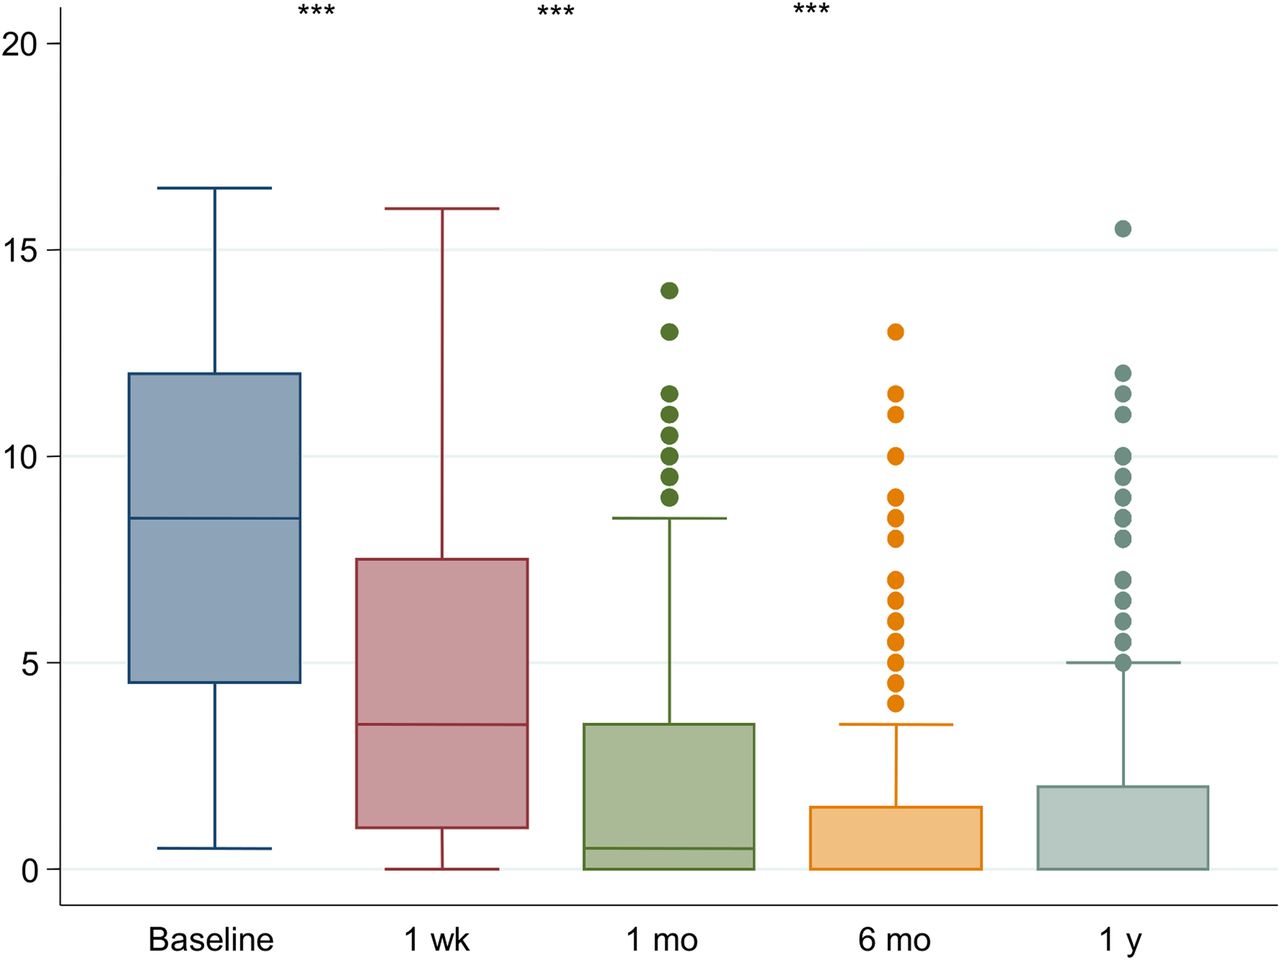
Values of PD score at different follow-up times. ***P < 0.001.
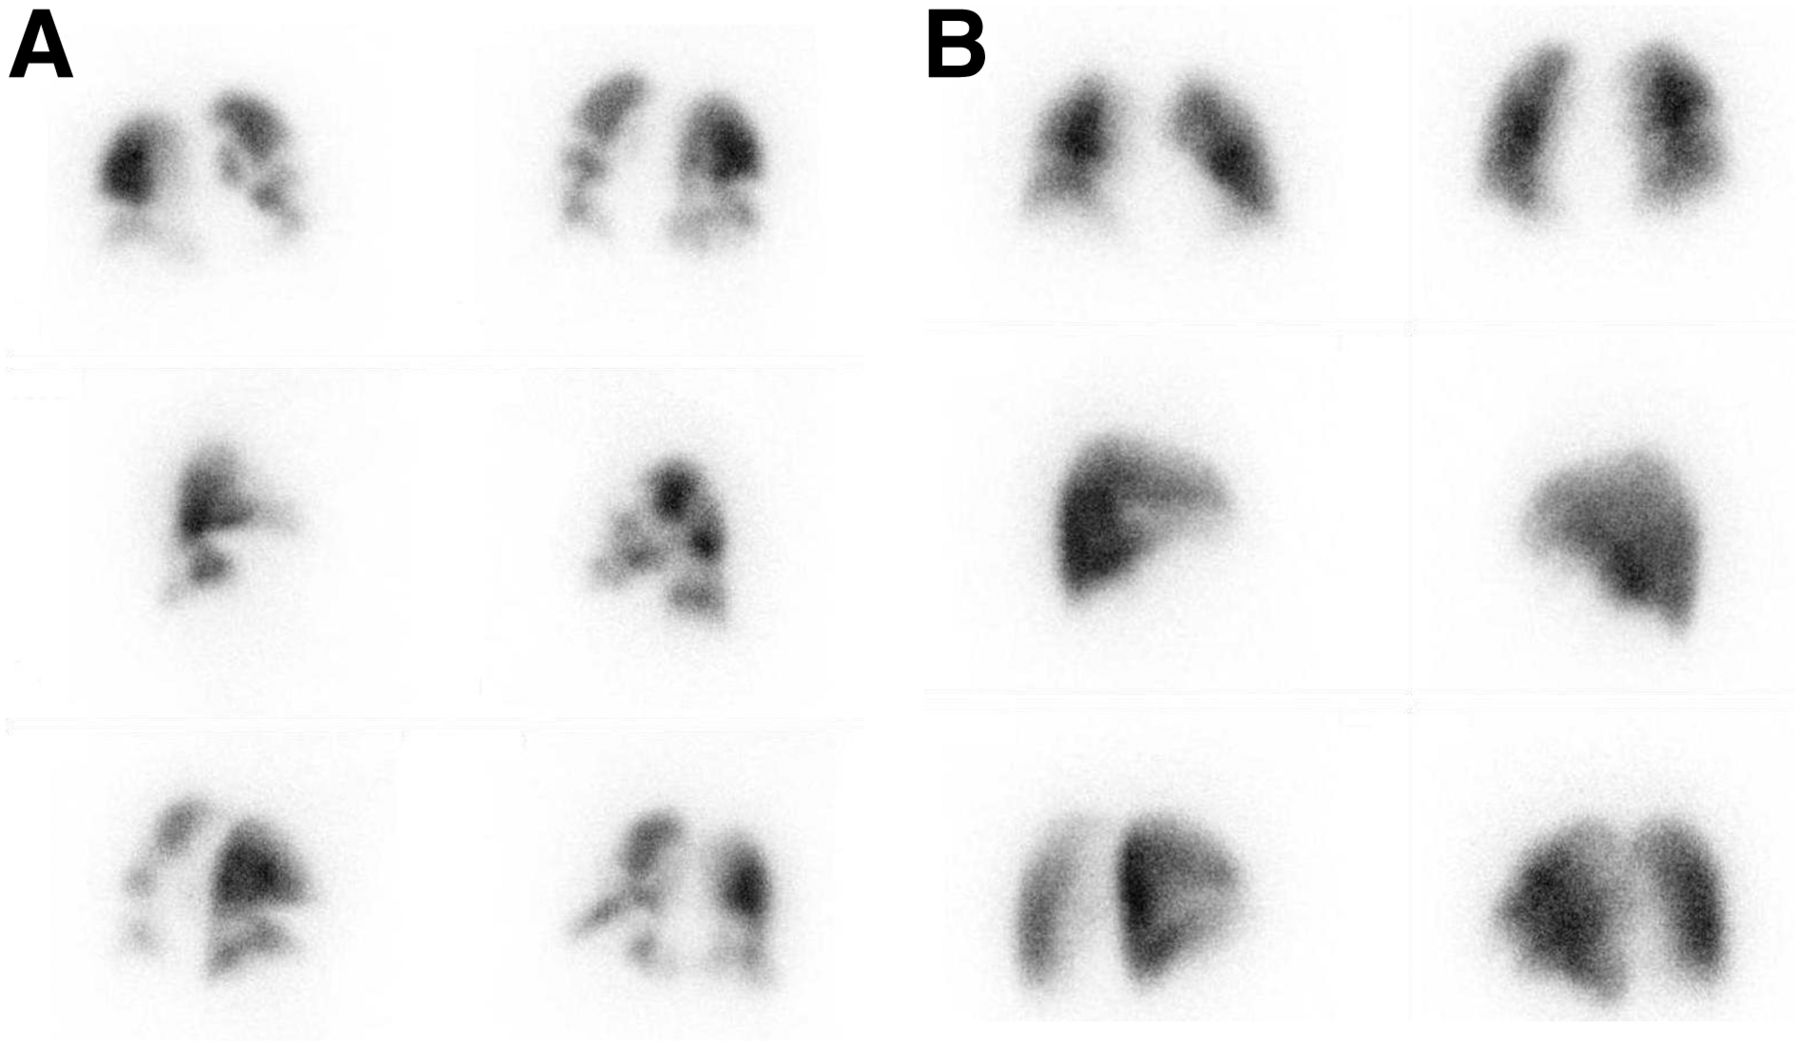
Hyperperfusion was present in 114 (62.3%) patients at baseline and in 86 (46.9%), 40 (21.9%), 21 (11.5%), and 18 (9.8%) patients at 1 wk, 1 mo, 6 mo, and 1 y, respectively. Figure 3 shows the changes in PD and hyperperfusion from acute embolization (Fig. 3A) to stable conditions (Fig. 3B) after 6 mo.

Changes in PD and hyperperfusion in 6 different views: anterior and posterior (top), right and left lateral (middle), and right and left posterior oblique (bottom). (A) Baseline PLS at acute PE shows several segmental PDs and shift of perfusion from posterior–inferior to anterior–superior lung regions (hyperperfusion) (PD score = 5.5, hyperperfusion in upper and middle lobes). (B) PLS 6 mo later shows marked improvement (PD score = 1.0, hyperperfusion in upper and middle lobes).
Median PA-aO2 at baseline was 50.9; it decreased significantly during the follow-up until 6 mo (Fig. 4A). Median PAsP at baseline was 45.9 mm Hg; PAsP values significantly decreased at every follow-up step until 1 y (Fig. 4B).
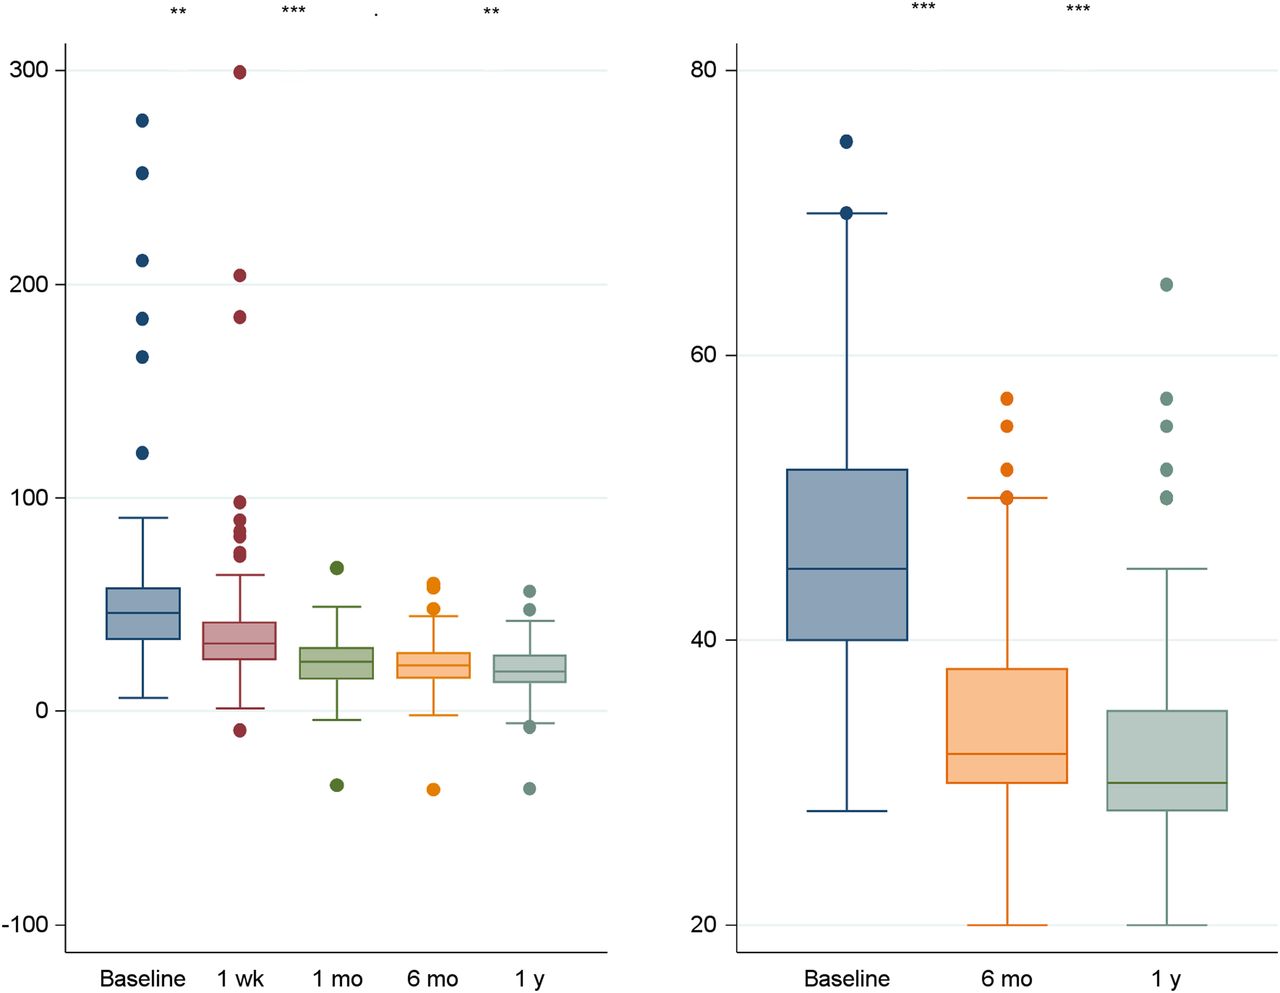
Values of PA-aO2 (A) and PAsP (B) at different follow-up times. **P < 0.01. ***P < 0.001.
The correlation of PD with PA-aO2 and PAsP at baseline and during follow-up is reported in Table 2. A negative correlation exists between PD and PA-aO2 during the entire follow-up (P < 0.05). A correlation between PD and PAsP was found only at 6 mo and 1 y (P < 0.05). In particular, a correlation was found (P < 0.05) in a subgroup of 10 (5%) patients who still had a pulmonary pressure over 40 mm Hg and a residual arterial pulmonary obstruction at 12 mo. In 6 (3.3%) of these patients, such a correlation was still present after 24 mo. The presence of hyperperfusion at the 6-mo control correlated (P < 0.05) with a PAsP of at least 40 mm Hg.
Correlation of PD Versus PA-aO2 and PAsP at Different Follow-up Times
Factors Affecting Perfusion Improvement
Variables measured at baseline and 1 wk later that were associated with complete recovery were investigated by both univariate and multivariate analysis. Among the former, younger age, low PD at baseline, high 1-wk percent recovery, and presence of transiently provoked PE were associated with complete recovery at the 1-mo follow-up, whereas only the first three were related to a complete recovery at 6 mo (Table 3). Low PD at baseline, high 1-wk percent recovery, and presence of transiently provoked PE were associated with complete recovery at 1 mo. Low PD at baseline and high 1-wk percent recovery were associated with complete recovery at 6 mo (Table 4). Age showed a borderline significance (Table 4).
Variables Associated with Recovery at 1 and 6 Months of Follow-up
Variables Associated with Complete Recovery at 1 and 6 Months of Follow-up
DISCUSSION
After an episode of acute PE, patients should be followed to evaluate the progress of improvement and the potential occurrence of adverse events, both during and after cessation of therapy. To this end, clinical (1,15,16), laboratory (17–19), radiologic (20–23), and echocardiographic (24,25) patterns have been used. Recently, the use of PLS has demonstrated (6) that incomplete restoration of pulmonary blood flow is predictive of recurrence and of arterial pulmonary hypertension. However, in that study, the pulmonary scintigraphy was performed only 6 mo after the acute event, with no information available about earlier (1 wk, 1 mo) and later (1 y) times after embolization.
The present study demonstrates that the restoration of pulmonary blood flow is progressive with time until 6 mo after the incident event and that no further improvement is to be expected after that time. Complete recovery of pulmonary blood flow occurred in only 13% of patients (17% of those who ultimately recovered) after 1 wk of therapy, in about 50% of patients (84% of those who ultimately recovered) after 1 mo, and in 60% of patients after 6 and 12 mo. Therefore, the control at 6 mo appears mandatory because at this time point patients can be expected to have achieved stable restoration of pulmonary blood flow. At earlier time points, not all patients who will achieve complete resolution of perfusion would be identified, whereas the 1-y time point involves a longer delay and provides no additional information. The choice by Pesavento et al. (6) of a 6-mo step of follow-up to investigate the presence of residual obstruction in order to predict late adverse-event results was prescient.
Nevertheless, other follow-up evaluations can be clinically useful. Of course, the severity of PE at baseline allows one to predict a complete perfusion recovery at 6 mo: the less severe the initial reduction of perfusion, the higher will be the probability that a patient will have normal perfusion after 6 mo. This is consistent with the data reported by Wartski and Collignon (26), who, in performing PLS at baseline, at 8 d, and after 3 mo, found that the greater the initial perfusion deficit, the lower the perfusion recovery that could be expected at follow-up. The extent of perfusion improvement 7 d after acute PE is an independent predictor of complete recovery after 6 mo. This means that the earlier that pulmonary perfusion improvement occurs, the higher is the probability that the patient will reach a complete 6-mo resolution. On the basis of the odds ratio, we compute that each 1-point score of PD recovery at the 1-wk scan predicts a 3% increase in improvement probability; each 1 point of baseline PD score reduction predicts an 11% decrease in improvement probability. At variance with previous studies, older patients’ age and underlying cardiac disease did not significantly influence the 6-mo perfusion recovery (26–28).
Perfusion impairment correlates with PA-aO2 during follow-up. Intriguingly, measuring gas exchanges and calculating PA-aO2 might be a good compromise in the event that pulmonary scintigraphy is not promptly available in the first days after diagnosis. Perfusion impairment also correlates with PAsP during the late phases of follow-up; PAsP is above the normal value in most patients at diagnosis and then tends to progressively decrease. Such a correlation is still present in a limited number of cases 1 y after the index event; in fact, 10 (5%) patients still had a pulmonary pressure over 40 mm Hg and a residual arterial pulmonary obstruction. Of these, 6 (3.3%) patients were still hypertensive 2 y after PE and were then considered to be affected by chronic thromboembolic pulmonary hypertension. Accordingly, we may speculate that patients who show incomplete recovery at 6 mo should undergo investigation for pulmonary hypertension and be followed up carefully to identify those who eventually will develop chronic thromboembolic pulmonary hypertension because a portion of them will develop this disease.
We also investigated a new parameter, the so-called hyperperfusion sign. This sign, previously described by our group (13), is due to the occurrence of abnormal areas of markedly increased perfusion in the upper and anterior lung regions because of a pulmonary blood flow shift from the lower and posterior lung regions presumably due to the predominant embolic obstruction in the lower lung regions. Hyperperfusion identifies regions with a low ventilation–perfusion ratio, in which perfusion is markedly increased and ventilation, though normal, is lower than perfusion. Under these conditions, perfusion is wasted in such areas (at a low ventilation–perfusion ratio), and this phenomenon may explain at least in part the arterial hypoxemia observed in acute PE (14). Hyperperfusion is possibly associated with acute pulmonary hypertension and tends to disappear after the first week of therapy. The detection of this finding after the acute phase of PE might be suggestive of PE recurrence. Furthermore, the presence of hyperperfusion 6 mo after acute PE correlates with persistently elevated PAsP; therefore, its presence in a follow-up scan suggests that surveillance should be set up for possible development of pulmonary hypertension in the following 18 mo.
One might argue that CTA may be more appropriate than PLS to follow patients with PE because it is more widely available and because almost all patients have the original diagnosis made by CTA. However, irradiation burden and poor correlation of such an examination with the evolution of pulmonary blood flow recovery make it less adapted to this purpose. PLS is less often used for diagnosis but has instead a great potential for following such patients, provided that PLS be systematically performed within 24–48 h after CTA diagnosis. In fact, Pesavento et al., after a disappointing experience with CT that showed the rate of residual obstruction to be much lower than expected and to not correlate with the endpoint (29), used PLS to successfully demonstrate the relation between residual vascular obstruction and the adverse clinical evolution (6).
The main limitations of this study are the relatively small sample size, the semiquantitative scoring system, and the single-center enrollment.
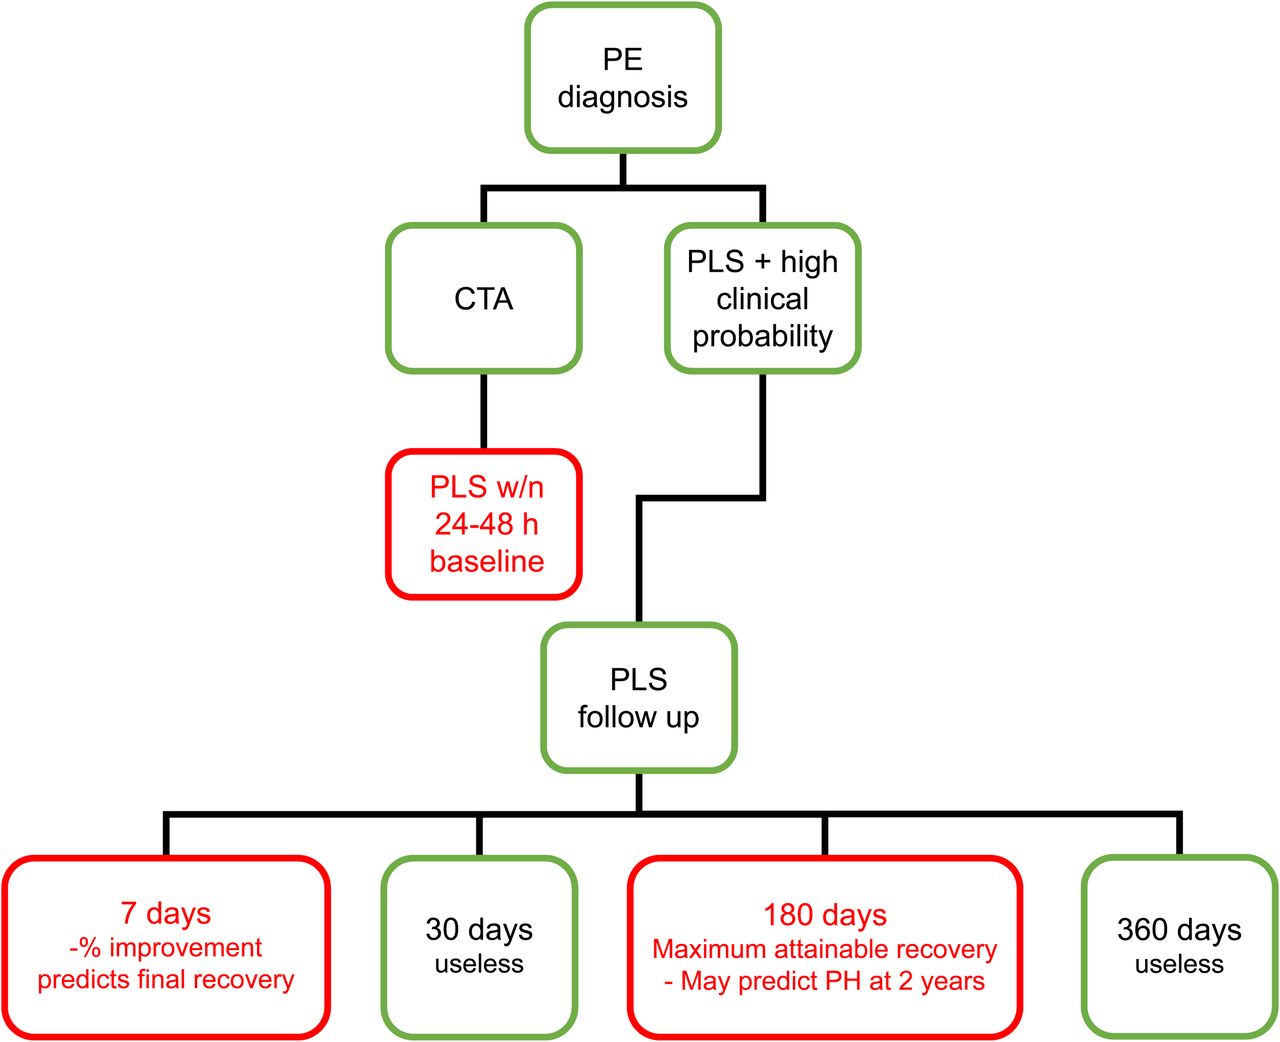
From a practical point of view, the ideal scintigraphic follow-up should consist of 3 essential steps (Fig. 5): the baseline study, since it indicates the severity of PE in the acute phase; the 1-wk follow-up, since it shows the early amount of reperfusion; and the 6-mo follow-up, since it shows the maximum attainable recovery of lung perfusion and can thus be considered the last control. As stated by Gottschalk in an editorial written on the Wartski and Collignon (26) article: “a chronic perfusion defect is a serious problem” and can complicate the management of patients with a previous diagnosis of PE and suspected recurrence in the absence of scintigraphic follow-up (30).

Suggested practical use of PLS in follow-up of acute PE. PH = pulmonary hypertension. Red boxes indicate suggested follow-up controls.
CONCLUSION
We believe this is the first systematic study that has investigated, with consecutive enrollment and a predefined time-control follow-up, pulmonary perfusion changes as evaluated on PLS in a large group of patients with a symptomatic episode of acute PE. PLS is a practical and useful way to follow such patients and might help with the decision to modify therapy in those at risk for incomplete restoration of pulmonary perfusion and for chronic thromboembolic pulmonary hypertension.
DISCLOSURE
No potential conflict of interest relevant to this article was reported.
Footnotes
Published online May 23, 2019.
- © 2019 by the Society of Nuclear Medicine and Molecular Imaging.
REFERENCES
- Received for publication October 30, 2018.
- Accepted for publication December 18, 2018.


Jump to section
Related Articles
Cited By...
- No citing articles found.