


Abstract
PET is increasingly used for prostate cancer (PCa) diagnostics. Important PCa radiotracers include 68Ga-prostate-specific membrane antigen HBED-CC (68Ga-PSMA), 18F-DCFPyL, 18F-fluoromethylcholine (18F-FCH), and 18F-dihydrotestosterone (18F-FDHT). Knowledge on the variability of tracer uptake in healthy tissues is important for accurate PET interpretation, because malignancy is suspected only if the uptake of a lesion contrasts with its background. Therefore, the aim of this study was to quantify uptake variability of PCa tracers in healthy tissues and identify stable reference regions for PET interpretation. Methods: A total of 232 PCa PET/CT scans from multiple hospitals was analyzed, including 87 68Ga-PSMA scans, 50 18F-DCFPyL scans, 68 18F-FCH scans, and 27 18F-FDHT scans. Tracer uptake was assessed in the blood pool, lung, liver, bone marrow, and muscle using several SUVs (SUVmax, SUVmean, SUVpeak). Variability in uptake between patients was analyzed using the coefficient of variation (COV%). For all tracers, SUV reference ranges (95th percentiles) were calculated, which could be applicable as image-based quality control for future PET acquisitions. Results: For 68Ga-PSMA, the lowest uptake variability was observed in the blood pool (COV, 19.9%), which was significantly more stable than all other tissues (COV, 29.8%–35.2%; P = 0.001–0.024). For 18F-DCFPyL, the lowest variability was observed in the blood pool and liver (COV, 14.4% and 21.7%, respectively; P = 0.001–0.003). The least variable 18F-FCH uptake was observed in the liver, blood pool, and bone marrow (COV, 16.8%–24.2%; P = 0.001–0.012). For 18F-FDHT, low uptake variability was observed in all tissues, except the lung (COV, 14.6%–23.6%; P = 0.001–0.040). The different SUV types had limited effect on variability (COVs within 3 percentage points). Conclusion: In this multicenter analysis, healthy tissues with limited uptake variability were identified, which may serve as reference regions for PCa PET interpretation. These reference regions include the blood pool for 68Ga-PSMA and 18F-DCFPyL and the liver for 18F-FCH and 18F-FDHT. Healthy tissue SUV reference ranges are presented and applicable as image-based quality control.
Prostate cancer (PCa) is the most common cancer in men in the Western world (1,2). PET imaging is increasingly used for PCa diagnostics, as it enables early lesion detection and molecular characterization of lesions in vivo. Several PET radiotracers for PCa imaging have been developed, among these 68Ga-prostate-specific membrane antigen HBED-CC (68Ga-PSMA), 18F-DCFPyL, 18F-fluoromethylcholine (18F-FCH), and 18F-dihydrotestosterone (18F-FDHT).
68Ga-PSMA, 18F-DCFPyL, and 18F-FCH are widely used diagnostic radiotracers, offering superior lesion detection compared with conventional imaging modalities (CT, MRI, bone scanning) (3,4). Both 68Ga-PSMA and 18F-DCFPyL are ligands targeting the PSMA, a type 2 membrane glycoprotein significantly overexpressed by malignant prostate cells (5). 18F-FCH enables visualization of PCa lesions as choline is a precursor of cell membrane phospholipids and its uptake is upregulated in PCa cells (6). 18F-FDHT is a radiolabeled analog of dihydrotestosterone, directly binding the androgen receptor. The androgen receptor is crucial for PCa growth, and androgen receptor–targeted therapies are mainstays in PCa treatment. 18F-FDHT might enable monitoring of androgen receptor–directed treatment and predict treatment response (7).
In clinical practice, PET images are assessed qualitatively as well as semiquantitatively. For qualitative evaluation, tracer uptake of suspected tumors is visually compared with the background (i.e., surrounding tissue or a reference region). Semiquantitative analysis is typically performed using the SUV, which provides a (simplified) measure of tracer accumulation in a region of interest. SUV is defined as the tissue’s radioactivity concentration, normalized to the injected dose per distribution volume (body weight, lean body mass, or body-surface area) (8). For both visual and SUV-based analysis, only the lesions with tracer uptake distinct from the background are characterized as potentially malignant. High variability of healthy tissue uptake between patients hampers reliable interpretation of suspected lesions, as the contrast between lesions and healthy tissues would be variable.
Therefore, the aim of this study was to define the interpatient variability of 68Ga-PSMA, 18F-DCFPyL, 18F-FCH, and 18F-FDHT uptake in healthy tissues and identify stable reference regions for PET interpretation. This knowledge is especially relevant, given the recent initiatives to standardize PET interpretation using uptake in healthy tissues as thresholds to characterize malignancy (e.g., PERCIST (9) and the Prostate Cancer Molecular Imaging Standardized Evaluation [PROMISE] for PSMA PET (10)).
Additionally, this study will provide reference ranges for healthy tissue SUV (population SUV ranges). These may be used as image-based quality control (QC) for future PET acquisitions, as an SUV outside this range points to image-acquisition imperfections.
MATERIALS AND METHODS
Design
This study is a centralized analysis of multicenter data, evaluating 68Ga-PSMA, 18F-DCFPyL, 18F-FCH, and 18F-FDHT PET/CT scans. Participating centers included the Amsterdam University Medical Centers (Academic Medical Center and VU University Medical Center, Amsterdam, The Netherlands), Memorial Sloan Kettering Cancer Center (New York, New York), University Medical Center Utrecht (The Netherlands), and Sint Antonius Hospital (Nieuwegein, The Netherlands).
The study was approved by the institutional review board of the Amsterdam University Medical Centers, and the need for written informed consent was waived (review number 2017.075).
PET Images
For 68Ga-PMSA and 18F-FCH, all centers were asked to send up to 35 of their most recent, consecutively performed clinical PET examinations. As 18F-DCFPyL scans were only available in a single center, 50 consecutive scans from this center were obtained to ensure an adequate sample size. No patient inclusion criteria were deployed; PET examinations for any stage of PCa were eligible. 18F-FDHT scans are not routinely performed in clinical practice yet. Therefore, scans from a previous prospective research cohort were analyzed (11).
Only static, whole-body images were used (mid thighs to skull vertex). All scans were corrected for decay, scatter, and random coincidences. Photon attenuation was performed using low-dose CT (120–140 kV, 30–80 mA). Imaging was performed with standard time-of-flight PET/CT scanners from Philips Healthcare, The Netherlands/USA (Ingenuity; Gemini TOF); Siemens Healthineers, Germany (Biograph 40); and General Electric, USA (Discovery 710). All centers, except for the Memorial Sloan Kettering Cancer Center, used European Association of Nuclear Medicine Research Ltd. (EARL)–accredited scanners, ensuring harmonized quantification. Standard, vendor-provided image reconstructions were used, which were calibrated to meet the EARL recommendations (12). An overview of the applied reconstruction parameters is presented in Supplemental Table 1 (supplemental materials are available at http://jnm.snmjournals.org).
Data Collection
All PET images were gathered in the Amsterdam UMC and analyzed using in-house–developed software (ACCURATE-tool (13)). Because automated (DICOM-derived) acquisition information is error-prone, clinical documentation was retrieved and used for analysis (e.g., patient’s length, weight; total injected dose and calibration time; injection time; starting time of PET scan) (8).
Tracer uptake was measured in the blood pool (ascending aorta); lung (apically and basally); liver; bone marrow (thoracic vertebra and lumbar vertebra); and muscle (m. erector spinae). Measurements were performed using fixed-sized volumes of interest (VOIs), shaped according to previous recommendations (Table 1) (11). Blood-pool activity concentrations are known to be quite low and hence might be more subject to image noise. Therefore, 3 different VOIs were analyzed to find the optimal measurements and avoid VOI-dependent variability in SUV.
VOI Characteristics
For all VOIs, SUVmax (SUVmax within the VOI), SUVmean (SUVmean within the VOI), and SUVpeak (SUVmean within a 12-mm-diameter sphere positioned within the VOI to yield the highest value) were generated. All SUVs (SUVmax/SUVmean/SUVpeak) were normalized to body weight, lean body mass, and body surface area (Supplemental Applied Equations section) (8).
Data Management and Statistical Analysis
All data were congregated per tracer and checked for inaccuracies (e.g., unrealistic patient weight, erroneous scan times). For QC, scan acquisition efficiency rates were calculated (total image-detected activity/injected dose at start scan). Acquisitions with aberrant efficiency rates were reviewed for inaccuracies in clinical data or technical errors. Extreme SUVs of individual patients (z value > 3) were identified. VOI misplacements were corrected; persisting outliers were not included for further analysis. To further ensure image quality and comparability, we assessed the institutional intra-VOI coefficients of variation (COV%) in the liver, akin to the EARL harmonization procedure (SD/mean of the pixel values within the VOI) (14).
For all SUVs the averages and 95th percentiles (mean ± 1.96*SD) were calculated, which provides the reference ranges for image-based QC. Normality was assessed visually using histogram analyses and Q-Q plots. Variability in SUV was analyzed using COV%, and the differences were analyzed using the Levene F test with Holms–Bonferroni corrected post hoc analysis.
Statistical analyses were performed with IBM SPSS 22.0.
RESULTS
Patient and Scan Results
In total, PET images of 252 PCa patients were available for evaluation. Twenty scans were excluded due to acquisition imperfections (e.g., PET/CT mismatch/excessive patient movement; image artifacts; missing scan information). The final analysis included 87 68Ga-PSMA scans (3 centers); 50 18F-DCFPyL scans (1 center); 68 18F-FCH scans (2 centers); and 27 18F-FDHT scans (2 centers). Overall, patients were scanned at low prostate-specific antigen levels (<10 ng/mL), with the exception of the patients in the 18F-FDHT research cohort (median prostate-specific antigen, 28.5 ng/mL). The use of androgen deprivation therapy (ADT) at the time of the scan was more prevalent in the 18F-FCH and 18F-FDHT groups (49% and 100%, respectively) than in the PSMA cohorts (68Ga-PSMA 33%; 18F-DCFPyL 7%). Patients’ characteristics and scan data are presented in Table 2.
Patient Demographics and Scan Characteristics
The average scanner efficiency rate for 68Ga-PSMA was 75% (95th percentiles, 59%–91%; COV, 10.7%); 18F-DCFPyL 74% (58%–95%; COV, 11.2%); 18F-FCH 88% (69%–108%; COV, 9.9%); and 18F-FDHT 83% (73%–93%; COV, 6.2%). All intra-VOI COV% (liver) remained under the 15% threshold (12) (COV% range, 6.1%–13.3%).
Healthy Tissue Tracer Uptake Variability
68Ga-PSMA
Healthy tissue SUV and variability are presented in Table 3. Tracer uptake in the blood pool showed the lowest uptake variability between patients and was significantly more stable than the uptake in other tissues (difference in COV%, P = 0.001–0.024). Only minor differences in variability were observed using different normalizations factors (average COVs were within 1.0 percentage point [pp] of each other; Supplemental Table 2). Similarly, the differences in variability between SUVmax/SUVmean/SUVpeak were small (COVs within 2.0 pp, Supplemental Table 2). Therefore, only SUVmax and SUVmean normalized to body weight are presented, as these SUVs are clinically most frequently used.
Healthy Tissue Uptake of PCa PET Tracers
An illustration of the heterogeneity in 68Ga-PSMA uptake in the liver is presented in Figure 1, showing patients with tracer uptake 1.2 SDs above and below the population average.
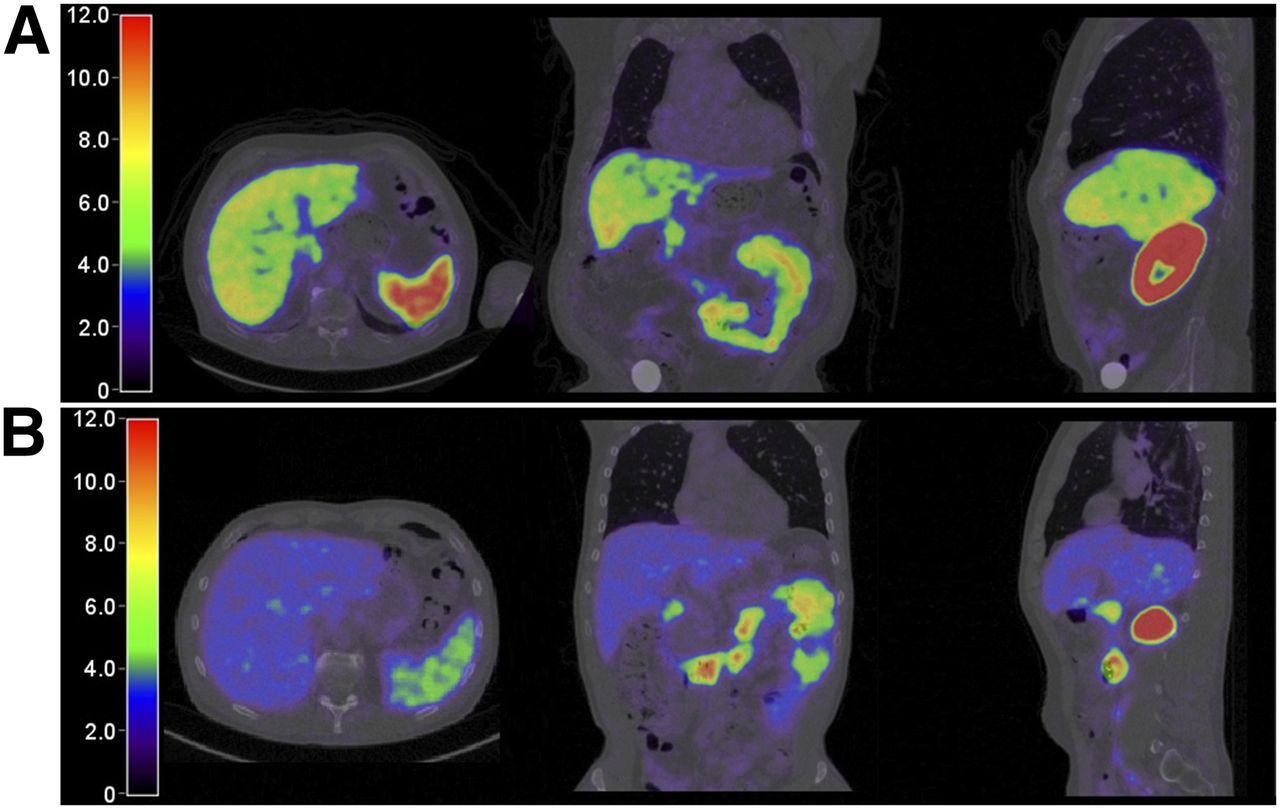
Heterogeneity of 68Ga-PSMA uptake in liver. (A) Patient with liver uptake 1.2 SDs above population average (SUVmean, 6.82; SUVmax, 8.96). (B) Patient with liver uptake 1.2 SDs below average (SUVmean, 2.78; SUVmax, 3.62). Images with identical SUV scaling.
18F-DCFPyL
Tracer uptake in the blood pool showed the lowest variability and was significantly more stable than the uptake in other tissues (difference in COV%, P = 0.001–0.003), except for the uptake in the liver (P = 0.078) (Table 3). Similar to 68Ga-PSMA, different normalization factors and SUV types had limited effect on variability (average COV within 2.0 pp and 1.0 pp, respectively) (Supplemental Table 2).
18F-FCH
Liver uptake showed significantly less variability than the uptake in lung and muscle tissue (P = 0.001–0.012), but not compared with the blood pool or bone marrow (P > 0.17) (Table 3). The COV% of different SUV normalization factors and SUV types were within 1.0 pp and 2.0 pp, respectively (Supplemental Table 2).
18F-FDHT
Tracer uptake in the liver was least variable, though only significantly different from the uptake in the lung (P = 0.001–0.040) (Table 3). Variability (COV%) between different SUV normalization factors and SUV type was within 3.0 pp and 2.0 pp, respectively.
Table 4 provides a summary per tracer of the tissues with least-variable tracer uptake, which might serve as reference region for interpatient analysis.
Suggested Healthy Tissues for Interpatient Analysis
Blood-Pool VOIs
The different blood-pool measurements had limited influence on variability (average COV within 3.0 pp, Supplemental Table 2). We chose the 3 × 3 VOI for uptake variability analysis, as it slightly outperformed the 2 × 2 VOI in terms of stability, and was more practical compared with the multislide 2 × 2 VOI.
Differences in Variability Between Institutes and PET/CT System Vendors
To assess differences in SUV variability between the different institutes and PET/CT system vendors, we calculated the institutional and scanner averages for the suggested reference regions (Fig. 2). Upper and lower thresholds for interinstitutional recovery coefficients were computed, in analogy to the EARL procedure guidelines (total sample average as base) (15). All institutional SUV averages were within the given limits. No significant differences were observed in variability between the institutes or vendors (Fig. 2).

Analysis of uptake variability in suggested reference regions per institute and PET/CT system vendor. Averages and SD. (A) 68Ga-PSMA, blood pool. (B) 18F-FCH, liver. (C) 18F-FDHT, liver.
Influence of ADT on Tracer Uptake Variability
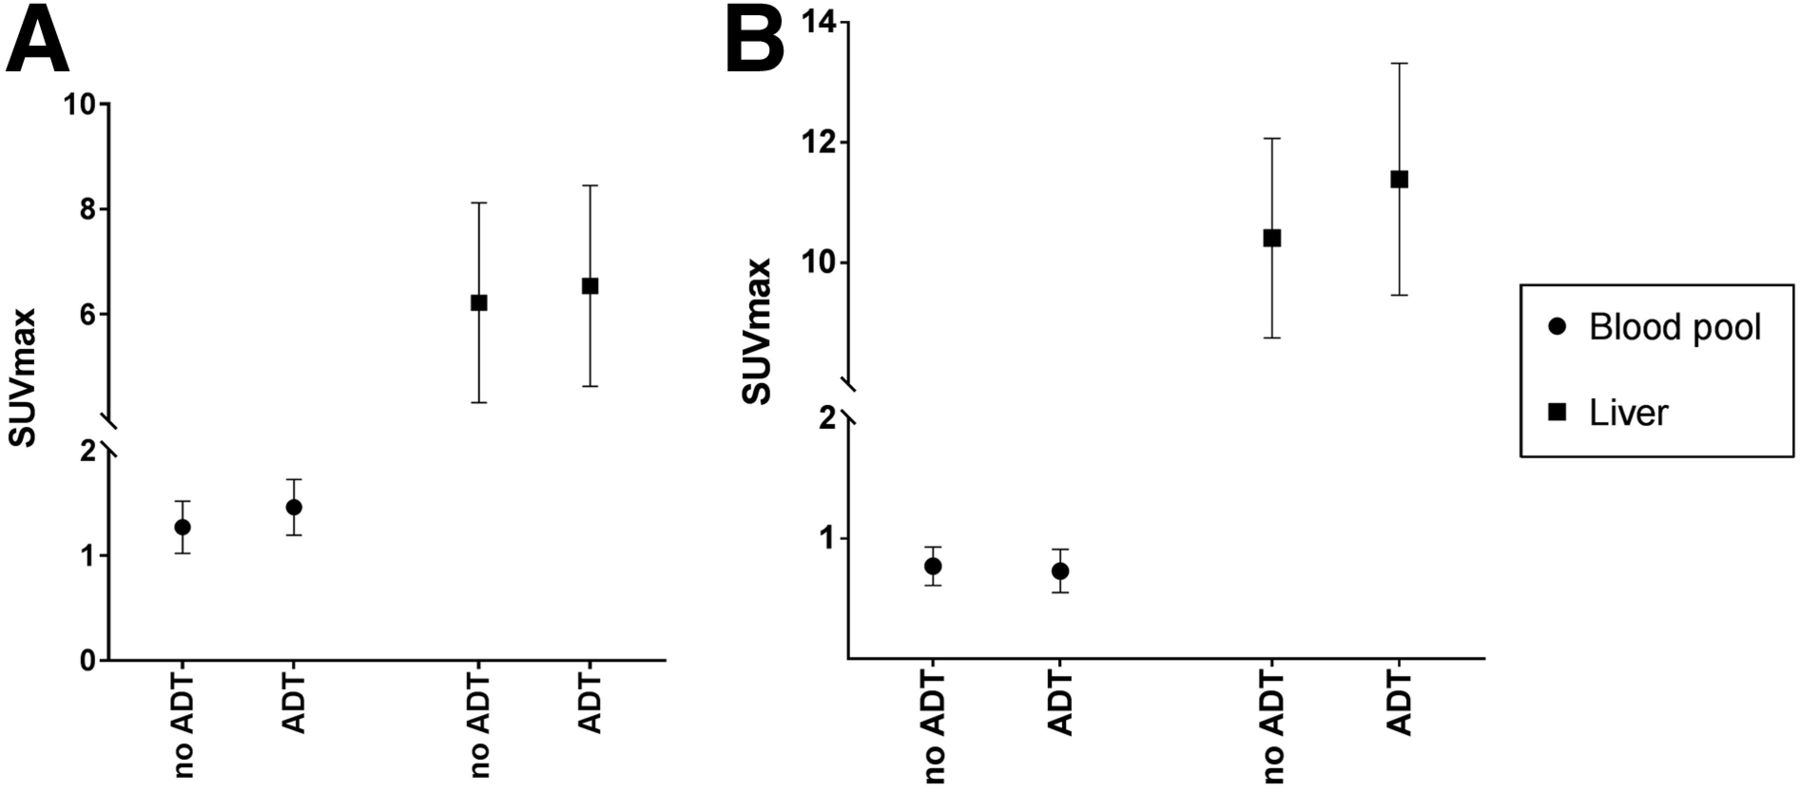
ADT has been shown to affect the expression of PSMA (16–18). Hence, we separately analyzed healthy tissue uptake for patients using ADT and those not using ADT. For 68Ga-PSMA, blood-pool uptake was higher for ADT users than non-ADT users (SUVmax, 1.46 vs. 1.27, respectively, P = 0.002), yet the variability was equal (COV, 19.4% and 18.8%; P = 0.84) (Fig. 3). For 18F-FCH, the SUVmax of the liver was 11.4 in the ADT group versus 10.4 in the non-ADT group (P = 0.03), without differences in variability (COV, 16.9% vs. 15.9%; P = 0.52). The 18F-DCFPyL and 18F-FHDT cohorts did not include a meaningful number of, respectively, ADT and non-ADT users to allow similar analyses (Table 2).

Analysis of uptake variability, stratified by ADT use. Averages and SD. (A) 68Ga-PSMA uptake in blood pool: difference ADT to no ADT, P = 0.002; difference in variability, P = 0.84. Uptake in liver: difference ADT to no ADT, P = 0.47; difference in variability, P = 0.99. (B) 18F-FCH uptake in blood pool: difference ADT to no ADT, P = 0.29; difference in variability, P = 0.29. Uptake in liver: difference ADT to no ADT, P = 0.03; difference in variability, P = 0.52.
DISCUSSION
Knowledge on variability of tracer uptake in healthy tissues is crucial for clinical PET interpretation. In this multicenter analysis, 232 PCa PET scans were evaluated, and uptake variability of 68Ga-PSMA, 18F-DCFPyL, 18F-FCH, and 18F-FDHT was assessed in healthy tissues. For all tracers, tissues with stable tracer uptake were identified and suggested as reference regions (Table 4). As a secondary outcome, SUV reference ranges are presented for image-based QC. Any SUV outside these ranges should prompt careful evaluation of the image quality of the PET examinations. We additionally observed stable scan acquisition efficiencies (COV, 6.6%–11.2%), which could therefore also be used for image-based QC.
Visual assessment of PET images is hampered by interpatient variability, but also by interobserver variability, as evaluation of lesions is done at the discretion of the individual reader. To standardize PET reading, uptake values of healthy tissues are proposed as thresholds to characterize measurable lesions and determine therapeutic response (e.g., 18F-FDG uptake in the liver in the PERCIST (9); uptake in the liver, blood pool, and mediastinum in the Deauville score for malignant lymphoma (19)). Clearly, the validity of these thresholds depended on the uptake variability of the reference region between patients.
In our study, the blood pool was identified as reliable reference region for both 68Ga-PSMA and 18F-DCFPyL. However, stable uptake in the liver was observed only for 18F-DCFPyL. These findings are important, since both the blood pool and the liver are proposed reference regions in the recent PROMISE protocol for PSMA PET interpretation (10). Our analysis supports the use of blood-pool uptake but causes concern regarding the use of liver uptake for 68Ga-PSMA PET interpretation. Furthermore, the PROMISE protocol suggests use of the spleen as a reference region for tracers with a liver-dominant excretion (i.e., 18F-PSMA-1007). We argue for a careful validation of this reference region for 18F-PSMA-1007 first, given the observed variability of PSMA tracer uptake in many organs.
To the best of our knowledge, no prior studies have been performed that explicitly analyzed the healthy tissue uptake variability of 68Ga-PSMA, 18F-FCH, or 18F-FDHT. For 68Ga-PSMA, prior biodistribution studies (including some statistical measures of spread) are available and reveal higher SUVs in the blood pool and liver than were observed in the present study (19–21). The comparison of results is difficult, however, as the previous evaluations included only single-center data and the reported SUVs varied widely (e.g., blood-pool SUVmax, 1.8–4.3) (19–21). Furthermore, no interinstitutional scanner calibration (e.g., EARL harmonization) is reported, and the applied VOI shapes are variable and vaguely described. These limitations and varying results strengthen the need for a centralized analysis of multicenter, cross-calibrated data, as was performed in this study.
It remains unclear what causes the interpatient variability in 68Ga-PSMA uptake in the liver. It has been demonstrated that the liver expresses a PSMA-like protein, which might bind 68Ga-PSMA (22). Alternatively, 68Ga-PSMA has some hepatobiliary excretion and its uptake might therefore be subject to metabolic differences between patients (21,23).
Our results on 18F-DCFPyL are in line with the report by Li et al. (24), demonstrating stable uptake in the liver. Furthermore, Li et al. showed that a 3-cm spheric VOI performed equally to whole-organ assessment and that lean-body mass is not superior to body weight for SUV normalization—all in agreement with our findings. In addition to Li et al., we observed high stability of uptake in the blood pool. Moreover, our results are based on PET acquisitions made at 120 min after injection, which currently seems the optimal time interval (25,26), whereas Li et al. included PET images acquired at 60 min after injection.
Recently, PSMA tracers have attracted much attention for PCa diagnostics, as they offer superior diagnostic accuracy (27,28). However, 18F-FCH PET/CT is still recommended by current clinical guidelines (29) and is used in many clinics and ongoing trials (30,31). Additionally, 18F-FCH is used for indications besides PCa (32). Our results may aid scan interpretation for any indication, although external validity might be hampered by our inherently male population. For 18F-FDHT, relatively limited variability was observed. Although promising, these results should be interpreted cautiously. Only a limited number of scans was analyzed, which were all performed within a stringent research protocol. Real-life clinical results might be more volatile.
To identify reliable and practical uptake measurements, different VOIs were evaluated within individual organs. For the lung, the most stable results were obtained in the apex, although the results were still inferior to other tissues. The variability of basal lung measurements is likely caused by breathing artifacts and the proximity of the liver (high uptake). No differences in variability were observed in bone marrow uptake between thoracic and lumbar vertebrae, even though occult bone metastases are most frequent in the lower spine (33). In this study, we preferred fixed-sized VOIs over whole-organ assessment, since such VOIs are clinically more practical and the assessed tissues were expected to be largely homogeneous.
Our study has several limitations. Even if PET acquisitions are made in accordance to the EARL harmonization protocol, residual differences in SUV can occur (15). In our study, small dissimilarities between institutes were present (Fig. 2), yet the variability of SUV within each center was equal. By performing a multicenter evaluation, we intended to produce outcomes that may be generalized and foster standardization of PCa PET analysis, allowing meaningful exchange of results. Further, only interpatient variability was assessed. Day-to-day uptake variability within patients (intrapatient variability) was not evaluated. Intrapatient variability hampers longitudinal disease evaluation and assessment of treatment response, as changes in tumor uptake relative to the background would be volatile. Moreover, oncologic treatment could affect healthy tissue uptake, making intrapatient interpretation even more complex. To evaluate interpatient variability, robust test–retest analyses of healthy tissue uptake are desired; results for 18F-DCFPyL are expected shortly.
CONCLUSION
In this multicenter analysis, healthy tissue uptake of 68Ga-PSMA, 18F-DCFPyL, 18F-FCH, and 18F-FDHT was evaluated. Healthy tissues with limited uptake variability were identified, which may serve as reference regions for image interpretation. Reliable reference regions include the blood pool for 68Ga-PSMA and 18F-DCFPyL, and the liver for 18F-FCH and 18F-FDHT.
Additionally, SUV reference ranges and scan acquisition efficiency rates are provided for each tracer to be used for image-based QC.
DISCLOSURE
Ronald Boellaard reports having a scientific collaboration with Philips Healthcare. Michael J. Morris reports being a consultant for Astellas, Bayer, Endocyte, Advanced Accelerator Applications, Blue Earth Diagnostics, and Tokai and having institutional research contracts with Bayer, Sanofi, Endocyte, Progenics, Corcept, and Roche. No other potential conflict of interest relevant to this article was reported.
Footnotes
Published online Jan. 10, 2019.
- © 2019 by the Society of Nuclear Medicine and Molecular Imaging.
REFERENCES
- Received for publication October 30, 2018.
- Accepted for publication December 17, 2018.


