


Abstract
Although absent in most adult tissues, hexokinase 2 (HK2) is expressed in most tumors and contributes to increased glucose consumption and to in vivo tumor 18F-FDG PET signaling. Methods: Both HK2 knockdown and knockout approaches were used to investigate the role of HK2 in cancer cell proliferation, in vivo xenograft tumor progression, and 18F-FDG tumor accumulation. BioProfiler Glycolysis analysis monitored cell culture glucose consumption and lactate production; 18F-FDG PET/CT monitored in vivo tumor glucose accumulation. Cancer Cell Line Encyclopedia data were analyzed for hexokinase 1 (HK1) and HK2 expression. Results: Neither cell proliferation in culture nor xenograft tumor progression are inhibited by HK2 knockdown or knockout in cancer cells that express HK1 and HK2. However, cancer subsets from a variety of tissues of origin express only HK2, but not HK1. In contrast to HK1-positive/HK2-positive (HK1+HK2+) cancers, HK2 knockdown in HK1-negative (HK1−) HK2+ cancer cells results in inhibition of cell proliferation, colony formation, and xenograft tumor progression. Moreover, HK1-knockout (HK1KO)HK2+ cancer cells are susceptible to HK2 inhibition, in contrast to their isogenic HK1+HK2+ parental cells. Conclusion: HK1 and HK2 expression are redundant in tumors; either can provide sufficient aerobic glycolysis for tumor growth, despite a reduction in 18F-FDG PET signal. Therapeutic HK2 inhibition is likely to be restricted to HK1−HK2+ tumor subsets, and stratification of tumors that express HK2, but not HK1, should identify tumors treatable with emerging HK2 specific inhibitors.
Increased aerobic glycolysis—the Warburg Effect (1)—has been associated with cancer for 90 y. The hexokinases (HKs), the first enzymes committed to glycolysis, convert glucose to glucose-6-phosphate. There are 4 HK isoforms, HK1–HK4 (2). Most adult tissues express only HK1. Muscle and adipose tissue use HK2 for glycolysis; liver and pancreatic β-cells express HK4 (also called glucokinase) and do not express HK1 or HK2. In contrast to normal tissues, many tumors express both HK1 and HK2. Elevated hexokinase activity as a driver of tumor glycolysis was reported in the late 1970s (3); however, it was about 30 y later until HK2 expression was identified in most cancers (4). No cancer therapy based on interventions directed at elevated tumor glycolysis is approved for clinical use.
Development of the positron-emitting glucose analog 18F-FDG (5) and PET technology (6) led, in the late 1970s/early 1980s, to 18F-FDG PET clinical applications to study, noninvasively, glucose metabolism in the brain (7), heart (8), and cancer (9). HK2 is a likely major contributor to the increased conversion of 18F-FDG to 18F-FDG-6P in most tumors. 18F-FDG PET oncologic clinical imaging has played a major role in cancer diagnosis, metastasis detection, monitoring disease progression, and both selection and modification of therapeutic protocols.
Cell culture and xenograft tumor data from human breast (10), lung (10), pancreatic (11), and prostate (12) cancer and glioblastoma (13) have been interpreted to suggest that selective HK2 inhibition has potential to be a near-globally effective cancer therapeutic. Moreover, global HK2 deletion in adult mice is tolerated (10). These data have stimulated intense interest in development of selective HK2 inhibitors for cancer therapy. Enthusiasm has been substantially elevated by description of small-molecule inhibitors with preference for HK2 over HK1 (14). However, no laboratory has directly compared the roles of HK1 and HK2 in tumor progression and 18F-FDG PET imaging.
Here we find that HK1-positive/HK2-positive (HK1+HK2+) cancers can tolerate HK2 silencing. Although HK1+HK2+ xenograft tumor progression is unaffected by HK2 deletion, 18F-FDG PET signal is significantly reduced. Moreover, subsets of cancers from a variety of tissues of origin express HK2 but not HK1 and are sensitive to HK2 silencing-induced inhibition of cell proliferation in culture and suppression of xenograft tumor growth.
MATERIALS AND METHODS
Cell Lines
H460, CFPAC1, U87, PC3, Hep3B, and HepG2 were from the American Type Culture Collection. UMUC3, 253J, T24, 5637, SW780, and HT1197 were from Dr. Mark Day (University of Michigan). Huh7, JHH7, and JHH5 were from Dr. Dennis Slamon (UCLA). RPMI8226, OPM2, H929, and U266 were from Dr. Sherie Morrison (UCLA). HLF, JHH6, and SNU398 were from Ionis Pharmaceuticals. All cells were maintained in RPMI1640 + 10% fetal bovine serum, 37°C, 5% CO2/95% air. Mycoplasma contamination was routinely analyzed using MycoAlert (Lonza).
Antibodies
HK1 (#2024), HK2 (#2867), and glyceraldehyde 3-phosphate dehydrogenase (GAPDH) (#5174) antibodies were from Cell Signaling Technology.
Doxycycline (DOX)-Inducible Short Hairpin RNA (shRNA) Knockdown
shRNAs (shHK2–1: GGATGTGTGTGAACATGGAATTTCAAGAGAATTCCATGTTCACACACATCC; shHK2–2: CTTCATGGATAAGCTACAAATTTCAAGAGAATTTGTAGCTTATCCATGAAG; shHK2–3: CCAAAGACATCTCAGACATTGTTCAAGAGACAATGTCTGAGATGTCTTTGG; shHK2–4: CCGTAACATTCTCATCGATTTTTCAAGAGAAAATCGATGAGAATGTTACGG; shHK2–5: CACGATGAAATTGAACCTGGTTTCAAGAGAACCAGGTTCAATTTCATCGTG; shCtrl: TAGCGACTAAACACATCAATTCAAGAGATTGATGTGTTTAGTCGCTA) were used for DOX-inducible knockdown as described (15).
CRISPR Cas9 HK2 and HK1 Knockout
HK2 gRNA (TGACCACATTGCCGAATGCC) and HK1 gRNA (AGATGTTGCCAACATTCGTA) were used for HK1 and HK2 knockout as described (16).
Colony Formation Assay
Cells (1,000/well) were seeded in 6-well plates in the presence or absence of DOX (25 ng/mL). Media were refreshed every 3 d. After 15–20 d, colonies were stained with 2% crystal violet (17).
Glucose Consumption and Lactate Production
Cells (3 × 10⁵) were seeded in 6-well plates in triplicate. After 24 h, medium was refreshed. Media from a well with no cells was used as a control. After 24 h, 1 mL of medium from each sample was analyzed in the Bioprofile Analyzer (Nova Biomedical). Values were normalized to cell number and time interval.
Medium Metabolite Measurements
Metabolites were measured as described (15) after 24 h cell culture.
Subcutaneous Xenograft Tumor Growth
Cells (Hep3B, 5 × 10⁶; H460, 1 × 10⁶; CFPAC1, 2 × 10⁶) were implanted subcutaneously in nu/nu mice (Jackson Laboratory). Tumor volume was assessed by Vernier caliper measurement (D × d2/2; D and d are longest and shortest tumor diameters). For DOX-induced HK2 knockdown studies, xenograft tumors were allowed to grow to 200 mm3. Mice were then randomly assigned to 2 groups treated with control or DOX diet (625 mg of DOX per kg diet).
Cell Proliferation
Cell growth was assessed with a 3-(4,5-dimethylthiazol-2-yl)-2,5-diphenyltetrazolium bromide assay (18).
Tumor Glucose Consumption by 18F-FDG PET/CT
Animals without fasting were warmed on a heating pad for 30 min, anesthetized with 2% isoflurane in oxygen, and injected via tail vein with 3.7 MBq of clinical-grade 18F-FDG. Mice were maintained under anesthesia in a heated induction chamber during the 1-h biodistribution period before imaging. PET/CT scans were conducted on a G8 instrument (Sofie Biosciences) with a 600-s PET acquisition and maximum-likelihood expectation maximization reconstruction, with a 50-s CT acquisition and Feldkamp reconstruction. PET/CT images were coregistered, and tumor regions of interest were analyzed using AMIDE software.
Statistical Analysis
The Student t test was used for statistical analysis, and P value was determined by Prism 5 (GraphPad Software). Differences were considered statistically significant at a P value of less than 0.05. Differential expression analysis between HK1+HK2+ and HK1-negative (HK1−) HK2+ liver cancer cell lines was conducted using the limma R package (19).
RESULTS
HK2 Knockdown Has No Significant Effect on Proliferation in Culture or Tumor Xenograft Progression for HK1+HK2+ Cancer Cells
Previous studies reported that breast (10), lung (10), pancreatic (11), and prostate (12) cancer cells and glioblastoma cells (13) are sensitive to HK2 knockdown both for proliferation in culture and for xenograft tumor progression. In a search for the cancer types most sensitive to HK2 inhibition, we used 1 cell line from each of these studies to examine shHK2 modulation of cell proliferation. All 4 cell lines were reported to respond to HK2 knockdown–induced growth inhibition in cell culture and in xenograft tumors. Like most cancers, these 4 cell lines express both HK1 and HK2 (Supplemental Figs. 1A and 1B; supplemental materials are available at http://jnm.snmjournals.org).
The previous studies (10–13) studying the role of HK2 in cancer progression used different HK2 shRNAs and shRNA expression systems. To compare our experiments with these published studies we designed 2 additional shHK2 sequences (shHK2–1 and shHK2–2), and used shHK2–1, shHK2–2, and the most effective shHK2 sequence from each of the individual studies (termed shHK2–3 (10), shHK2–4 (11,12), and shHK2–5 (13)) (Supplemental Figs. 2A and 2B), to identify the optimal shHK2 for comparisons across cells of different tumor origin. To avoid selecting resistant cells in response to constitutive HK2 knockdown, we used a DOX-inducible system to compare side-by-side HK2 knockdown effects. In all 4 cell lines, shHK2–1 demonstrated the best HK2 knockdown efficacy (Supplemental Fig. 2C). HK2 knockdown did not affect HK1 protein levels (Supplemental Fig. 2C). However, no shHK2 had a significant effect on cell proliferation (Fig. 1A) or colony formation (Supplemental Fig. 3) for any of the 4 cell lines.
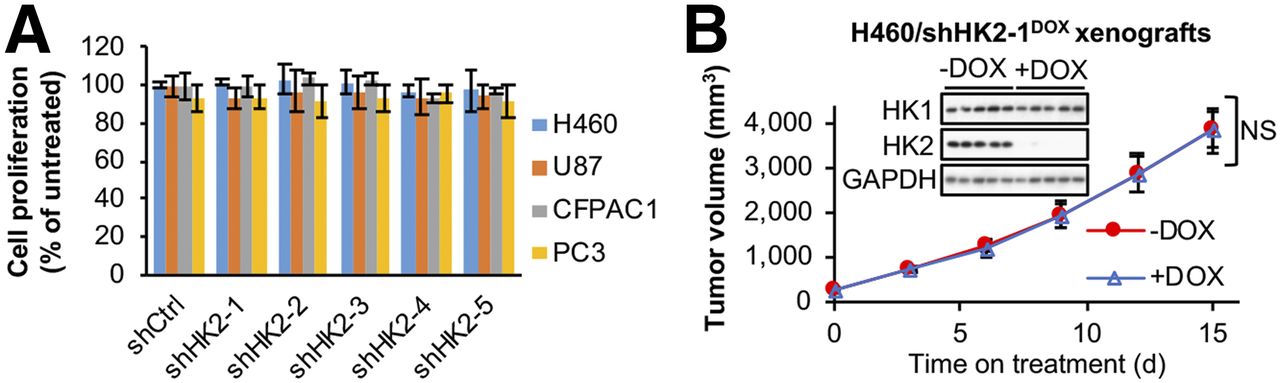
HK2 shRNA knockdown has no significant effect on cell proliferation in culture or xenograft tumor progression in HK1+HK2+ cancer cell lines. (A) HK2 shRNA knockdown has no detectable significant effect on cell proliferation for HK1+HK2+ cancer cell lines. H460, U87, CFPAC1, and PC3 cells with indicated DOX-inducible shRNAs integrated in genome were cultured with or without DOX for 7 d. Error bars = SD. (B) DOX-induced HK2 shRNA knockdown has no detectable significant effect on subcutaneous HK1+HK2+ H460/shHK2–1DOX xenograft tumor progression. After tumors reached > 200 mm3, tumor-bearing mice were placed on control or DOX-supplemented diets for 15 d (n = 5/group). Error bars = SE. NS = not significant. Tumors were collected on day 15, and extracts were analyzed for HK1 and HK2 expression by Western blotting.
HK2 shRNAs were reported to inhibit subcutaneous xenograft tumor growth for H460 (10), U87 (13), CFPAC1 (11), and PC3 (12) cells. We established H460/shHK2–1DOX xenografts. When tumors reached 200 mm3 (day 0), mice were switched to DOX or vehicle diets (Fig. 1B). HK2 knockdown had no significant effect on H460/shHK2–1DOX xenograft tumor growth, despite suppression of tumor HK2 expression, demonstrated in tumor extracts after sacrifice (Fig. 1B, inserted panel).
HK2 Knockout Has No Significant Effect on HK1+HK2+ Cancer Cell Proliferation or Xenograft Tumor Progression
Studies (10–13) were published before CRISPR Cas9 gene inactivation technology became widely used. As an orthogonal approach to examine the role of HK2 in HK1+HK2+ cancer cell growth, we used CRISPR Cas9 to knockout HK2 in H460, U87, CFPAC1, and PC3 cells (Supplemental Fig. 4A). HK2 knockout did not alter HK1 protein levels (Supplemental Fig. 4A). Consistent with our shHK2 knockdown data (Fig. 1A; Supplemental Fig. 3), HK2 knockout did not significantly affect cell proliferation (Fig. 2A) or colony formation (Supplemental Fig. 4B). It is important to note that FDG, a glucose analog and effective inhibitor for both HK1 and HK2, reduced proliferation of all the cell lines (Supplemental Fig. 4C), indicating that the growth of these cells is dependent on hexokinase activity.

CRISPR Cas9 HK2 gene knockout has no significant effect on cell proliferation in HK1+HK2+ cancer cell lines. (A) HK2 knockout has no significant effect on cancer cell proliferation in culture. WT and HK2KO isogenic H460, U87, CFPAC1, and PC3 cells were cultured for 5 d. Media were refreshed on day 3. Error bars = SD. (B) HK2 knockout reduces glucose consumption and lactate production. Error bars = SD. *P < 0.05. **P < 0.01. ***P < 0.001. ***P < 0.0001.
Although HK2 knockout did not affect HK1+HK2+ cancer cell proliferation or colony formation, HK2 knockout reduced glucose consumption, compared with wild-type (WT) isogenic cells, by 65% in H460 cells, 44% in U87 cells, 35% in CFPAC1 cells, and 30% in PC3 cells (Fig. 2B). Lactate production in HK1−HK2+ isogenic cells showed a reduction similar to that for glucose consumption: 73% in H460, 42% in U87, 38% in CFPAC1, and 31% in PC3 (Fig. 2B).
We then examined the effect of HK2 knockout on H460 (lung cancer) and CFPAC1 (pancreatic cancer) tumor growth. H460 (10) and CFPAC1 (11) xenograft growth were reported to be suppressed by HK2 shRNAs. However, we observed no significant differences in growth rates between WT and HK1+HK2KO isogenic tumors (Fig. 3). At the end of the experiments tumors were collected (Fig. 3, inserted panels) and weighed. No significant differences in tumor weight between WT and isogenic HK2 knockout tumors were detectable for either H460 or CFPAC1 xenografts (Supplemental Fig. 5A). The absence of detectable HK2 protein in HK2KO H460 and CFPAC1 tumors was confirmed (Supplemental Fig. 5B); HK1 expression was not altered by HK2 knockout.
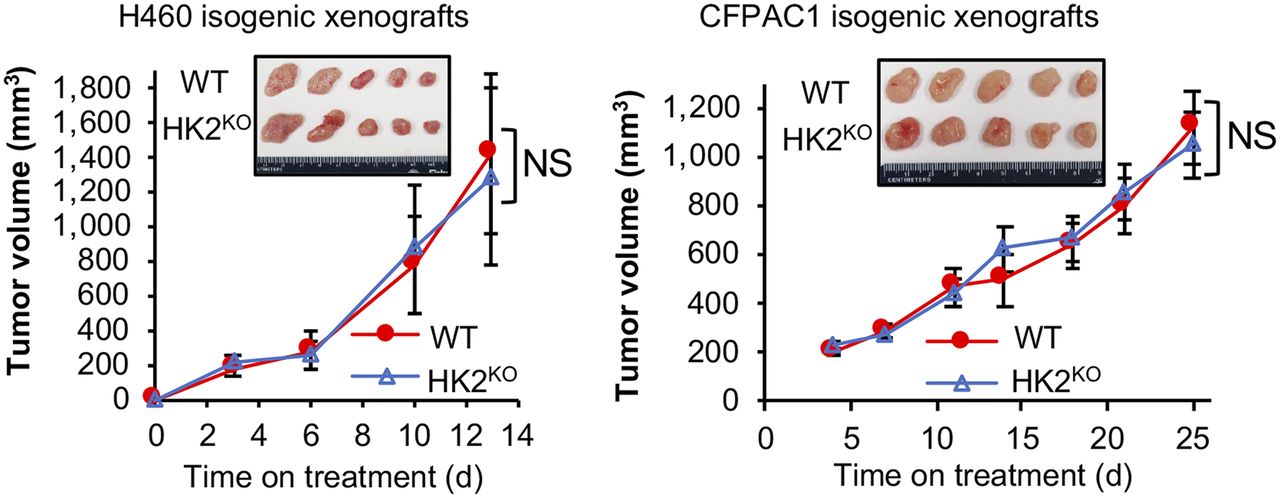
CRISPR Cas9 HK2 gene knockout has no detectable significant effect on HK1+HK2+ xenograft tumor progression. Tumor volumes were measured twice weekly for 13 d (H460) or 25 d (CFPAC1) (n = 5/group). Error bars = SE. Inserts = appearance of tumors collected at experiment conclusions. H460 tumors were collected on day 13. CFPAC1 tumors were collected on day 25.
HK2 Knockout in HK1+HK2+ Tumors Reduces 18F-FDG PET Signal In Vivo
To determine whether glucose metabolism is reduced in HK1+HK2KO xenograft tumors when compared with parental HK1+HK2+ tumors, we compared, by small-animal PET analysis (5,6), 18F-FDG uptake in isogenic HK1+HK2+ and HK1+HK2KO H460 xenografts. Individual mice were injected with both HK1+HK2KO and HK1+HK2+ H460 cells, on opposite flanks, to eliminate all experimental variables (e.g., injected 18F-FDG dose, mouse health, mouse activity, etc.) except for tumor hexokinase genotypes. The 18F-FDG PET scan data quantification indicates a 50% reduction in HK1+HK2KO tumors (Fig. 4). We also isolated tumors after small-animal PET scans and measured radioactivity by well counting; there was a 50% reduction in HK1+HK2KO tumors compared with WT tumors (Supplemental Fig. 6).

HK2 contributes to 18F-FDG PET signals in xenograft HK1+HK2+ tumors. Mice bearing H460/WT tumors on their left flanks and H460/HK2KO tumors on their right flanks (n = 3) were subjected to 18F-FDG PET scans. (Left) Representative small-animal PET image. (Right) Mean values of PET signal intensity quantifications for H460/WT and H460/HK2KO tumors. Error bars = SE. *P < 0.05.
HK1 or HK2 Alone Are Sufficient to Support Cancer Cell Proliferation and Xenograft Tumor Progression
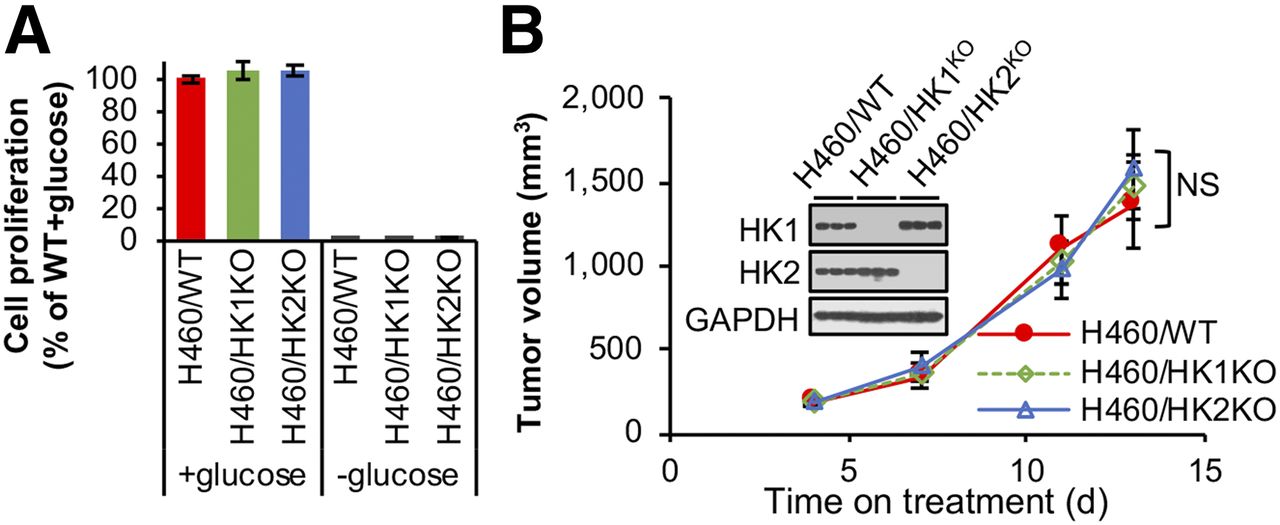
We suggest that either HK1 or HK2 expression alone is sufficient to support cancer cell proliferation and xenograft tumor progression. To test this hypothesis, we knocked out HK1 in H460 cells (Supplemental Fig. 7A). Growth arrest in the absence of glucose indicates all 3 isogenic cell lines (HK1+HK2+, HK1KOHK2+, and HK1+HK2KO) require glycolysis for proliferation (Fig. 5A); however, in the presence of glucose absence of neither HK2 nor HK1 inhibits cell proliferation (Fig. 5A) or colony formation (Supplemental Figs. 4B and 7B). Like HK2 deletion in H460 cells, HK1 deletion has no significant effect on tumor progression; either HK1 or HK2 expression is sufficient for optimal tumor cell xenograft progression (Fig. 5B). Although HK1 or HK2 knockout reduced glycolysis rates, HK1KO or HK2KO cells did not increase use of other nutrients in cell culture medium to maintain their proliferation ability (Supplemental Fig. 7D). These data indicate that either HK2- or HK1-driven glycolysis alone in tumors is sufficient to support xenograft tumor progression and that the acquired HK2 upregulation of aerobic glycolysis in cancer (the Warburg Effect) can be redundant for cancer progression in many tumors that express high levels of HK1.

HK1 or HK2 alone can sustain cancer cell proliferation and tumor progression. (A) H460/WT, H460/HK1KOHK2+, and H460/HK1+HK2KO isogenic cells depend on glucose and proliferate at similar rates in cell culture. Indicated H460 isogenic cells were cultured with or without 10 mM glucose for 72 h. Error bars = SD. (B) Neither HK1 nor HK2 gene knockout has a detectable effect on H460 tumor xenograft progression (n = 5/group). Error bars = SE. NS = not significant. Tumors were collected on day 13, and tumor extracts were analyzed by Western blot for HK1 and HK2 expression.
Tumor Subsets Originating from Wide Variety of Tissues Express HK2, but Not HK1
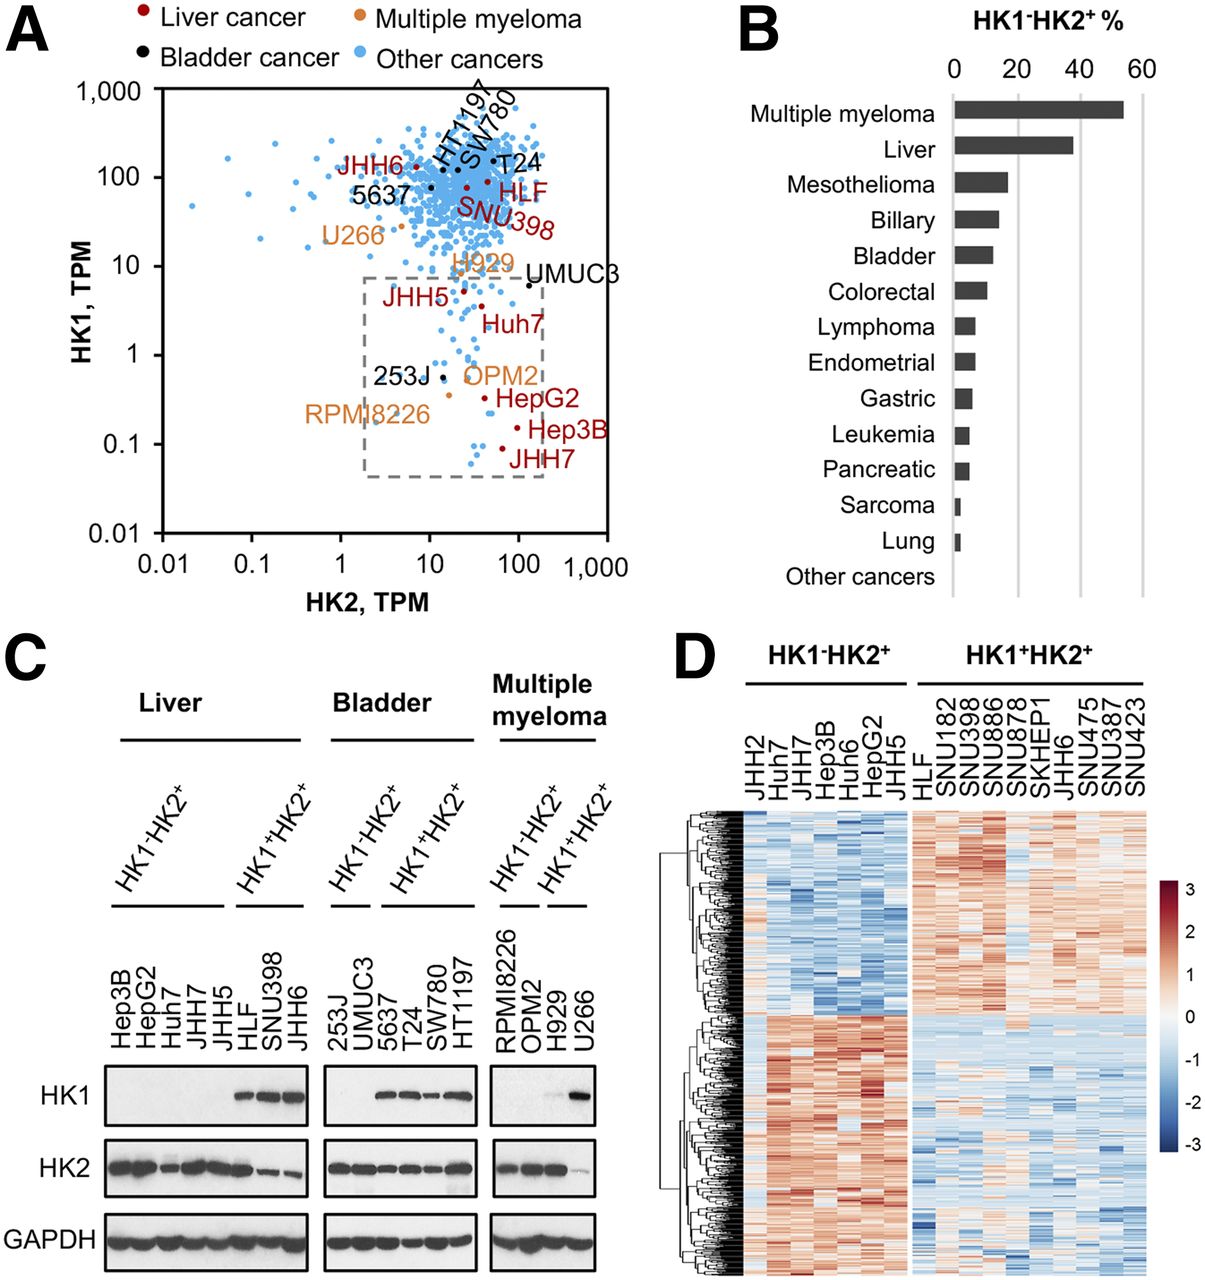
The preceding data demonstrate that HK2 expression is redundant for HK1+HK2+ cancer progression and suggest that, in contrast to current proposals, selective pharmacologic HK2 inhibition in HK1+HK2+ tumors is not likely to be a viable cancer therapeutic approach. However, tumors expressing HK2, but no/very low HK1, would be susceptible to targeted HK2 inhibition. Six percent of the cell lines characterized in the Cancer Cell Line Encyclopedia (CCLE) data base (20) express relatively high HK2 and low HK1 messenger RNA (mRNA) levels (Fig. 6A). Although the HK1− percentages for tumors of different origins varies substantially, a wide variety of different tumor types have member subsets that are HK1−HK2+ (Fig. 6B), multiple myeloma (54% are HK1-) and liver cancer (38% are HK1-) in particular (Supplemental Figs. 8A and 8B).

Subsets of cancers express low or undetectable HK1 levels. (A) HK1−HK2+ cancer cell lines present in CCLE collection (http://oasis-genomics.org). HK1 and HK2 mRNA expression of 935 cell lines are shown. Each data point represents a cell line. Box indicates HK1−HK2+ cell lines, defined as HK2 > 1 TPM and HK1 < 10 TPM. TPM = transcripts per million. Representative cancer cell lines are highlighted and labeled. (B) Percentages of HK1-HK2+ CCLE cancer cell lines in cancers from different tissues of origin. HK1−HK2+ property is defined as HK2 > 1 TPM and HK1 < 10 TPM. (C) Validation of HK1 and HK2 protein levels in representative CCLE cell lines. HK1 and HK2 protein levels in lysates prepared from indicated liver cancer, bladder cancer, and multiple myeloma cell lines highlighted in A were examined by Western blot. (D) Differential gene expression profiles of HK1−HK2+ and HK1+HK2+ liver cancer cell lines. All liver cancer cell lines in the CCLE dataset were analyzed for differential gene expression. Six hundred eighty-five genes with significant differences (P < 0.05) between the 2 populations are shown.
We confirmed that cell lines from liver cancer, bladder cancer, and multiple myeloma within the chosen HK1−HK2+ mRNA boundaries (Fig. 6A) are HK1−HK2+ at the protein levels. (Fig. 6C). JHH5 and H929 are particularly notable; they are at the HK1 mRNA expression uppermost boundary (Figs. 6A and 6C). Moreover, examination of the TCGA database (http://www.cbioportal.org) suggests that more than 80% of HK2+ liver cancers have no/very low HK1 expression (Supplemental Fig. 9). Because normal liver expresses only HK4, examination of the ratio of HK1−HK2+ versus HK1+HK2+ tumors will not be affected by normal liver tissue contamination in liver tumor biopsies.
Examining RNASeq data for liver cancer cell lines in the CCLE collection revealed that HK1−HK2+ cell lines share similar gene expression profiles and HK1+HK2+ cell lines also share similar gene expression profiles. However, the shared gene expression profiles of HK1−HK2+ and HK1+HK2+ cell lines differ from one another (Fig. 6D; Supplemental Table 1).
HK2 Knockdown Suppresses Proliferation of HK1−HK2+ Cancer Cells Regardless of Tissue of Origin
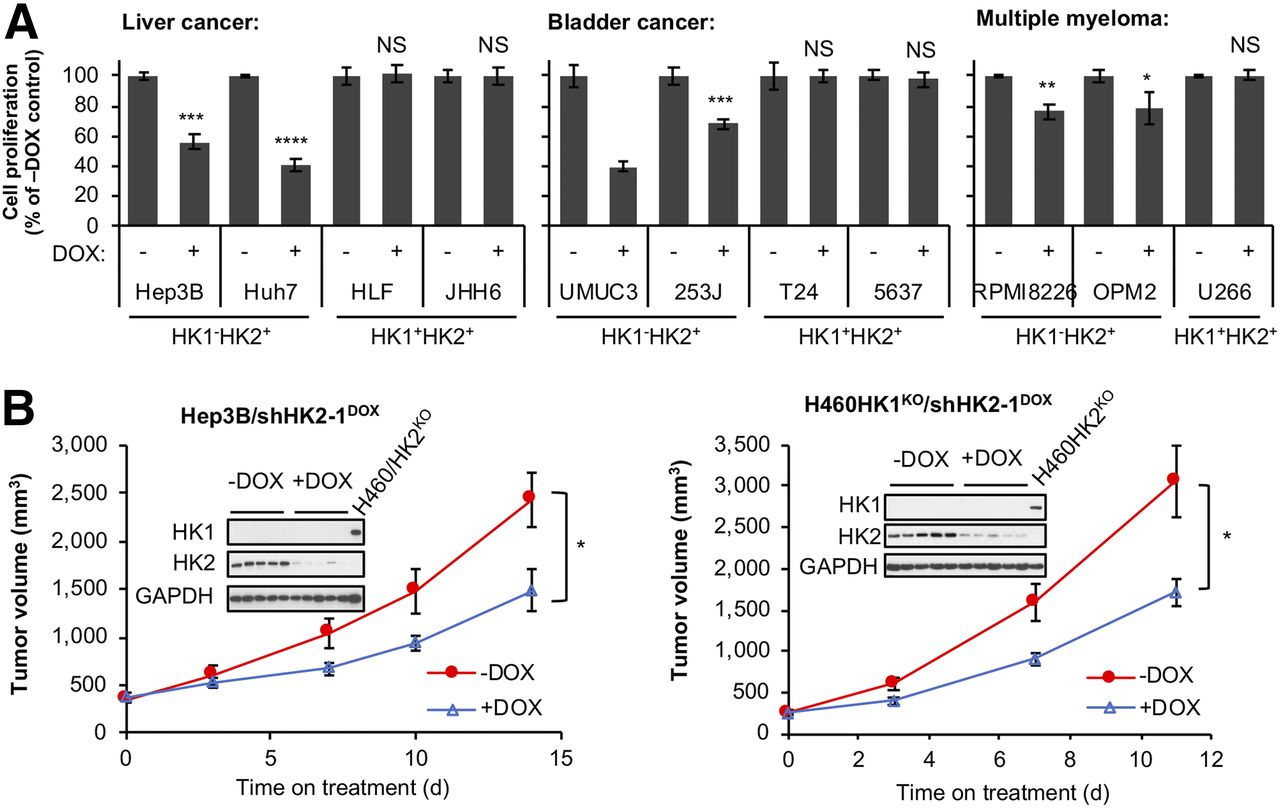
To test the suggestion that HK2 inhibition will suppress growth in HK1−HK2 + cancers from a variety of tissues, we examined the consequences of DOX-induced shRNA HK2 knockdown in HK1−HK2+ and HK1+HK2+ liver, bladder, and multiple myeloma cancer cell lines from the CCLE collection (Supplemental Fig. 10A). For all HK1−HK2+ cancer cells, regardless of tissue of origin, cell proliferation (Fig. 7A) and colony formation (Supplemental Fig. 10B) were inhibited by HK2 knockdown. In contrast, inhibition of HK2 expression did not modulate proliferation or colony formation in HK1+HK2+ cell lines.

HK2 knockdown reduces cell proliferation in culture and xenograft tumor progression in HK1−HK2+ cancers from a variety of tissues. (A) DOX-induced HK2 knockdown reduces cell proliferation in culture in HK1−HK2+ cells, but not in HK1+HK2+ cells. Cells with integrated shHK2–1DOX were treated with 25 ng/mL DOX for 7 d in cell proliferation assay. Error bars = SD. (B) HK2 shRNA knockdown reduces HK1−HK2+ xenograft tumor progression. After tumors reached > 200 mm3, mice were placed on control or DOX-supplemented diets to induce shHK2–1 expression in Hep3B/shHK2DOX (left) xenograft tumors or H460HK1KOHK2+/shHK2DOX (right) xenograft tumors for indicated periods (n = 5/group). Error bars = SE. Xenograft tumors were collected on last day of treatment, and tumor extracts were analyzed for HK1 and HK2 expression. Lysates from H460/HK2KO cells were included as a positive control for HK1 expression and a negative control for HK2 expression. * P < 0.05. **P < 0.01. ***P < 0.001. ****P < 0.0001. NS = not significant.
To extend our comparison of cell proliferation and xenograft progression between HK1−HK2+ and HK1+HK2+ tumor cells using isogenic cells, we established DOX-inducible shHK2 in H460/HK1KOHK2+ isogenic cells (H460HK1KOHK2+/shHK2DOX cells) (Supplemental Fig. 10C). Cell proliferation and colony formation are suppressed by HK2 silencing in H460HK1KOHK2+/shHK2DOX cells (Supplemental Figs. 10D and 10E).
Although neither HK2 knockdown (Fig. 1B) nor knockout (Fig. 3) can reduce HK1+HK2+ tumor progression, our cell culture data suggest HK2 silencing in HK1−HK2+ tumors will suppress progression in vivo. To examine this suggestion, Hep3B (HK1-HK2+) xenograft progression was examined in the presence or absence of HK2 silencing. ShHK2 expression was induced by dietary shift when Hep3B/shHK2DOX tumors reached 200 mm3. DOX-induced shRNA HK2 knockdown reduced tumor growth by 39% (Fig. 7B, left). Similarly, although HK2 knockdown has no effect on HK1+HK2+ H460 xenograft progression (Fig. 1B), when HK2 is silenced in isogenic H460 HK1KOHK2+/shHK2DOX cells by DOX-induced shHK2, xenograft progression is significantly reduced (Fig. 7B, right).
DISCUSSION
Upregulated aerobic glycolysis (the Warburg Effect) has been exploited with clinical 18F-FDG PET imaging for tumor diagnosis; for tumor prognosis; and for choice, evaluation, and modification of therapeutic modalities. The most prominent hypotheses for the functions of cancer cell aerobic glycolysis are supply of energy, reducing equivalents, or glucose carbon to build intermediates to support cancer progression (21). However, most glycolytically consumed glucose carbon is converted in tumor cells to released lactic acid (22); carbon mass in cancer cells comes predominantly from imported amino acids (23). How the Warburg Effect benefits cancer is still inconclusive (24).
Although most normal tissues do not express HK2 (2), HK2 is expressed by most cancers and contributes to the upregulation of cancer aerobic glycolysis. Previous HK2 shRNA knockdown studies in HK1+HK2+ cell lines from breast (10), lung (10), prostate (12), pancreatic (11), and brain (13) tumors reported HK2 knockdown inhibited cancer cell proliferation in culture and xenograft tumor progression and suggested HK2 as a potential global cancer therapeutic target. However, using both those same shHK2 sequences (11–14) and shHK2 sequences we designed that have greater efficacy in reducing HK2 levels, we did not observe significant differences in cell proliferation, colony formation, or xenograft tumor growth in these cancer cells when HK2 expression was silenced, despite substantial differences in glucose consumption.
Using an orthogonal approach, we generated isogenic HK1+HK2KO clones using CRISPR Cas9 technology and did not observe significant effects on colony formation, cell culture proliferation, or xenograft tumor progression. However, glucose consumption in cell culture and small-animal PET imaging of 18F-FDG accumulation in vivo were similarly reduced, suggesting that HK2 is redundant in cancer cells that express high levels of HK1; HK1+HK2+ tumor cells have an excess, unneeded capacity for aerobic glycolysis; and although a useful tool for noninvasive measurements of tumor pharmacodynamics of HK2 inhibitors, 18F-FDG PET imaging would have limitations in predicting therapeutic outcomes of HK2 inhibitors in HK1+HK2+ tumors.
Our observations are consistent with a study that identified genes essential for cancer cell growth or survival in HK1+HK2+ human CML KBM7 cells using a genomewide screen (25). Neither HK1 nor HK2 was identified as an essential gene, suggesting their redundancy in cells that express both hexokinases. In contrast, HK2 is an essential gene in Jiyoye cells, a lymphoma cell line that expresses only low levels of HK1 (25). We conclude that, in cancers in which both HK1 and HK2 are expressed, HK1 and HK2 can compensate each other for cell proliferation and tumor progression. Consequently, targeting HK2 would not be an effective therapy in HK1+HK2+ cancers.
In examining the CCLE collection, we find a significant subset (6%) of cancer cells do not express HK1, with particularly high frequencies in multiple myelomas and liver cancers. In contrast to results for HK1+HK2+ cancer cells, proliferation, colony formation and xenograft progression of HK1-HK2+ tumor cells originating from a variety of tissues of origin are suppressed by HK2 silencing. Moreover, WT H460 (HK1+HK2+) cells, resistant to HK2 silencing inhibition of both proliferation in culture and xenograft tumor progression, can be converted to be sensitive to HK2 silencing when HK1 is deleted to create isogenic HK1KOHK2+ H460 cells.
Examination of the TCGA database suggests that more than 80% of HK2+ liver cancers have no/very low HK1 expression. However, because of potential contamination by normal tissue expressing HK1 for other tumor types, biopsy samples will have to be assayed by single cell analyses (e.g., single cell RNASeq, immunohistochemistry, flow cytometry), to determine the frequencies of HK1−HK2+ versus HK1+HK2+ cancer cohorts in tissues of most origins.
No HK-targeted therapies have entered clinical cancer treatment, largely due to lack of selective HK2 inhibitors and lack of identification of cancer types most sensitive to HK2 blockade. Molecular metabolic characterization of HK isoform expression, rather than tissue of origin, will guide the potential use of HK2-targeted cancer therapy for HK1−HK2+ cancers. We suggest that selective pharmacologic HK2 inhibitors will be promising agents for management of HK1−HK2+ cancers. However, our data also suggest that monotherapy with selective HK2 inhibitors will not eradicate HK1−HK2+ cancers; these cancers are likely to use other sources, for example, oxidative phosphorylation, for energy production to maintain survival. Combining agents targeting these other energy generation sources with HK2 inhibition, as precision therapies, may achieve synthetic lethality in HK1−HK2+ cancers and be tolerated by normal tissues that express HK1. Stratification of patients with HK1−HK2+ cancers, particularly in multiple myeloma and liver cancer, would identify individuals for synergistic combination therapies involving selective HK2 inhibitors.
CONCLUSION
Our data suggest a potential discrepancy between tumor 18F-FDG PET signal and tumor progression in HK1+HK2+ versus HK1−HK2+ tumors. Although therapeutic HK2+ inhibition is likely to be restricted to HK1−HK2+ tumor subsets, stratification of tumors of many different origins that express HK2, but not HK1, should identify tumors targetable with emerging selective HK2 inhibitors.
DISCLOSURE
Shili Xu is a DoD Horizon Awardee (W81XWH-16-1-0162). Harvey Herschman is supported by the Crump and Phelps Family Foundations. No other potential conflict of interest relevant to this article was reported.
Acknowledgments
We thank Drs. Caius Radu and Sotirios Tetradis for comments and advice. We thank Dr. Mark Day and Mrs. Kathleen Day (University of Michigan), Dr. Sherie Morrison (UCLA), and Ionis Pharmaceuticals for cell lines for this study.
Footnotes
Guest Editor: Todd Peterson, Vanderbilt University
Published online Jun. 7, 2018.
- © 2019 by the Society of Nuclear Medicine and Molecular Imaging.
REFERENCES
- Received for publication April 4, 2018.
- Accepted for publication May 31, 2018.


