


Abstract
18F-fluorocholine (18F-FCH) PET/CT is a promising and increasingly used scan technique in the preoperative imaging of parathyroid adenoma. Several acquisition methods have been evaluated in the literature, but the optimal image acquisition time point after administration of the tracer is still under debate. Methods: Patients who had hyperparathyroidism, underwent dual-time-point 18F-FCH PET/CT (image acquisition, 5 min; 60 min after injection), and had histologically proven pathologic parathyroid glands were retrospectively included in the study. Early and late images were compared both visually and quantitatively. Results: Sixty-four patients were included, and a total of 71 parathyroid glands were surgically removed. Visually, there were no differences between early and late images of hyperfunctioning parathyroid glands in 44 patients (69%); in 13 patients (20%), visualization on early images was better; in 6 patients (9%), visualization of hyperfunctioning glands was best on late images; and in 1 patient (2%), the lesion was exclusively visualized on late images. For the total cohort, there was a significant decrease in 18F-FCH uptake in the glands on late versus early time points (P = 0.001), but there was a significant increase in the ratio of parathyroid uptake to thyroid uptake (P = 0.037). The group of patients with better visualization on early images showed a decrease over time in both parathyroid uptake and the ratio of parathyroid uptake to thyroid uptake, significant in comparison to those in both the group with better visualization at later time points and the group in which visualization was similar at both time points (P values of 0.000–0.018). There were no significant differences in 18F-FCH uptake and the ratio of parathyroid uptake to thyroid uptake between the latter 2 groups (P values of 0.200–0.709). Conclusion: In most patients (89%), hyperfunctioning parathyroid glands were adequately visualized on early imaging; however, in a subset of patients (11%), such glands were best visualized at later time points. Therefore, we recommend the acquisition of dual-time-point images in parathyroid imaging with 18F-FCH PET/CT or the creation of an opportunity to acquire additional late images after review of early images when findings are inconclusive.
Hyperparathyroidism covers a spectrum of parathyroid diseases, with primary hyperparathyroidism being the most common. This disease develops as a result of the autonomous production and secretion of parathyroid hormone (PTH) from the parathyroid glands, with prevalences of 3 in 1,000 in the general population and up to 21 in 1,000 in postmenopausal women (1,2). Secondary hyperparathyroidism typically occurs in patients with chronic renal disease because derangements in calcium and phosphorus levels result in increased PTH. Tertiary hyperparathyroidism is the condition that may follow after secondary hyperparathyroidism when PTH secretion transforms from compensatory to autonomous.
Symptomatic primary hyperparathyroidism is routinely treated with parathyroidectomy, in which the accurate localization of hyperfunctioning parathyroid glands can be beneficial in preoperative planning and is a prerequisite for minimally invasive surgery. In secondary and tertiary hyperparathyroidism, which also may be treated with parathyroidectomy, imaging is mainly performed to detect ectopic or supernumerary glands (3). To visualize parathyroid lesions, various morphology-based imaging techniques, such as ultrasonography, CT, and MRI, can be used; however, the current reference method is functional imaging with 99mTc-sestamibi. Recently, 18F-fluorocholine (18F-FCH) PET/CT was proposed and investigated as a tool for the detection of hyperfunctioning parathyroid tissue, with promising results (4,5).
Although various acquisition protocols have been described, the optimal time point for image acquisition after injection of 18F-FCH is still under debate. In previous studies, time points ranging from 0 to 120 min after injection were used, with conflicting results. Scanning at both early and late time points has been suggested, and authors have reported lesions that were visualized on early images only (6–8). The objective of the present study was to evaluate different uptake patterns and differences in the visualization of parathyroid glands on early and late images using dual-time-point 18F-FCH PET/CT in patients with hyperparathyroidism.
MATERIALS AND METHODS
Patient Selection
Patients who underwent dual-time-point 18F-FCH PET/CT for the evaluation of hyperparathyroidism were included in this study when both PET/CT results were positive and PET/CT was followed by surgery and when parathyroid adenoma or hyperplasia was histopathologically proven. All patient data, including baseline characteristics, scan results, and quantitative measurements, were prospectively entered into a database. Additional follow-up data were retrieved from the electronic patient records. Patients were classified on the basis of clinical indication: primary, secondary, or tertiary hyperparathyroidism. Primary hyperparathyroidism was defined as either a persistent elevation of serum calcium levels with corresponding elevated or nonsuppressed PTH levels or high PTH levels and normal serum calcium levels (i.e., normocalcemic hyperparathyroidism) (9). Secondary hyperparathyroidism was defined as low serum calcium levels and high PTH levels associated with chronic renal failure, and tertiary hyperparathyroidism was defined as a persistent elevation of PTH levels after treatment of secondary hyperparathyroidism because of autonomous PTH production.
Informed Consent
The institutional research department approved this retrospective study, and all patients signed written informed consent for the use of their anonymized data for scientific purposes. Besides the standard imaging protocol and clinical management, no additional measurements or actions affecting the patient were performed. The study was performed in accordance with the Declaration of Helsinki. Approval of the local ethics committee was not necessary for the present study because the study did not fall within the scope of the Dutch Medical Research Involving Human Subjects Act (section 1.b WMO; February 26, 1998).
Scan Acquisition
PET/CT images were acquired on a Siemens Biograph-16 TruePoint PET/CT camera (Siemens Healthcare). Early images of the thyroid region were acquired 5 min after intravenous injection of approximately 150 MBq of 18F-FCH. The following acquisition parameters were used: 1 bed position for 480 s, a matrix size of 256 × 256, low-dose CT for attenuation correction, a tube current of 40 mAs at 100 kV, Siemens CARE Dose 4D dose modulation, collimation of 24 × 1.2 mm, and a pitch of 0.95. Late images ranging from the temporomandibular joint to the diaphragm were acquired 60 min after injection. Corresponding with early images, late images were acquired at 480 s per bed position and a matrix size of 256 × 256. Late CT images for attenuation correction and anatomic mapping were acquired using a tube current of 80 mAs at 120 kV, collimation of 16 × 1.2 mm, and a pitch of 0.95. Both early and late PET images were reconstructed with an iterative 3-dimensional method using 5 iterations, 8 subsets, and a gaussian filter. For interpretation of the images and quantitative measurements, dedicated software (syngo.via; Siemens Medical Solutions) was used. Patient preparation consisted of hydration with 1 L of water and, if applicable, discontinuation of colchicine 48 h before 18F-FCH administration. Discontinuation of calcimimetic drugs or other medications was not required.
Image Interpretation
Imaging results were prospectively recorded in a database after scan interpretation. The results of each 18F-FCH PET/CT scan were scored as negative, equivocal, or positive for hyperfunctioning parathyroid glands. In the presence of well-defined focal 18F-FCH uptake at typical locations, the scan results were considered positive for hyperfunctioning parathyroid tissue. If tracer uptake was of very low intensity or could not be distinguished from uptake in the thyroid gland, then the scan results were considered equivocal. A physiologic distribution of 18F-FCH or an abnormal distribution with an explanation other than hyperfunctioning parathyroid tissue defined the scan results as negative.
Other image data that were entered into the database included the locations of abnormal foci (left or right, cranial or caudal with respect to the thyroid gland, intrathyroidal or ectopic) and the numbers of abnormal foci (solitary adenoma, multiple adenomas, or 4-gland hyperplasia). Early and late images were compared both quantitatively and visually. Visually, the scans were compared independently by 2 nuclear medicine physicians. Each scan was categorized into 1 of 5 subcategories: visualization on early images only, best visualization on early images, no essential difference, best visualization on late images, and visualization on late images only. In case of a discrepancy between the 2 readings, the appropriate category was assigned by consensus. Acquired quantitative measurements of abnormal foci were SUVmax and SUVpeak. Additionally, the SUVs of the thyroid gland were measured as a reference, and the ratios of parathyroid uptake to thyroid uptake (P/T ratios) were calculated.
Statistical Analysis
Normally distributed continuous data were expressed as mean ± SD and range, and nonnormal continuous data were expressed as median and interquartile range. Noncontinuous data were expressed as numbers and percentages. A paired-samples t test or a Mann–Whitney U test was used when appropriate to compare differences between early and late time points and between subgroups. A P value of less than 0.05 was considered significant. Statistical analysis was performed using the Statistical Package for the Social Sciences, version 20 (IBM SPSS Statistics).
RESULTS
Sixty-four patients were included in the study, and 18F-FCH scans were performed from April 28, 2016, to March 14, 2018 (Table 1). Clinical indications for 18F-FCH PET/CT were primary hyperparathyroidism (including multiple endocrine neoplasia type 2A–associated disease and lithium-induced disease) in 61 patients, secondary hyperparathyroidism in 2 patients, and tertiary hyperparathyroidism in 1 patient. A total of 71 glands were surgically removed. The locations of the removed glands were as follows: 9 (13%) left superior, 25 (35%) left inferior, 6 (9%) right superior, and 27 (38%) right inferior; 1 gland (1%) was located within the thyroid gland; and 3 glands (4%) were ectopically located. Histopathologic examination yielded 59 single adenomas and 2 double adenomas, concordant with the scan results. For 1 patient with secondary hyperparathyroidism, 4-gland hyperplasia was shown on the scan; 3 of the excised glands were histologically confirmed to be hyperplastic; and the fourth gland was not found and was left in situ. The scan of the other patient with clinically suspected secondary hyperparathyroidism showed single-gland disease (recurrent hyperparathyroidism after earlier excision of a contralateral parathyroid adenoma). For the patient with tertiary hyperparathyroidism, 4-gland hyperplasia was also shown on the scan; all of the glands were removed and histopathologically confirmed to be hyperplastic. All patients showed a clinically significant decrease in PTH levels after surgery (at least a 50% reduction).
Patient Characteristics
In patients with multiple pathologic parathyroid glands shown on 18F-FCH PET/CT, 1 gland was randomly selected for further analysis to avoid potential bias due to nonindependent observations, resulting in a total of 64 analyzed lesions. Visual comparison yielded no essential difference in the visibility of the pathologic parathyroid gland on early and late images from 44 scans (69%). Thirteen scans (20%) showed better visualization on early images, and 6 scans (9%) showed better visualization on late images. One scan (2%) had negative results on early images but showed a single parathyroid adenoma on late images, whereas no scans had exclusively positive results on early images. Examples of best visualization on early and late images are shown in Figures 1 and 2, respectively. The results of 2 scans were considered equivocal on both early and late images; 1 of these displayed an intrathyroidal hot spot with the differential diagnosis of thyroid adenoma, whereas the other showed an isointense lesion close to the thyroid. Histopathology proved that both lesions were parathyroid adenomas.

Example of dual-time-point 18F-FCH PET/CT with best visualization of parathyroid adenoma on early images. (A) Early images (from left to right: attenuation-corrected [AC] PET, PET/CT fusion, and maximum-intensity projection [MIP] images acquired at 5 min after injection) show intense tracer uptake in right inferior parathyroid adenoma. (B) Late images (from left to right: AC PET, PET/CT fusion, and MIP images at 60 min after injection) show nearly complete washout of tracer.

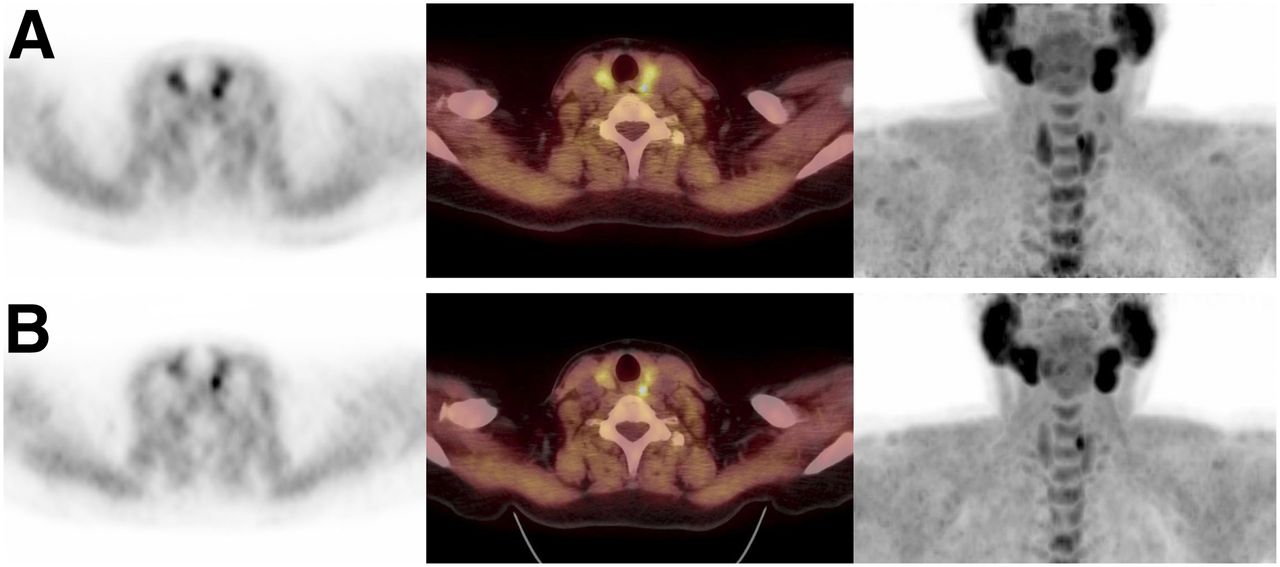
Example of dual-time-point 18F-FCH PET/CT with best visualization of parathyroid adenoma on late images. (A) Left superior parathyroid adenoma is visualized on early images with tracer uptake approximately isointense with that of thyroid gland (from left to right: attenuation-corrected [AC] PET, PET/CT fusion, and maximum-intensity projection [MIP] images acquired at 5 min after injection). (B) On late images, adenoma is more apparent because of faster washout of tracer from thyroid gland (from left to right: AC PET, PET/CT fusion, and MIP images at 60 min after injection).
The scan in which the parathyroid gland was visualized only on late images was excluded from further quantitative analysis. For the cohort in total, the early SUVmax was significantly higher whereas the early SUVmax P/T ratios were significantly lower than those on late images (P values were 0.001 for the absolute difference and 0.037 for the ratio difference; paired-samples t test). More or less the same results were found for the measured SUVpeak (P values were <0.001 for the absolute difference and 0.021 for the ratio difference; paired-samples t test) (Fig. 3).

Comparison of early and late SUV measurements and P/T ratios.
Figure 4 shows several differences in quantitative results between the subgroups on the basis of visual interpretation. There was a decrease in 18F-FCH uptake on late images for the subgroup with better visualization on early images; this result was more apparent for the absolute difference than for the ratio difference. There was a slight trend toward higher absolute 18F-FCH uptake in the parathyroid lesions and higher relative uptake compared with that in the thyroid gland for the subgroup with better visualization on late images. Statistically, a significant difference was found between the subgroup with better visualization on early images and the subgroup with better visualization on late images (P values were 0.001 for the absolute difference and 0.001 for the ratio difference; Mann–Whitney U test) as well as the subgroup with equivocal visualization (P values were <0.001 for the absolute difference and <0.001 for the ratio difference; Mann–Whitney U test). No significant difference was found between the subgroup with better visualization on late images and the subgroup with equivocal visualization (P values were 0.221 for the absolute difference and 0.200 for the ratio difference; Mann–Whitney U test). Analysis of the SUVpeak measurements did not lead to different conclusions (Fig. 5).

Bland–Altman plots. (Top left) Plots of differences in 18F-FCH uptake (SUVmax) in parathyroid lesions against mean uptake in each lesion. (Bottom left) Plots of differences in P/T ratios (SUVmax) against mean ratio for each lesion. For SUVpeak, data are similarly plotted at top right and bottom right, respectively. Dotted lines are mean values and 95% CIs for total cohort.

Differences between 3 subgroups on basis of visual interpretation: better visualization on early images (early better), equivocal visualization (equivocal), and better visualization on late images (late better). (Top left) SUVmax absolute differences. (Bottom left) SUVmax ratio differences. (Top right) SUVpeak absolute differences. (Bottom right) SUVpeak ratio differences.
DISCUSSION
In the present study, differences between parathyroid imaging with 18F-FCH PET/CT at 5 min after injection and 60 min after injection were analyzed. Overall, parathyroid lesions showed higher 18F-FCH uptake on early images and higher P/T ratios on late images. However, different patterns were recognized, and scans with better visualization on early images as well as scans with better visualization on late images were observed.
In previous studies, multiple acquisition protocols were used in parathyroid imaging with 18F-FCH PET/CT, and several studies used a dual-time-point or triple-time-point protocol (5,6,10–15). Lezaic et al. observed better lesion-to-background and lesion-to-thyroid contrast on late images, but all lesions were visible at both time points (10). Also, in 2 studies by Michaud et al., the late images did not yield additional findings (11,12). Two studies found an increase in the SUVmax on late images, in contrast to the observations in the present study, and the results of 1 of those studies also suggested that a single late acquisition may suffice in patients with high PTH levels (4,14). Some reports mentioned a dual-time-point scanning protocol without further explication of different scan results (5,13,15). In a study by Rep et al., the only study with a triple-time-point protocol, the optimal scan time was concluded to be 60 min after injection of the tracer, with higher accuracy than early images and the same accuracy as images obtained at 120 min (accuracies of 94.1%, 96.5%, and 96.5% at 5, 60, and 120 min after injection, respectively) (6). These results were due to nonvisualization of 3 parathyroid lesions on early images. Over time, a decrease in absolute uptake was observed, along with an increase in contrast relative to the thyroid gland, because of lower 18F-FCH retention in the thyroid tissue—in agreement with the findings of the present study.
In the present study, none of the parathyroid lesions were exclusively visualized on early images, but failure to detect parathyroid lesions on delayed imaging has been reported in the literature. One case involved a cystic parathyroid adenoma with possible fast tracer washout due to a rich blood supply (7). Because the highest activity was found in the first minutes on dynamic scans, another group of authors also hypothesized that a major portion of the SUV in the early phase represented blood flow in the adenoma (16). However, no correlation between parathyroid vascularization and choline metabolism was found in a study comparing 18F-FCH PET/CT at 10 min after injection with dual-phase contrast-enhanced CT (arterial phase images acquired 10–15 s after enhancement of the thoracic arch) (17).
In the study of Rep et al., 1 adenoma could not be visualized on late images because of intense 18F-FCH accumulation in bone marrow in 1 patient with polycythemia vera (6). Fast choline washout was also observed in a small series of 7 patients who underwent a 30-min dynamic scan in combination with a static acquisition 60 min after injection (18). Three different uptake patterns were recognized (early washout, stable uptake and late increase), indicating the importance of early acquisition for avoiding nondetection of parathyroid lesions with fast washout. Prabhu et al. prospectively compared early dynamic imaging during the first 15 min after injection with delayed imaging after 45 min (8). A higher SUVmax was observed on dynamic images, there was no significant difference in P/T ratios between early dynamic and late images, and it was suggested that only early imaging would suffice.
For the analysis of 18F-FCH uptake in the present study, both of the commonly used parameters (SUVmax and SUVpeak) that were measured are known to have low interobserver variability (19). We decided not to use SUVmean because it is strongly dependent on the way in which the volume of interest is drawn and therefore has higher interobserver variability, especially with small parathyroid lesions. In the present study, the use of SUVpeak did not lead to different results than the use of SUVmax, and it seems that both methods are suitable for SUV measurements of parathyroid lesions.
Because the aim of the study was to analyze 18F-FCH uptake patterns in hyperfunctioning parathyroid glands, we decided to include only histologically proven pathologic lesions. As a consequence, no difference in the accuracy of early versus late imaging could be calculated. Histopathologic examination was used as a reference standard in the present study. The histopathologic examination of parathyroid tissue can be difficult in certain cases; in particular, the distinction between adenoma and hyperplasia is not always clear (20). Because of the small number of hyperplastic parathyroid glands versus parathyroid adenomas in the present study, no subgroup analysis was performed.
Additionally, evaluation of the correlations between uptake patterns, laboratory values, and the size or weight of the parathyroid glands may be of interest for future research. A known pitfall of 18F-FCH PET/CT is tracer uptake in lymph nodes, which can cause false-positive results in parathyroid scanning, especially for foci in ectopic locations. Multiple-time-point scanning can help to identify benign lymph nodes (21). Moreover, Prabhu et al. reported that early dynamic imaging was also able to differentiate between adenomas and cervical lymph nodes (8).
In the present study, patients did not have to discontinue calcimimetic drugs or other medications, except for colchicine, before PET/CT (22). In previous studies on parathyroid imaging with 18F-FCH PET/CT, discontinuation of parathyroid drugs also was not applied, but no specific research has been done on this matter. Moreover, with conventional 99mTc-sestamibi parathyroid imaging, the discontinuation of medications is also disputable (23,24).
CONCLUSION
Variable 18F-FCH uptake patterns were observed on dual-time-point 18F-FCH PET/CT parathyroid imaging. Although most hyperfunctioning parathyroid glands were visualized on both early and late images, some lesions might have been missed if only 1 time point had been used. Therefore, we recommend the acquisition of dual-time-point images in parathyroid imaging with 18F-FCH PET/CT or the creation of an opportunity to acquire additional late images after review of early images when findings are inconclusive.
DISCLOSURE
No potential conflict of interest relevant to this article was reported.
KEY POINTS
QUESTION: What is the value of performing 18F-fluorocholine PET/CT at 2 time points in parathyroid imaging?
PERTINENT FINDINGS: This retrospective cohort study showed variable uptake patterns with significant differences in parathyroid lesion uptake between early and late images. In some cases, scanning at one time point did not suffice, therefore it is recommended to acquire dual-time-point images.
IMPLICATIONS FOR PATIENT CARE: In this upcoming imaging technique, these findings are of importance in improving scanning protocols to optimize the accuracy of parathyroid lesion detection.
Footnotes
Published online Mar. 15, 2019.
- © 2019 by the Society of Nuclear Medicine and Molecular Imaging.
REFERENCES
- Received for publication December 31, 2018.
- Accepted for publication March 6, 2019.


Jump to section
Related Articles
Cited By...
- No citing articles found.