


Abstract
The aim of this study was to evaluate the operating characteristics of a microwave radiometry system in the noninvasive assessment of activated and nonactivated brown adipose tissue (BAT) and normal-tissue temperatures, reflecting metabolic activity in healthy human subjects. The radiometry data were compared with 18F-FDG PET/CT images in the same subjects. Methods: Microwave radiometry and 18F-FDG PET/CT were sequentially performed on 19 participants who underwent a cold intervention to maximize BAT activation. The cold intervention involved the participants’ intermittently placing their feet on an ice block while sitting in a cool room. Participants exhibiting BAT activity qualitatively on PET/CT were scanned again with both modalities after undergoing a BAT minimization protocol (exposure to a warm room and a 20-mg dose of propranolol). Radiometry was performed every 5 min for 2 h before PET/CT imaging during both the warm and the cold interventions. A grid of 15–20 points was drawn on the participant’s upper body (data were collected at each point), and a photograph was taken for comparison with PET/CT images. Results: PET/CT identified increased signal consistent with BAT activity in 11 of 19 participants. In 10 of 11 participants with active BAT, radiometry measurements collected during the cold study were modestly, but significantly, higher on points located over areas of active BAT on PET/CT than on points not exhibiting BAT activity (P < 0.01). This difference lessened during the warm studies: 7 of 11 participants showed radiometry measurements that did not differ significantly between the same set of points. The mean radiometry result collected during BAT maximization was 33.2°C ± 1.5°C at points designated as active and 32.7°C ± 1.3°C at points designated as inactive (P < 0.01). Conclusion: Passive microwave radiometry was shown to be feasible and, with substantial improvements, has the potential to noninvasively detect active brown adipose tissue without a radiotracer injection.
Until recently, the extent to which brown adipose tissue (BAT) is present and active in adult humans was unclear. The introduction of imaging modalities such as PET/CT and selective tissue sampling has confirmed that functional BAT exists into adulthood (1–3). Additionally, the inverse correlation between active BAT and overall adiposity may imply that BAT plays a role in the regulation of energy expenditure (4). Thus, BAT has been proposed as a potential target for modulating metabolic activity in humans. However, current approaches for evaluating the presence and activity of BAT do not allow for a true assessment of its role in energy homeostasis because they require activation of BAT (generally using a cold intervention) and provide information on BAT activity during only a limited time frame. Developing a method capable of monitoring BAT activity for extended periods and under normal daily conditions is critical for understanding the full extent to which BAT affects human metabolism.
The preferred method to investigate the presence and activity of BAT has been 18F-FDG PET/CT. Increased uptake of 18F-FDG in BAT indicates greater glucose utilization and has been shown, using correlative studies with 15O-oxygen and 11C-acetate, to be associated with increased oxidative metabolism and thermogenesis in BAT (5–7). Although this method offers excellent sensitivity in detecting active BAT, the use of ionizing radiation limits its application in healthy human participants in research. In addition, because 18F-FDG uptake is a mainly irreversible process as 18F-FDG is phosphorylated, obtaining information about the dynamics of BAT activation, such as on/off switching, is difficult. Furthermore, 18F-FDG PET/CT is limited to detecting active BAT during the imaging session whereas BAT activity levels may vary substantially throughout the day. To complement these shortcomings, additional noninvasive methods are needed.
Thermographic imaging techniques are of interest because BAT is a thermogenically active tissue and has been shown to be significantly warmer than surrounding tissue (8). Infrared thermography is one such method, which is used to produce thermograms based on detection of radiation in the long-infrared range of the electromagnetic spectrum. Lee et al. tested this method in 87 individuals and found that there were skin temperature differences between the supraclavicular fossae and mediastinal regions that became more pronounced after a meal and exposure to cold (9). Other studies have assessed the ability of infrared thermography to detect activated BAT, with 18F-FDG PET/CT imaging used as a gold standard, and found higher supraclavicular temperatures in BAT-positive individuals (10,11). Though infrared thermography avoids the cost and radiation limitations of 18F-FDG PET/CT, it is still limited to detecting BAT only during the imaging session. In addition, infrared thermography can detect only skin-surface temperatures whereas BAT is a subcutaneous tissue.
Microwave radiometers are instruments for measuring thermally generated microwave noise emissions, the intensity of such emissions being proportional to the absolute temperature of the emitting body (12). Microwaves, unlike visible or infrared radiation, can penetrate through clouds, and microwave radiometers are therefore widely used for remote sensing of the earth from satellites (13). Also, unlike infrared and visible radiation, microwaves can penetrate deeply into tissues, and microwave radiometers can therefore be used to noninvasively detect increased temperatures of deep-seated tissues. This feature of microwave radiometers has been put to several medical applications, including the detection of breast cancers and carotid inflammation, as well as hyperthermia treatment of cancer (14–16).
In medical applications of microwave radiometry, a microwave antenna is placed on the skin above the volume of subsurface tissue whose temperature one wants to estimate, and the microwave noise over a chosen bandwidth reaching the antenna is amplified and rectified. A major difficulty in relating the amount of microwave noise reaching the antenna to the temperatures of the subsurface target tissues is that the thermally generated microwave noise emitted by the target subsurface tissues must pass through overlying tissues before reaching the antenna. These overlying tissues not only attenuate the thermal microwave noise emissions from the target tissues but also contribute thermal microwave noise emissions of their own. Choosing a lower-frequency bandwidth for the microwave radiometer can minimize losses in the overlying tissues because loss of microwaves traversing tissues decreases with frequency. However, using a lower operating frequency band reduces spatial resolution.
The aim of this study was to evaluate the operating characteristics of a noninvasive microwave radiometry system in the assessment of BAT and normal-tissue temperatures, reflecting metabolic activity in healthy human subjects. The radiometry data were compared with 18F-FDG PET/CT images in the same subjects.
MATERIALS AND METHODS
This prospective study was approved by the Johns Hopkins Medicine Institutional Review Board (approval NA_00050285) and conducted according to the principles expressed in the Declaration of Helsinki. Written informed consent was obtained from all participants. Healthy participants between the ages of 18 and 35 y with a body mass index of less than 25 kg/m2 were eligible for the study. Pertinent exclusion criteria included known diabetes mellitus, the use of β-blockers, a history of cold-related injury, and the use of tobacco.
Radiometry data were collected before and during both protocols (outlined below) using a dual-band radiometry system (Fig. 1, MMTC, Inc.). The basic principles of microwave radiometry have been described previously (12,17,18). Briefly, electromagnetic radiation produced by deep tissue at microwave frequencies is measured. The intensity of the radiation is proportional to the absolute temperature of the tissue. The electromagnetic radiation is detected noninvasively using a small microwave antenna (∼2 cm in diameter) placed at the surface of the skin. The depth of measurement is determined mostly by the measurement frequency band of the radiometer used. In this study, radiometry measurements were made using the 3.7- to 4.2-GHz frequency band, a range that minimizes potential interference from terrestrial communication. The radiometer was calibrated for antenna mismatches and temperature variations at the beginning of every study visit that included radiometry data collection.
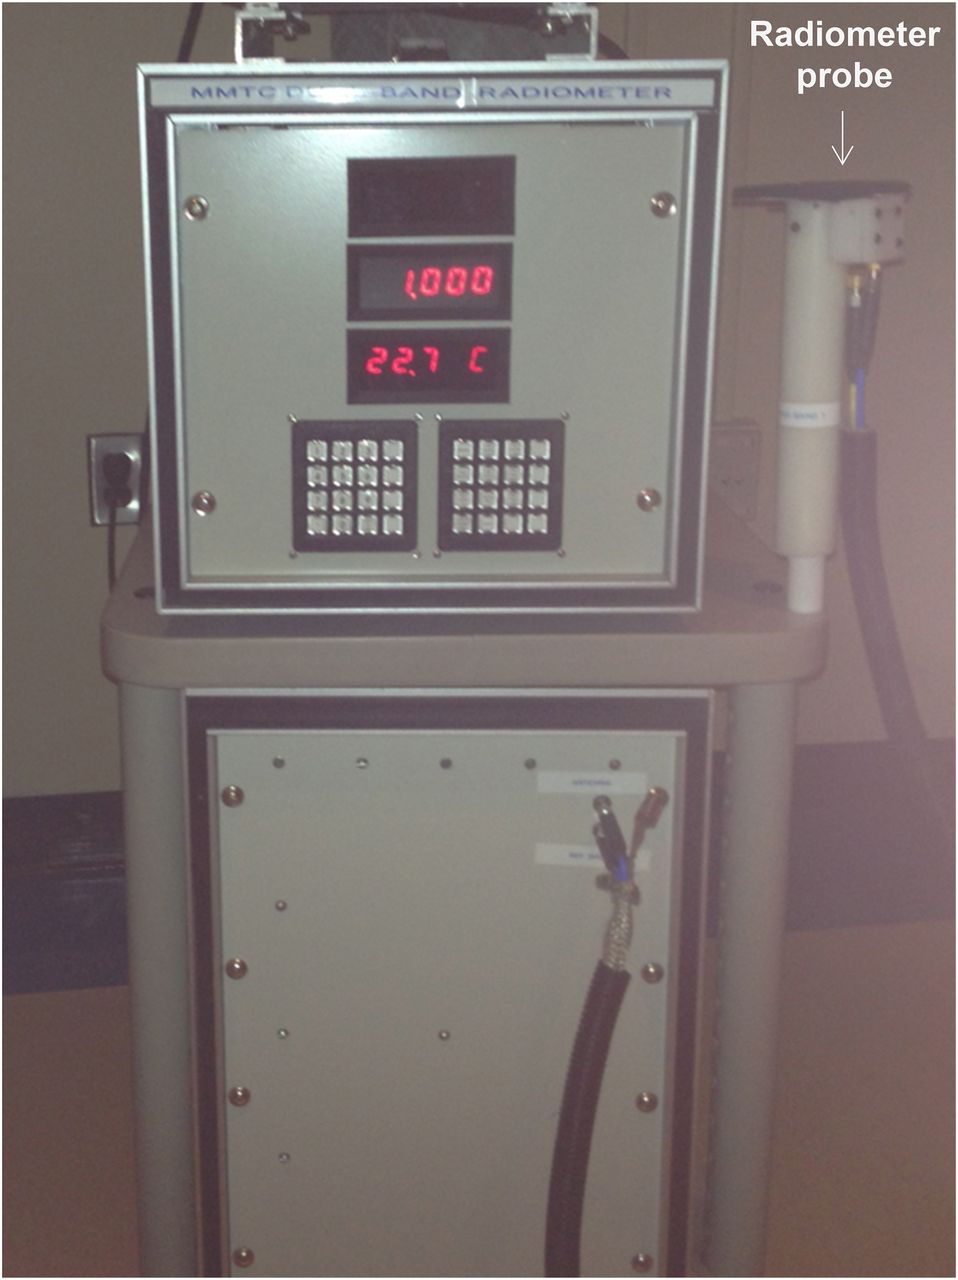
Microwave radiometry system used in this study.
All PET/CT images were acquired using a Discovery ST PET/CT system (GE Healthcare). Participants were instructed to fast for no less than 6 h before administration of 18F-FDG (PETNET Solutions Inc.). Intravenous injection of 18F-FDG (mean injected dose, 258.4 ± 36.4 MBq) was followed by an uptake period of approximately 60 min.
All participants first underwent a BAT maximization protocol followed immediately by whole-body 18F-FDG PET/CT imaging (Fig. 2). Radiometry data were collected from about 5 min before the start of maximization until the start of PET imaging. Those participants showing active BAT on PET/CT after maximization were invited back for an additional session during which a BAT minimization protocol was conducted followed immediately by whole-body 18F-FDG PET/CT imaging. Again, radiometry data were collected from about 5 min before the start of maximization until the start of PET imaging. The maximization and minimization protocols were conducted at least 7 d apart.

BAT maximization (A) and minimization (B) protocols. During maximization, each participant was exposed to cold for about 2 h before PET/CT imaging. Minimization protocol was organized in same way, with 20-mg dose of propranolol replacing start of cold exposure. MRAD = microwave radiometry.
The maximization protocol used in this study was based on a method described previously by Saito et al. and consisted of cold stimulation in the form of having the participants sit in a cooled room (18.1°C–20.0°C) and then intermittently place their feet on a block of ice (4 min on the ice followed by 1 min of rest) (4). The block was covered with a disposable blue paper pad so that the skin did not make direct contact with the ice. Participants wore a hospital gown and thin cotton hospital pants. The cold stimulation went on for a target of 1 h until the administration of 18F-FDG and continued during the 18F-FDG uptake period of about 1 h (i.e., approximately 2 h total of cold stimulation). A primary goal of this protocol was to minimize shivering, which could potentially confound the radiometry and PET/CT results. To that end, the participants were clinically monitored throughout the session for signs of shivering. If shivering was detected by the researcher or reported by the participant, the cooling was modified by reducing the amount of time the participant’s feet were on the ice until shivering ceased. Cold stimulation did not continue during PET/CT imaging. In the minimization protocol, fasting participants were seated in a warm room (24°C–28°C) and given a 20-mg dose of the β-blocker propranolol. They were in this room for the same period as during the maximization protocol, wore similar clothing, but were given a warm blanket. The participants were injected with 18F-FDG after 60 min of warming.
Systematic collection of radiometry data was performed beginning 5 min before the start of the maximization or minimization protocol and continued until the start of PET/CT imaging. A grid of 15–20 points was drawn on the participant’s upper body (Fig. 3 provides an example of the pattern used), and a photograph was taken for comparison with PET/CT images and so the grid could be replicated during subsequent sessions. Beginning every 5 min, radiometry data were collected by placing the device probe on each grid point until the signal stabilized (∼3 s). The result was then recorded, and the probe was moved to the next grid point. The probe was an approximately 0.5-m-long by 0.05-m-wide handheld cylinder with the detector attached to one end. Two researchers were always present for this procedure, with one researcher systematically holding the radiometry probe over the prespecified grid points in a consistent order and the other recording the results. The researcher assigned to maneuver the probe was always masked to the radiometry result.
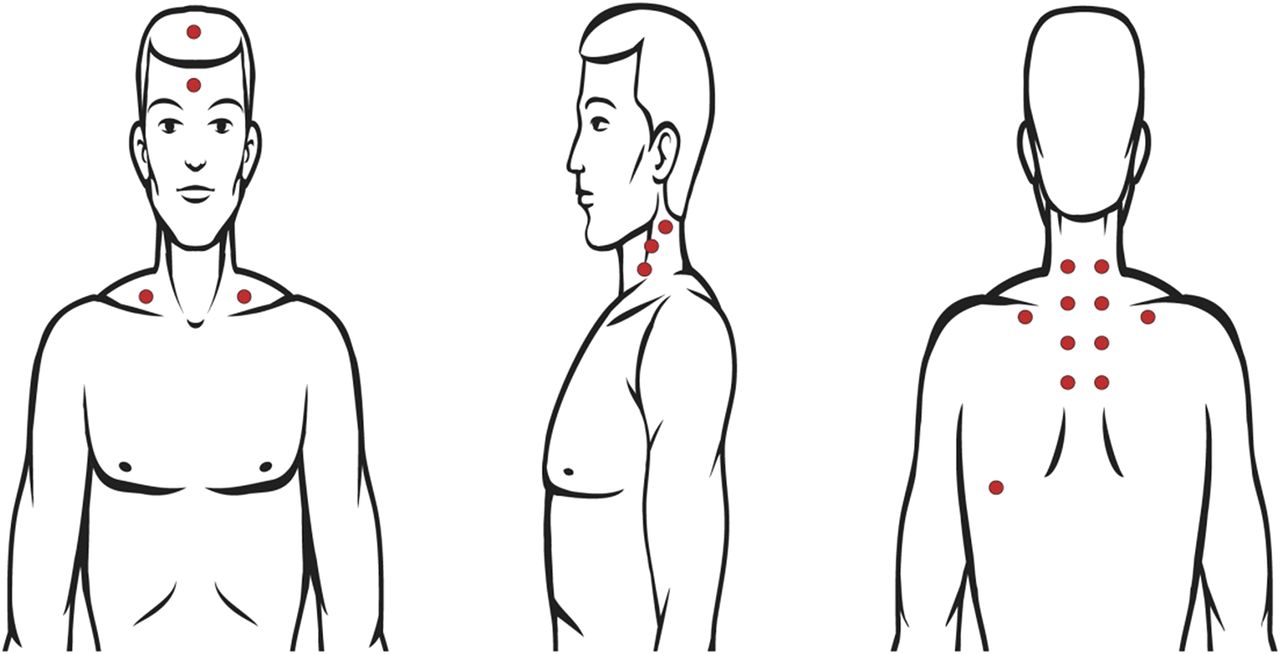
Diagram showing representative points at which radiometry data were collected. Surgical marker was used to draw sets of collection points, including multiple points on both sides of neck. Same grid was drawn during both maximization and minimization protocols, and photograph was taken for comparison with PET/CT images.
Radiometry and PET/CT Image Analysis
A single board-certified nuclear medicine physician used a clinical imaging workstation (Mirada XD3; Mirada Medical) to determine SUVs and to qualitatively analyze the PET/CT images. Areas expected to contain activated BAT were identified, and SUV (adjusted for lean body mass) was determined. A value of 1.2 or greater was used as the cutoff to identify active BAT. The qualitative analysis consisted of comparing the PET/CT image with the photograph of the grid drawn on each participant. A determination was then made as to whether each grid point on the surface of the skin was positioned over an area of active BAT seen on the PET/CT image. Each grid point was given a binary result of either positive or negative for position over areas of active BAT. Positive grid points were then compared with negative grid points within each subject. The grid points were also compared between the maximization and minimization studies.
Statistical Considerations
Paired and unpaired t tests were applied, as well as the Fisher exact test. Receiver-operating-characteristic analysis was applied to absolute radiometry values, using 18F-FDG PET/CT as the gold standard, and a sensitivity and specificity report was generated. In all analyses, a P value of less than 0.05 was considered statistically significant. Descriptive statistics were calculated using Microsoft Excel, and further analyses were performed with Prism (version 4.0; GraphPad Software).
RESULTS
Nineteen participants were prospectively enrolled between March 2012 and March 2013 at the Johns Hopkins medical campus in Baltimore, MD (latitude, 39.296° north; longitude, 76.592° west). The participant characteristics are described in Table 1. All participants underwent the maximization protocol followed by PET/CT imaging. Eight participants did not exhibit BAT activity qualitatively on PET/CT and subsequently did not undergo the follow-up minimization protocol. For the 11 remaining participants, the median and range between the maximization and minimization studies was 20 d and 7–42 d, respectively. Shivering was observed or reported in 4 of 11 BAT-positive participants and was then minimized or eliminated in all 4 participants using the modified cooling protocol. All sessions were performed during months with cooler temperatures (i.e., November–May), with the exception of one performed in August, which did not result in activated BAT using the maximization protocol. The mean outdoor temperature was 7.7°C during months in which BAT was successfully activated and 9.9°C during months in which BAT was not successfully activated (P = 0.587).
Participant Characteristics
BAT activity was not visualized on 18F-FDG PET/CT in participants undergoing the minimization protocol. Figure 4 shows a representative pair of images displaying extensive BAT activation after maximization and absence of BAT activity after minimization.
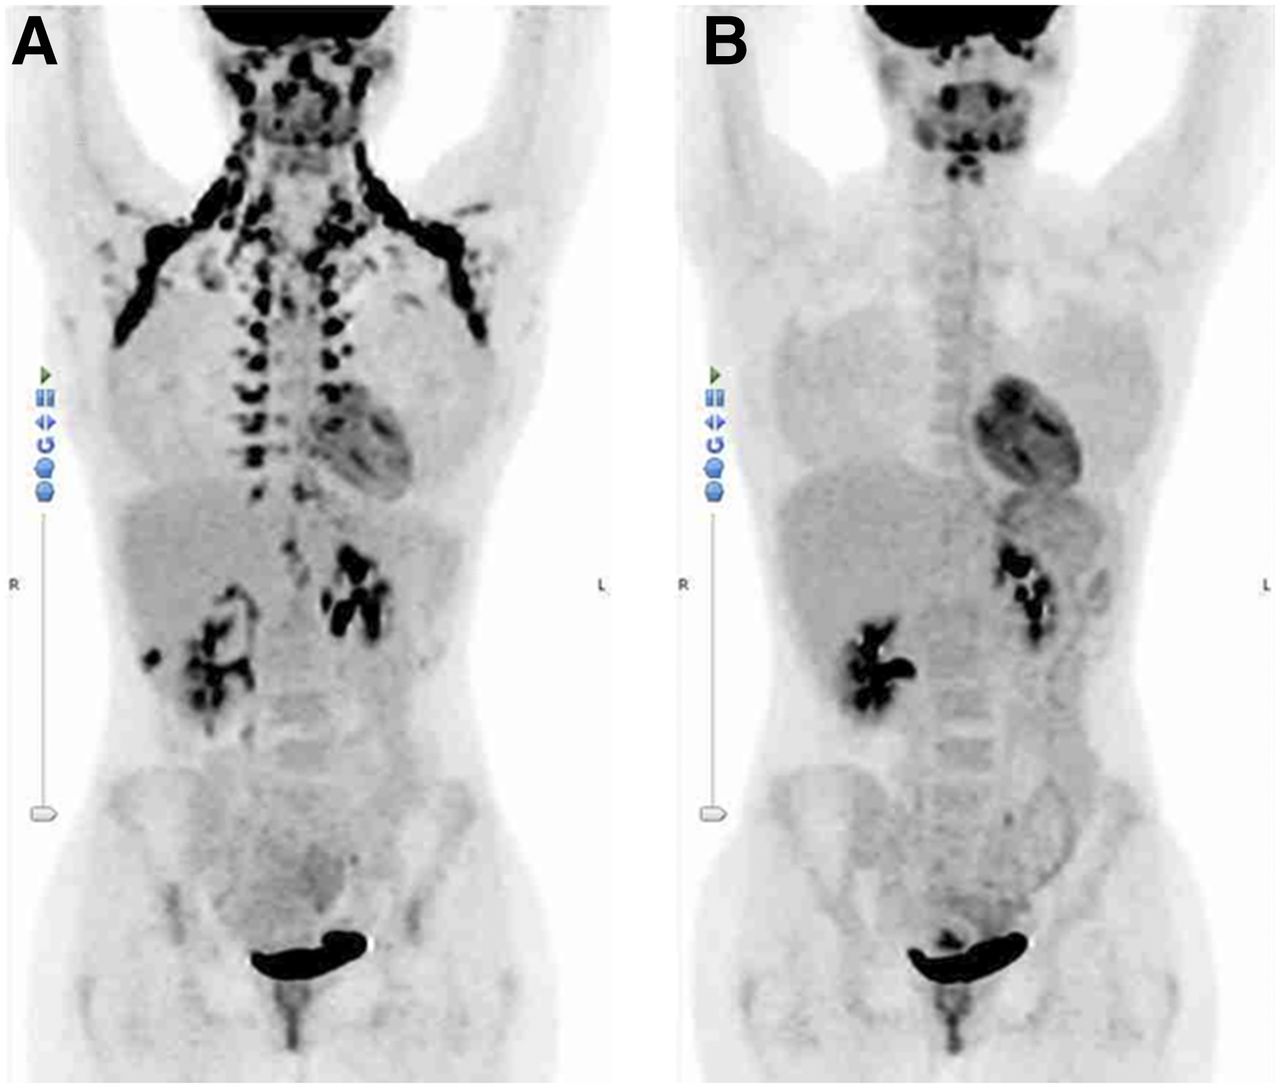
Representative BAT maximization (A) and minimization (B) 18F-FDG PET images (anterior maximum-intensity projections). Extensive BAT activity is seen after maximization, but no activity is seen after minimization 8 d later. Normal activity in brain, salivary glands, heart, and bladder is consistent between the two images.
Mean radiometry temperature measurements at all prespecified grid locations were consistently lower during maximization than during minimization in the 11 BAT-positive participants. The mean radiometry value during maximization and minimization was 32.8°C and 35.6°C, respectively (P = 0.005), in these 11 participants. On paired t testing, oral body temperature was found to differ significantly between the 2 protocols, with a mean of 97.7°F (36.5°C) during maximization and 98.0°F (36.7°C) during minimization (P = 0.047).
By comparison of PET/CT images obtained after maximization with the subject-specific diagram of points where radiometry data were collected (Fig. 3), each radiometry collection point was designated as either active or inactive by an experienced nuclear medicine physician. The number of active and inactive points varied among subjects. The median number of active points was 8, with a range of 6–13, whereas the median number of inactive points was 11, with a range of 6–15. The mean radiometry result collected during maximization was 33.2°C ± 1.5°C at points designated as active and 32.7°C ± 1.3°C at points designated as inactive (P < 0.01). During minimization, the mean radiometry result was 35.7°C ± 4.5°C measured at active points, essentially identical to the 35.6°C ± 4.8°C measured at inactive points (P = NS; designation of active or inactive determined during maximization protocol).
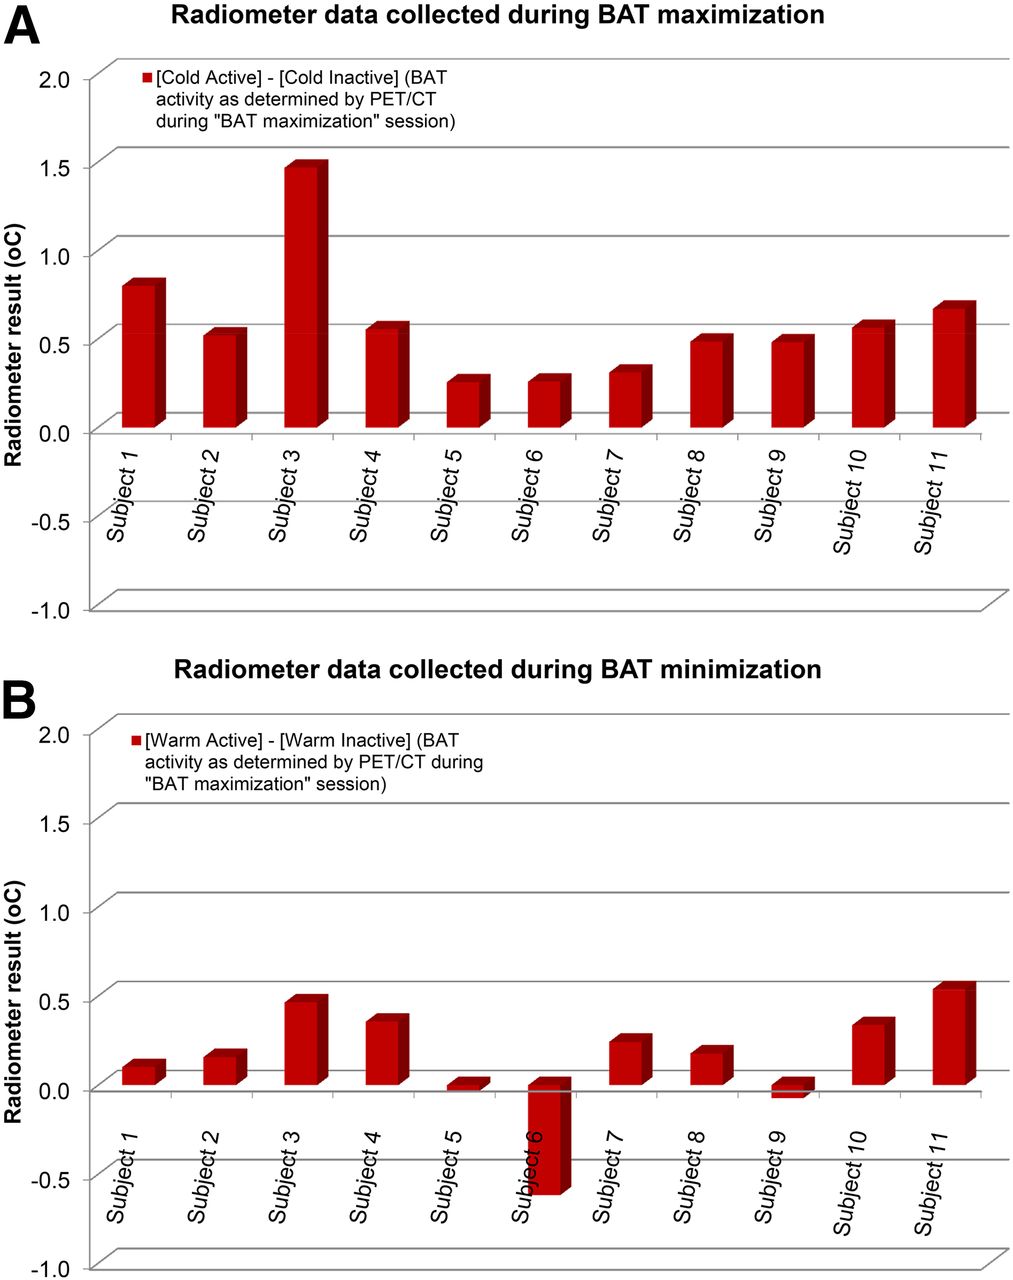
When individual subjects were considered separately, radiometry measurements during maximization were significantly greater over areas of active BAT (as determined by PET/CT) than over areas not exhibiting BAT activity in 10 of 11 subjects (Fig. 5). This difference lessened during minimization: 7 of 11 participants showed an insignificant difference between the same set of points. These frequencies were compared using the Fisher exact test, which indicated a significant difference between the maximization and minimization results (P = 0.012). The area under the receiver-operating-characteristic curve for difference between maximization and minimization studies at each data collection point was 0.88 (P = 0.003). At a difference cutoff of 0.48, sensitivity and specificity were 72.7% and 90.9%, respectively (Fig. 6).

Comparison of radiometry measurements between BAT maximization (A) and minimization (B) studies. Mean measurements at data collection points over active BAT differ significantly from those over inactive BAT during maximization but not during minimization. Same data collection points were measured in both studies.

Receiver-operating-characteristic curve. Using 18F-FDG PET/CT as gold standard, area under curve was 0.88 (P = 0.003). At difference cutoff of 0.48 (i.e., difference between BAT maximization and minimization protocols at each data collection point), radiometry sensitivity and specificity for detecting activated BAT were 72.7% and 90.9%, respectively, and likelihood ratio was 8.0.
DISCUSSION
The most commonly used technique for imaging BAT is currently 18F-FDG PET/CT. Though this modality has been shown effective at imaging BAT, its use is limited by the associated cost and radiation exposure (19). Microwave radiometry is a noninvasive, low-cost method that may be useful for the detection of activated BAT. The current study is, to our knowledge, the first to test the feasibility of detecting activated BAT in human subjects using a radiometry system.
Using a cold-exposure BAT maximization protocol previously described by Saito et al. (4), BAT was activated in 11 of 19 healthy subjects. These 11 subjects subsequently underwent a BAT minimization protocol during which BAT activity was reduced completely in all subjects using a warm room and a low dose of propranolol, which has been shown to greatly reduce BAT activity (20). Radiometry and 18F-FDG PET/CT were both performed for each of the two protocols.
On the basis of the 18F-FDG PET/CT images acquired during maximization, each point at which radiometry data were collected was classified as active or inactive (active points being those above areas of active BAT). The same points were compared during maximization and minimization. During maximization, the mean radiometry temperature of active points was modestly, but significantly, higher than the mean radiometry temperature of inactive points. The mean difference in temperature between these points was insignificant during minimization. This finding is consistent with the temperature increase detected over sites of activated BAT by the microwave radiometer.
The temperature of BAT has been studied indirectly in humans using temperature probes attached to the surface of the skin (8,21). van der Lans et al. (8) used a cooled room to activate BAT and then compared supraclavicular surface temperature with the surface temperature of surrounding areas (i.e., the head and chest). Activation of BAT was then verified using PET/CT. During exposure to cold, the mean supraclavicular temperature was 1.3°C warmer than the surrounding areas. Similarly, in our study, areas of activated BAT were compared with surrounding tissue, and the mean difference in temperature was 0.58°C. During minimization, the same sites differed by only 0.15°C. This difference is comparable to differences found using infrared thermography. After a 2-h cooling procedure, Jang et al. found mean supraclavicular temperatures that were higher in BAT-positive volunteers than in those who were BAT-negative (1.0°C over the left supraclavicular fossae and 0.6°C over the right supraclavicular fossae), though these differences were not statistically significant (11). Subjects with activated BAT were found by Gatidis et al. to have significantly higher mean supraclavicular fossa skin temperatures than those without activated BAT (35.0°C ± 0.5°C vs. 34.6°C ± 0.5°C, respectively) (10). Note that the radiometry system is designed to detect the temperature of deeper tissues than can be detected by surface temperature assessment. The location of BAT in relation to major blood vessels is a possible confounding factor in the temperature comparison. Although the radiologist analyzing the PET/CT images and radiometry data was certainly aware of the location of BAT relative to large blood vessels, there is no way to be sure that a fraction of the temperature detected by this early-generation radiometer did not arise from blood vessels.
Because of the design of the radiometer, human factors could contribute to measurement variability. To obtain consistent results, the probe needed to be held at the same angle at each data collection point, a requirement that is technically demanding. A change in the angle of the probe could result in collection of microwave radiation from different underlying tissues. In addition, the device is susceptible to interference from outside sources emitting microwave radiation in the same range in which data were collected. This potential confounding issue was addressed by choosing a range in which little other radiation should be emitting and by calibrating the device before every use. Despite these precautions, interference may have occurred. Methods to minimize environmental interference may warrant further study.
Another issue was the limited number of data points able to be collected. Since the device required that a researcher hold the probe at each site and wait for the signal to settle, only about 20 data points could be collected once every 5 min. A significant increase in the number of data points could help verify the BAT temperature signal. A substantial design improvement would be a wearable system that uses multiple probes (i.e., an array of several radiometer detectors) and collects data continuously and passively. This type of wearable system would need to overcome specific obstacles such as movement of the subject and potential interference from a constantly changing background. Movement issues could be partially overcome by using an adhesive and placing the probes (which can be fabricated in relatively small dimensions) away from joints. Various fabrics are available that offer electromagnetic shielding and could be used to cover the probes and minimize background interference.
An added benefit of this wearable system would be the ability to collect radiometry data over an extended period. BAT activity is thought to vary considerably throughout the day depending on a variety of factors. Unfortunately, modalities such as 18F-FDG PET/CT are capable of showing the amount of activity only during the short time when the subject is undergoing the imaging study. A technique able to provide information on BAT activity over a longer time would significantly improve the understanding of BAT dynamics.
A challenge in measuring BAT activity in our study was the difference in resolution between the microwave radiometer detector and the PET scanner. The resolution of the microwave radiometer used in our study was much larger than the resolution of a modern PET scanner. Thus, areas without BAT signal were likely included in the signal obtained from the radiometry device and, in some instances, from the PET scanner. In addition, the PET and radiometry data acquisitions were sequential and not simultaneously performed, allowing for the potential for minor misalignments in the areas interrogated by the two methods. In future studies, to optimize microwave radiometry, multiple smaller, high-resolution detectors—as well as a precise alignment system to ensure that the same areas are assessed by PET and radiometry—would be relevant. We believe that with such a system, more reliable collection and interpretation of the inherently continuous SUV and radiometry data may inform more refined future studies linking these techniques.
Previous studies either have not included women or controlled for the thermoregulatory responses associated with the menstrual cycle (22,23). A limitation of the current study was that most of the subjects were female and the menstrual cycle was not monitored. However, the primary question was whether the radiometry device could detect a difference between areas of active BAT and inactive or absent BAT. Because the effect of the menstrual cycle on thermoregulatory response should not vary substantially over a single imaging session (i.e., 3 h), there should not have been a significant impact on the primary aims of the study, though the baseline temperatures of our participants may have been affected.
Use of a different cooling protocol may also help improve the performance of the microwave radiometer. The cooling protocol in the current study, based on a previously described method, has been suggested to be less effective than some other techniques (19). The individualized cooling method used by Vosselman et al. may result in more consistently activated BAT, which may have yielded stronger signals than in the current study (24). This individualized protocol involves precise cooling of a small room to a temperature usually close to 16.0°C, which should result in a lower temperature at the surface of the skin and may improve the performance of the radiometry system (25).
CONCLUSION
BAT has emerged as a potential target organ for the prevention and treatment of diabetes and obesity. To evaluate interventions aimed at modulating BAT activity or mass, it is important to have imaging methods capable of accurately assessing these parameters, ideally without the use of ionizing radiation so that sequential and longitudinal studies can be performed. In the current study, we have demonstrated the feasibility of microwave radiometry in the assessment of BAT activation in lean, healthy participants. This modality is noninvasive and potentially inexpensive, does not involve ionizing radiation, and, with significant improvements, may become useful for evaluating the presence, activity, and response of BAT to various interventions.
DISCLOSURE
This project was funded by the National Institute of Diabetes and Digestive and Kidney Diseases through grant IR210K090799. No other potential conflict of interest relevant to this article was reported.
Footnotes
Published online Feb. 9, 2018.
- © 2018 by the Society of Nuclear Medicine and Molecular Imaging.
REFERENCES
- Received for publication October 26, 2017.
- Accepted for publication December 20, 2017.


Jump to section
Related Articles
Cited By...
- No citing articles found.