


Abstract
PET radioligands targeted to translocator protein (TSPO) offer a highly sensitive and specific means of imaging joint inflammation in rheumatoid arthritis (RA). Through high expression of TSPO on activated macrophages, TSPO PET has been widely reported in several studies of RA as a means of imaging synovial macrophages in vivo. However, this premise does not take into account the ubiquitous expression of TSPO. This study aimed to investigate TSPO expression in major cellular constituents of RA pannus—monocytes, macrophages, fibroblastlike synoviocytes (FLS cells), and CD4-positive (CD4+) T lymphocytes (T cells)—to more accurately interpret TSPO PET signal from RA synovium. Methods: Three RA patients and 3 healthy volunteers underwent PET of both knees using the TSPO radioligand 11C-PBR28. Through 3H-PBR28 autoradiography and immunostaining of synovial tissue in 6 RA patients and 6 healthy volunteers, cellular expression of TSPO in synovial tissue was evaluated. TSPO messenger RNA expression and 3H-PBR28 radioligand binding was assessed using in vitro monocytes, macrophages, FLS cells, and CD4+ T cells. Results: 11C-PBR28 PET signal was significantly higher in RA joints than in healthy joints (average SUV, 0.82 ± 0.12 vs. 0.03 ± 0.004; P < 0.01). Further, 3H-PBR28–specific binding in synovial tissue was approximately 10-fold higher in RA patients than in healthy controls. Immunofluorescence revealed TSPO expression on macrophages, FLS cells, and CD4+ T cells. The in vitro study demonstrated the highest TSPO messenger RNA expression and 3H-PBR28–specific binding in activated FLS cells, nonactivated M0 macrophages, and activated M2 reparative macrophages, with the least TSPO expression being in activated and nonactivated CD4+ T cells. Conclusion: To our knowledge, this study was the first evaluation of cellular TSPO expression in synovium, with the highest TSPO expression and PBR28 binding being found on activated synovial FLS cells and M2 macrophages. TSPO-targeted PET may therefore have a unique sensitivity in detecting FLS cells and macrophage-predominant inflammation in RA, with potential utility for assessing treatment response in trials using novel FLS-cell–targeted therapies.
Rheumatoid arthritis (RA) is a common inflammatory disease affecting up to 1% of the population (1). Imaging is recognized as a useful tool to aid early diagnosis of RA, thus preventing permanent joint damage and disability (2,3). Musculoskeletal imaging is also used to assess response to treatment for individual patients in clinical practice (4) and to better ascertain in clinical trials which experimental therapy is sufficiently effective to progress to use in clinical practice. Through a unique ability to image a desired molecular target in vivo, PET has potential to be a highly sensitive and specific imaging tool for the detection and quantification of synovitis in RA.
The mitochondrial membrane translocator protein (TSPO), as yet of uncertain function, is reportedly highly expressed on activated macrophages (5,6). Macrophages are well established to have a key role in RA pathogenesis, with synovial sublining staining for these cells known to correlate with disease activity (7,8) and joint destruction (9,10). To date, the TSPO-targeted PET radioligand 11C-PK11195 has been used as a purported imaging tool for synovial macrophages, capable of detecting and quantifying not only clinically apparent RA synovitis (11) but also subclinical synovitis in patients whose RA is in clinical remission (12).
Inflamed synovium in RA consists of a pannus made up of multiple cells, 30%–50% of which consist of macrophages, activated stromal cells (fibroblastlike synoviocytes [FLS cells]), and CD4-positive (CD4+) T lymphocytes (T cells) (13–15). Because TSPO is ubiquitously expressed (5), it cannot be assumed that the TSPO PET signal in RA synovium is due solely to the presence of macrophages. Studies comparing TSPO expression in different RA-pannus cell types are lacking. Hence, major cellular contributors to the TSPO PET signal in RA pannus remain unclear.
The TSPO radioligand 11C-PBR28 is known to have a TSPO signal superior to that of the first-generation TSPO ligand 11C-PK11195 (16,17), whose use is limited by a high background signal (18). Here, through 11C-PBR28 PET/CT imaging of RA patients and healthy volunteers, we provide evidence that 11C-PBR28 signal reflects the presence of RA pannus. Using 3H-PBR28 synovial tissue autoradiography and corresponding histologic studies, we investigate whether 3H-PBR28 binding reflects TSPO expression in synovium and which cells in synovial tissue express TSPO. Real-time polymerase chain reaction and radioligand binding studies provide quantitative evidence of TSPO expression in major cellular components of pannus at the messenger RNA (mRNA) and protein levels, examining TSPO expression in unstimulated and activated CD4+ T cells, monocytes, macrophages, and FLS cells. Given the current uncertainty about the macrophage phenotypes in RA synovium, macrophages at both ends of the spectrum (proinflammatory [M1] and reparative [M2] (19)) were assessed in this work.
MATERIALS AND METHODS
Patient Recruitment
Ethical approval was granted by the West London and Gene Therapy Advisory Committee Research Ethics Committee (reference no. 15/LO/0013). All participants gave written informed consent. Three patients (2 male, 1 female; age range, 40–54 y) with established RA (American College of Radiology criteria (20)) and clinical evidence of synovitis in one or both knees, along with 3 healthy controls (all male; age range, 38–65 y) with no history of arthritis, underwent 11C-PBR28 PET/CT of both knees. Previous knee surgery was an exclusion criterion. Supplemental Table 1 (available at http://jnm.snmjournals.org) details the ages and medications of RA patients undergoing imaging.
rs6971 Genotyping
Although second-generation TSPO radioligands such as 11C-PBR28 offer a specific signal and a robust quantification (16), target-binding affinity is affected by a single-nucleotide polymorphism in the TSPO gene (rs6971) (21). To ensure that the results from in vivo imaging, autoradiography, and radioligand binding were comparable among donors, only those carrying 2 copies of the common allele (high-affinity binders) were included in this work. Genotyping was performed as previously described using peripheral whole blood (21).
11C-PBR28 PET/CT
11C-PBR28 PET/CT was performed at the Imanova Centre for Academic Imaging Sciences, London, U.K. 11C-PBR28 radioligand synthesis and quality checks were performed as described previously (18). Approximately 400 MBq of 11C-PBR28 were administered as a peripheral intravenous bolus over 20 s at the start of a 90-min dynamic PET acquisition (Biograph 6 PET/CT scanner; Siemens) of both knees for RA participants, with static scanning of both knees at 50 min after radioligand administration for healthy controls.
PET data were reconstructed using filtered backprojection, correcting for attenuation and scatter. Regions of interest were defined by outlining the anatomic location of the synovium using CT as a guide. Regions of interest were applied to the 11C-PBR28 data to generate mean voxel radioactivity for the full duration of the scan. Time–activity curves for the full duration of the scan were corrected for radioactive decay and normalized for injected radioactivity. Semiquantitative SUVs for radioactivity over 50–70 min after radioligand injection were calculated by dividing radioactivity in the region of interest by radioactivity of the ligand injected per kilogram of patient body weight (22).
Synovial Tissue Acquisition
Synovial knee tissue was obtained from ultrasound-guided biopsy of 3 RA patients undergoing 11C-PBR28 of both knees, as previously described (23). Three further RA patients undergoing knee joint replacement surgery, who did not undergo 11C-PBR28 of the knees, also provided synovial tissue. Healthy control synovial tissue was provided from patients undergoing knee arthroscopy for ligamentous knee injury. Specimens from each donor were placed en bloc in a Leica Optical Coherence Tomography system and snap-frozen in isopentane (−70°C) before sectioning. All tissue was from high-affinity binders. Supplemental Table 1 details the ages and medications of RA patients providing synovial tissue.
Sectioning
Frozen blocks were serially sectioned using a cryostat microtome (CM1900; Leica) across adjacent slides at a thickness of 10 μm for autoradiography, as described previously by Owen et al. (24). For immunostaining work, tissue was serially sectioned at a 5-μm thickness onto Leica X-tra adhesive slides. Sections were stored at −80°C until use. For autoradiography, tissue was used within 21 d of sectioning.
Autoradiography
Autoradiography binding was performed using protocols previously described (24) on sectioned synovial tissue under optimized experimental conditions as judged from in vitro 3H-PBR28 binding studies. At least 3 synovial tissue sections from each donor were placed on one slide. One synovial tissue section was considered a region of interest, and average values for each region of interest were converted to femtomoles of 3H-ligand/mg of wet tissue equivalent using the calibrated 3H-microscale standards. The mean specific-binding component of 3H-PBR28 in synovium was calculated by subtracting the average nonspecific binding from the total binding on tissue autoradiography of serial sections for each donor.
Immunohistochemistry and Immunofluorescence
Antibodies, dilutions used, and isotype-negative control images are detailed in Supplemental Table 2. For immunohistochemistry, sections were stained as described by Dakin et al. (25). Immunohistochemistry images were acquired on an inverted bright-field microscope using Axiovision software (Zeiss). Twelve images were acquired in a systematic manner at ×400 magnification with oil immersion by a single masked investigator. Images were analyzed using ImageJ software (National Institutes of Health), as described previously (26). For every sample, immunopositive staining was normalized to number of hematoxylin-counterstained nuclei within the field of view.
Costaining of TSPO with Other Cell Markers Using Immunofluorescence
For multiple-antibody immunofluorescence staining and image acquisition, protocols were modified as per Dakin et al. (25). To confirm cell type, 2 established cell markers were used for each cell type. For macrophages, the less macrophage-specific CD68 and the more synovial macrophage-specific CD163 were used (27); for FLS cells, CD55 (also known as decay accelerating factor) and podoplanin (gp38) were used (28), and for CD4+ T cells, CD3 and CD4 were used. The acquisition of immunofluorescence images is described in the supplemental materials.
In Vitro Cell Culture Studies
Monocytes were isolated from peripheral blood donor cones (National Blood Service) using density-dependent centrifugal elutriation, as previously described (29–31), to obtain fractions of 85% monocytes.
Monocytes were differentiated from macrophages using recombinant human macrophage colony–stimulating factor (100 ng/mL; Peprotech Inc., U.K.) at a concentration of 1 × 10⁶ monocytes/mL for 7 d (32), as previously described by Narayan et al. (33). Fluorescence-activated cell sorting was used to confirm that monocytes had been differentiated to monocyte-derived macrophages (34).
On day 7, macrophages were treated with lipopolysaccharide (10 ng/mL; Peprotech) and recombinant human γ-interferon (20 ng/mL; Peprotech) for 24 h to generate M1 macrophages. To generate M2 macrophages, cells were treated with interleukin (IL)-4 (20 ng/mL) for 24 h, as described in previous studies (32,35–37).
Lymphocytes were isolated through centrifugal elutriation as described above, generating fractions of 90% lymphocytes. CD4+ T cells were isolated from lymphocyte fractions using the positive-selection CD4+ T-Cell Isolation Kit (Miltenyi Biotec). CD4+ cells either were left unstimulated or were treated with phorbol 12-myristate 13-acetate (10 ng/mL) plus ionomycin (1 μg/mL) for 6 h (38).
FLS cells were isolated from arthroscopic biopsy of healthy human knee synovial tissue by processing the tissue as previously described (39). FLS cells were stimulated with tumor necrosis factor α (TNF-α; 10 ng/mL) or IL-1β (0 ng/mL) for 24 h or were left unstimulated.
Real-Time Quantitative Polymerase Chain Reaction
The methodology for RNA extraction from the cells, complementary DNA synthesis, and real-time quantitative polymerase chain reaction is described elsewhere (25). Two microliters of complementary DNA were used in a 10-μL volume with Fast SYBR Green Master Mix (Applied Biosystems) and diluted with validated primers (Invitrogen) for TSPO (forward: 5′-GCGGCCTGGCTAACTCCTGC-3′; reverse: 5′-AAAGCGGGAGCCCACGAAGC-3′) or the reference gene for human 18s (forward: 5′- GTAACCCGTTGAACCCCA-3′; reverse: 5′-CCATCCAATCGGTAGTAGCG-3′). TSPO mRNA data are shown normalized to 18s.
Radioligand Saturation Binding
The protocol for radioligand saturation binding has been described previously (24). Saturation analysis used 50 μg/mL aliquots of cell protein and 8 concentrations of 3H-PBR28 ranging from 0.1 to 100 nmol/L. The specific-binding component for 3H-PBR28 was defined by addition of unlabeled PK11195 (10 μmol/L). Each concentration was performed in triplicate. The maximum number of binding sites (fmol/mg of protein) and the dissociation constants (nmol/L) were determined using Prism 5.0 software (GraphPad Software Inc.). To calculate the average femtomoles of ligand per cell, the number of milligrams of protein from preparation of each cell pellet was multiplied by the maximum number of binding sites (fmol/mg).
Statistical Analysis
All data are presented as mean ± SE. Statistical analysis was undertaken using Prism 7 software. Normality was tested using a Kolmogorov–Smirnov test. The Mann–Whitney U test was used to compare in vivo 11C-PBR28 PET SUV signal, tissue autoradiography, and staining quantification between the healthy and RA groups. Pearson correlation was used to assess the relationship between specific binding of 3H-PBR28 and TSPO staining. For mRNA and radioligand binding data, 1-way ANOVA was performed, followed by the Bonferroni multiple-comparison test if more than 2 groups were being compared or the Student t test if 2 groups were being compared. P values of less than 0.05 were considered significant.
RESULTS
In Vivo 11C-PBR28 Signal in Joints
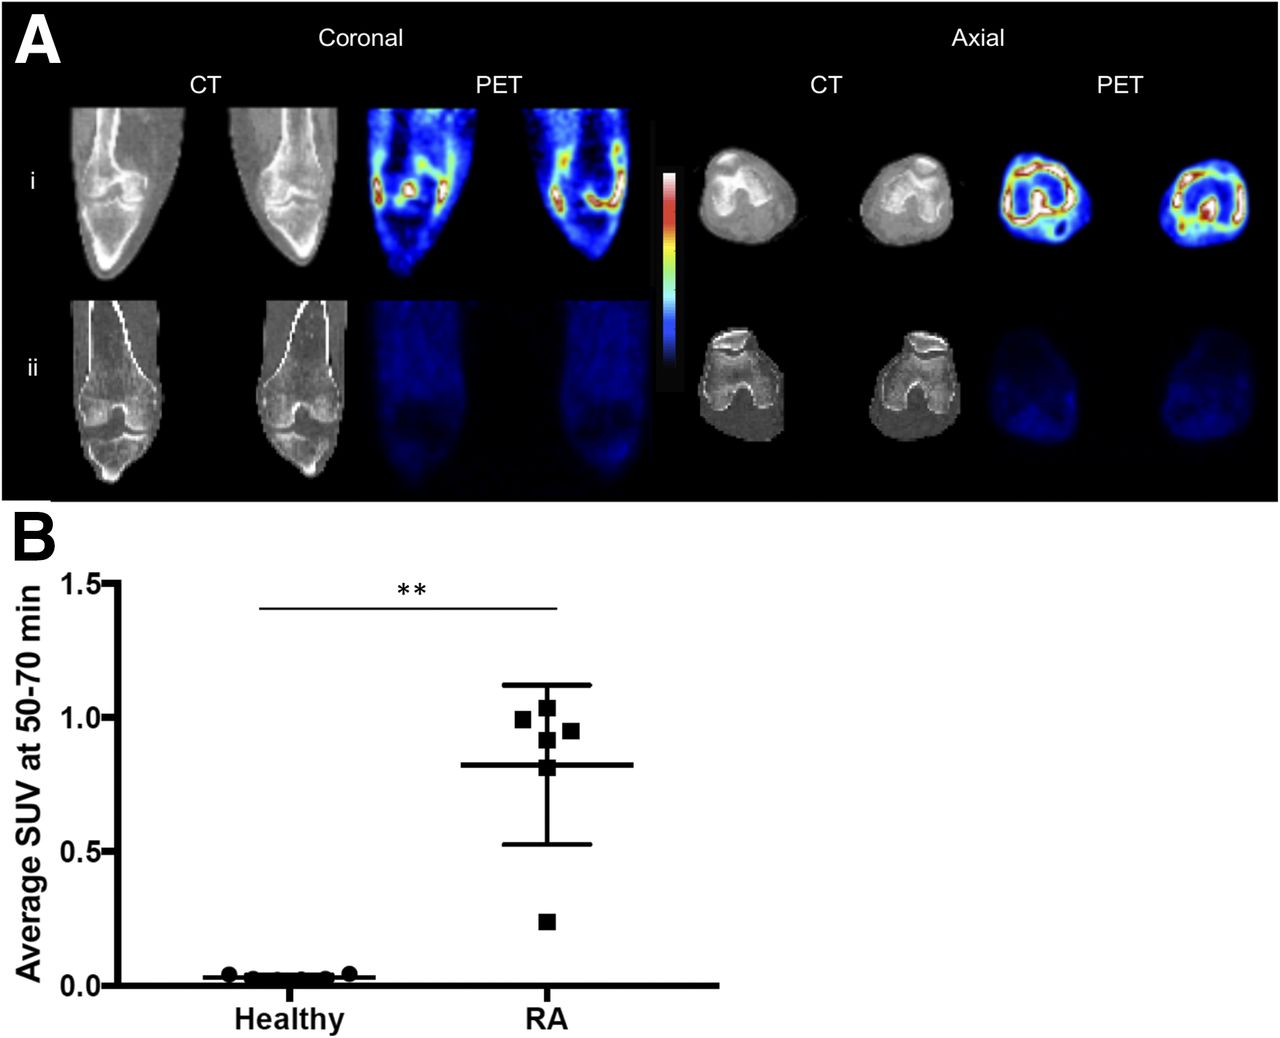
11C-PBR28 PET/CT demonstrated a significantly higher average SUV along the anatomic location of the synovium in the clinically inflamed knees of RA patients than in the normal knees of healthy controls (0.82 ± 0.12 vs. 0.03 ± 0.004, P < 0.01) (Fig. 1).

(A) CT and 11C-PBR28 PET SUV images of both knees in RA patient with clinical signs of synovitis (i) and healthy control (ii). Colorimetric scale indicates red as maximal SUV and blue as minimal. SUV was taken 50–70 min after radioligand administration. (B) 11C-PBR28 SUV of each knee in healthy controls and RA patients (n = 6 in each group). **P < 0.01 as assessed by Mann–Whitney U test.
3H-PBR28 Synovial Autoradiography and Relationship with Synovial Immunohistochemical TSPO Staining
Nonspecific binding was negligible in both RA and healthy tissue (Figs. 2B and 2C).

Autoradiography of synovial tissue. (A) Representative images of hematoxylin and eosin staining of synovial tissue (×40 magnification). (B and C) Nonspecific (B) and total (C) 3H-PBR28 binding for RA and healthy synovium at ×40 magnification. Colorimetric scale indicates red as maximal binding and blue as minimal. (D) Mean specific binding in synovial tissue from 6 healthy controls and 6 RA patients. **P < 0.01 as assessed by Mann–Whitney U test.
Specific binding of 3H-PBR28 was approximately 10-fold higher in RA synovial tissue than in healthy controls (1,264 ± 58.9 vs. 122.8 ± 22.5 fmol/mg) (Fig. 2D).
Serial sections of RA and healthy control synovial tissue used for autoradiography were immunohistochemically stained for TSPO (Fig. 3A). The average number of cells staining positively for TSPO on sections from each donor was calculated. The number of cells positive for TSPO was significantly higher in RA synovial tissue than in healthy synovial tissue (Fig. 3B). A positive correlation (r2 = 0.99, P < 0.001) was noted between specific binding of 3H-PBR28 and average number of TSPO-positive cells in serial sections of synovial tissue from RA donors (Fig. 3C).

Correlation between TSPO synovial tissue staining and 3H-PBR28 binding. (A) Immunohistochemical staining for TSPO (×200 magnification, scale bar = 50 μm). (B) Average number of TSPO-positive cells on serial sections of same 6 healthy control and same 6 RA synovial tissues as used for autoradiography. **P < 0.01 as assessed by Mann–Whitney U test. (C) Correlation between number of TSPO-positive cells in RA synovial tissue sections and average specific binding of 3H-PBR28 in same sections as assessed by Pearson correlation.
Immunofluorescence Studies
Immunofluorescence staining of synovial tissue showed coexpression of TSPO on cells expressing the macrophage markers CD68 and CD163 (Fig. 4A), the FLS-cell markers CD55 and podoplanin (Fig. 4B), and the T-cell markers CD3 and CD4 (Fig. 4C). This finding provides ex vivo evidence that TSPO is likely expressed on macrophages, fibroblasts, and CD4+ T cells in RA synovial tissue.
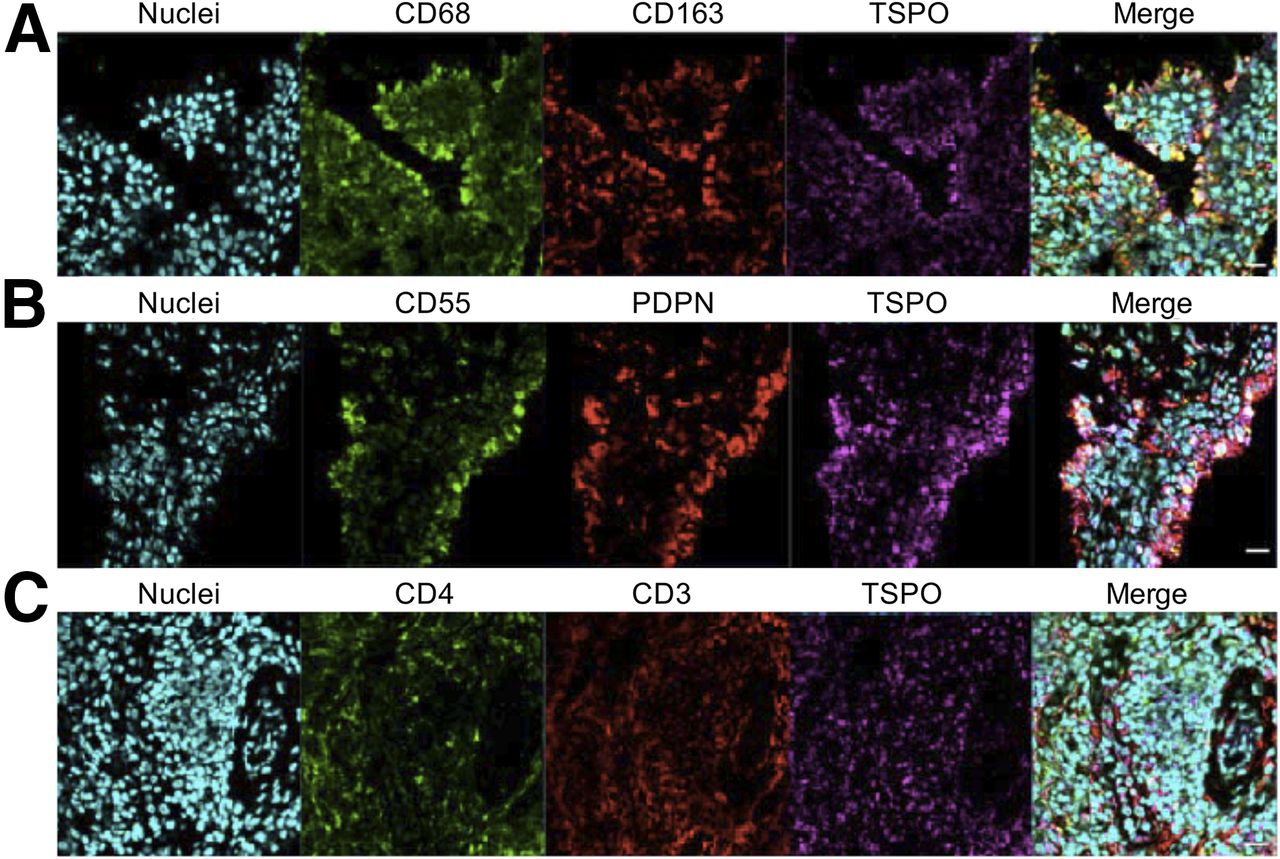
Representative confocal immunofluorescence images of RA synovial tissue demonstrating costaining of macrophage markers CD68, CD163, and TSPO (A); costaining of FLS-cell markers CD55, podoplanin (PDPN), and TSPO (B); and costaining of T-cell markers CD4, CD3, and TSPO (C). Nuclei were stained using POPO-1 (Invitrogen). (×400 magnification, scale bar = 20 μm.)
In Vitro Evidence of TSPO Expression in Cells of Human Pannus
In vitro studies were performed to quantify TSPO expression and 3H-PBR28 binding in major cell groups known to compose human pannus. The impact of cell activation on TSPO expression and 3H-PBR28 binding was also assessed.
As we previously described in detail (33), differentiation of monocytes to nonactivated macrophages (M0) significantly increased TSPO mRNA expression by a fold change of 60.7 ± 2.38 (P < 0.05). Likewise, 3H-PBR28 binding mirrored this significant increase, with specific binding of 1,004 ± 52.61 fmol/1 × 106 cells for monocytes increasing to 1,838 ± 45.37 fmol/1 × 106 cells for M0 macrophages (P < 0.01) (Fig. 5) (33). Additionally, we previously found (33) that activation of macrophages to an M2 phenotype using IL-4 did not significantly increase TSPO expression at the mRNA level—or 3H-PBR28 binding (Fig. 5) (33)—yet both TSPO mRNA expression and 3H-PBR28 binding were significantly downregulated on M1 macrophages to levels not statistically different from monocytes.
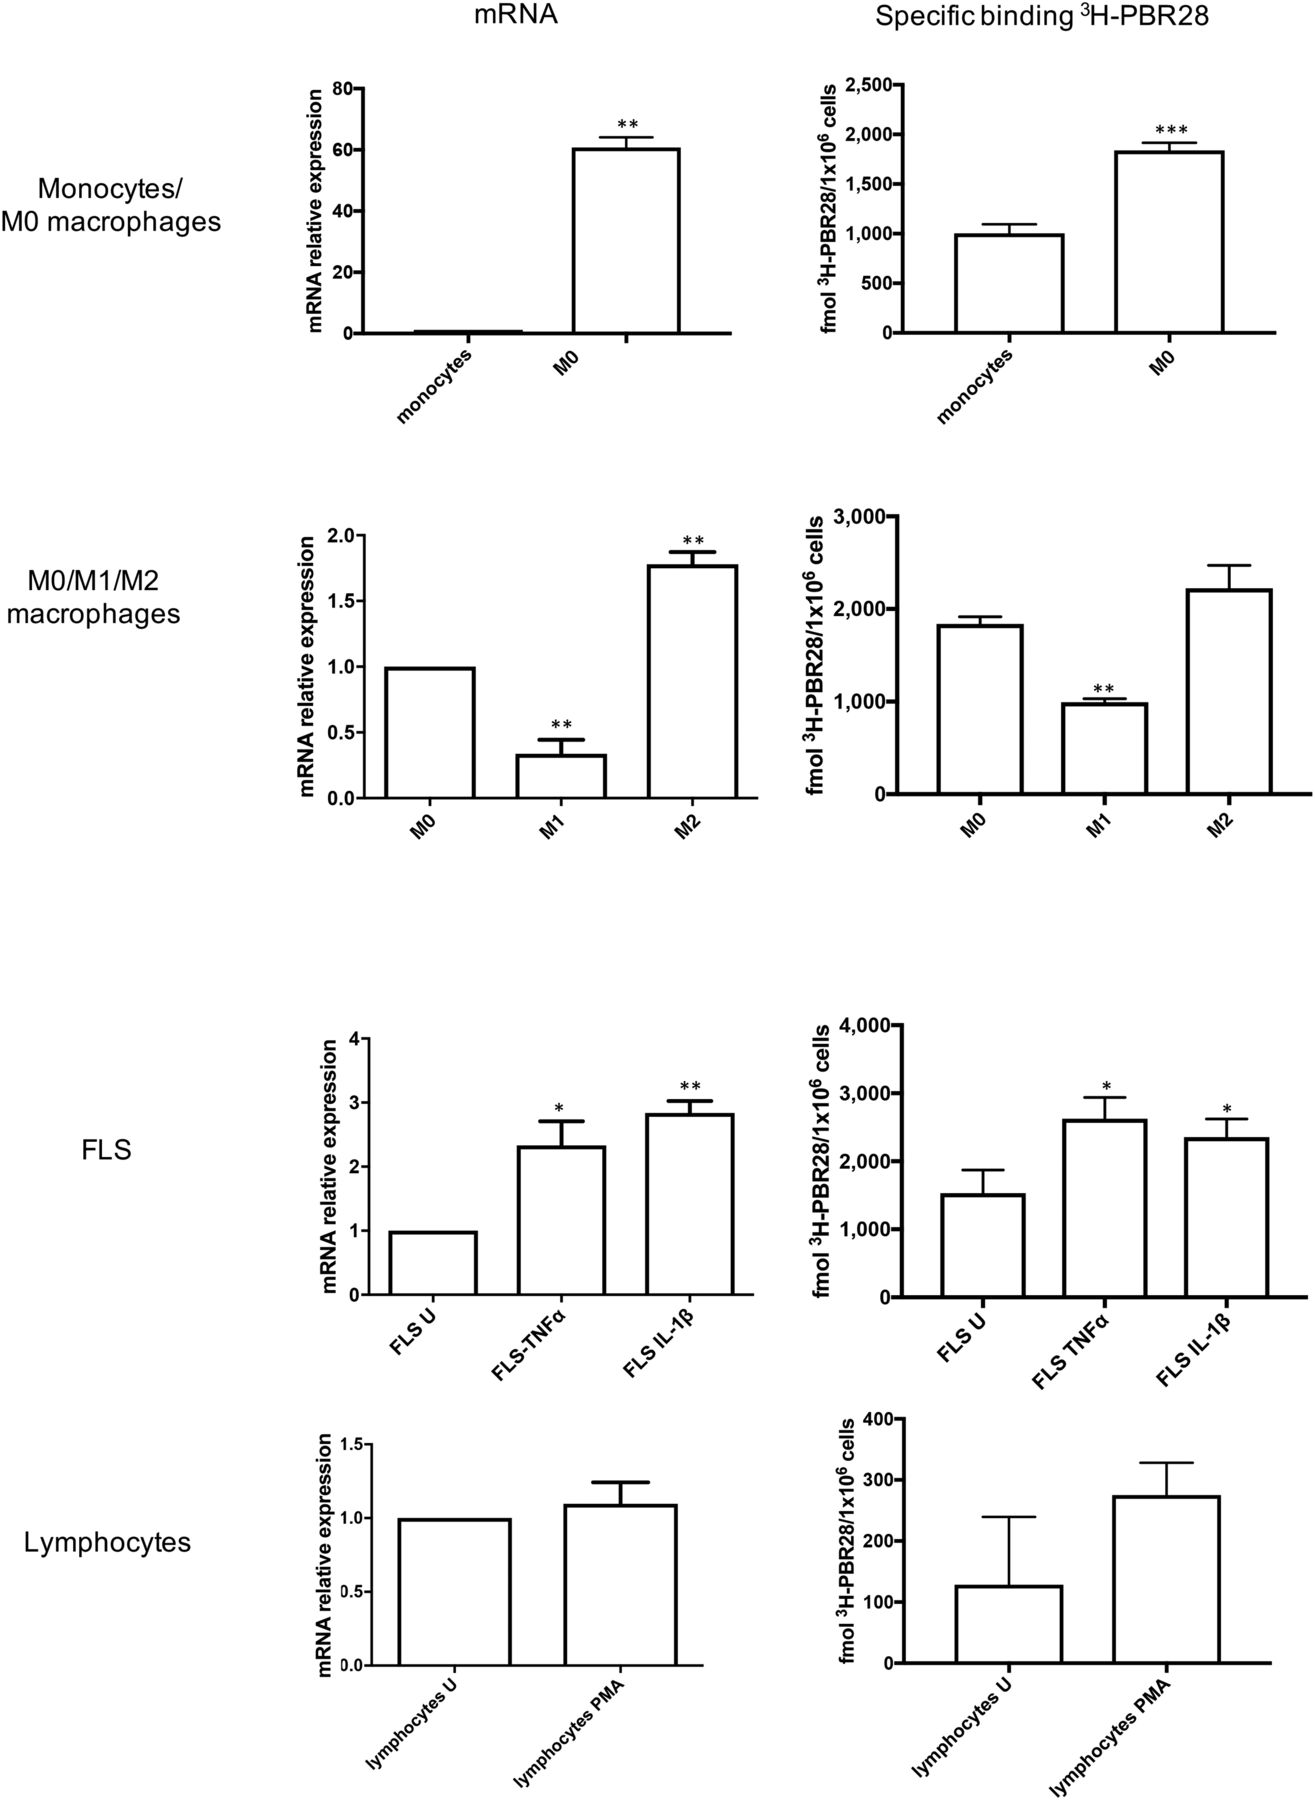
Mean fold change in TSPO mRNA expression (relative to unstimulated group) and mean specific binding of 3H-PBR28 in monocytes and M0 macrophages (first row); in M0, M1, and M2 macrophages (second row); in unstimulated (U) FLS cells, in FLS cells treated with TNF-α and IL-1β (third row); and in unstimulated CD4+ T cells and phorbol 12-myristate 13-acetate (PMA)–treated CD4+ T cells (fourth row). Data are mean ± SE for 4 independent experiments, with each being performed in triplicate. *P < 0.05. **P < 0.01. ***P < 0.001. P values were assessed by Student t test or 1-way ANOVA with Bonferroni multiple-comparison test.
The FLS-cell–activating cytokines TNF-α and IL-1β also upregulated TSPO on FLS cells; TSPO mRNA expression significantly increased by a fold change of 2.33 ± 0.37 on TNF-α stimulation (P < 0.05) and 2.84 ± 0.19 on IL-1β stimulation (P < 0.01), compared with unstimulated FLS cells. Likewise, specific binding of 3H-PBR28 significantly increased from 1,532 ± 196 fmol/1 × 106 cells for unstimulated FLS cells to 2,627 ± 180.4 fmol/1 × 106 cells for TNF-α–stimulated cells (P < 0.001) and 2,355 ± 153.4 fmol/1 × 106 cells for IL-1β–stimulated cells (P < 0.01) (Fig. 5).
In contrast, when CD4+ T cells were activated with phorbol 12-myristate 13-acetate and ionomycin, TSPO expression did not significantly increase (fold change in mRNA expression: 1.10 ± 0.15 vs. 1 for activated vs. nonactivated cells, P = 0.55), nor did 3H-PBR28 specific binding (275.2 ± 30.67 vs. 128.6 ± 64.08 fmol/1 × 106 cells for activated vs. nonactivated cells, P = 0.99) (Fig. 5).
TSPO mRNA expression (relative to mRNA expression in unstimulated CD4+ T cells) was compared among all cell types in both unstimulated and activated states (Fig. 6). The highest TSPO mRNA expression was seen in activated FLS cells (fold change: 73.82 ± 7.31 for activation with IL-1β and 62.75 ± 10.03 for activation with TNF-α) and in M2 and M0 macrophages (fold change: 60.69 ± 2.38 vs. 46.04 ± 5.19) (Fig. 6).
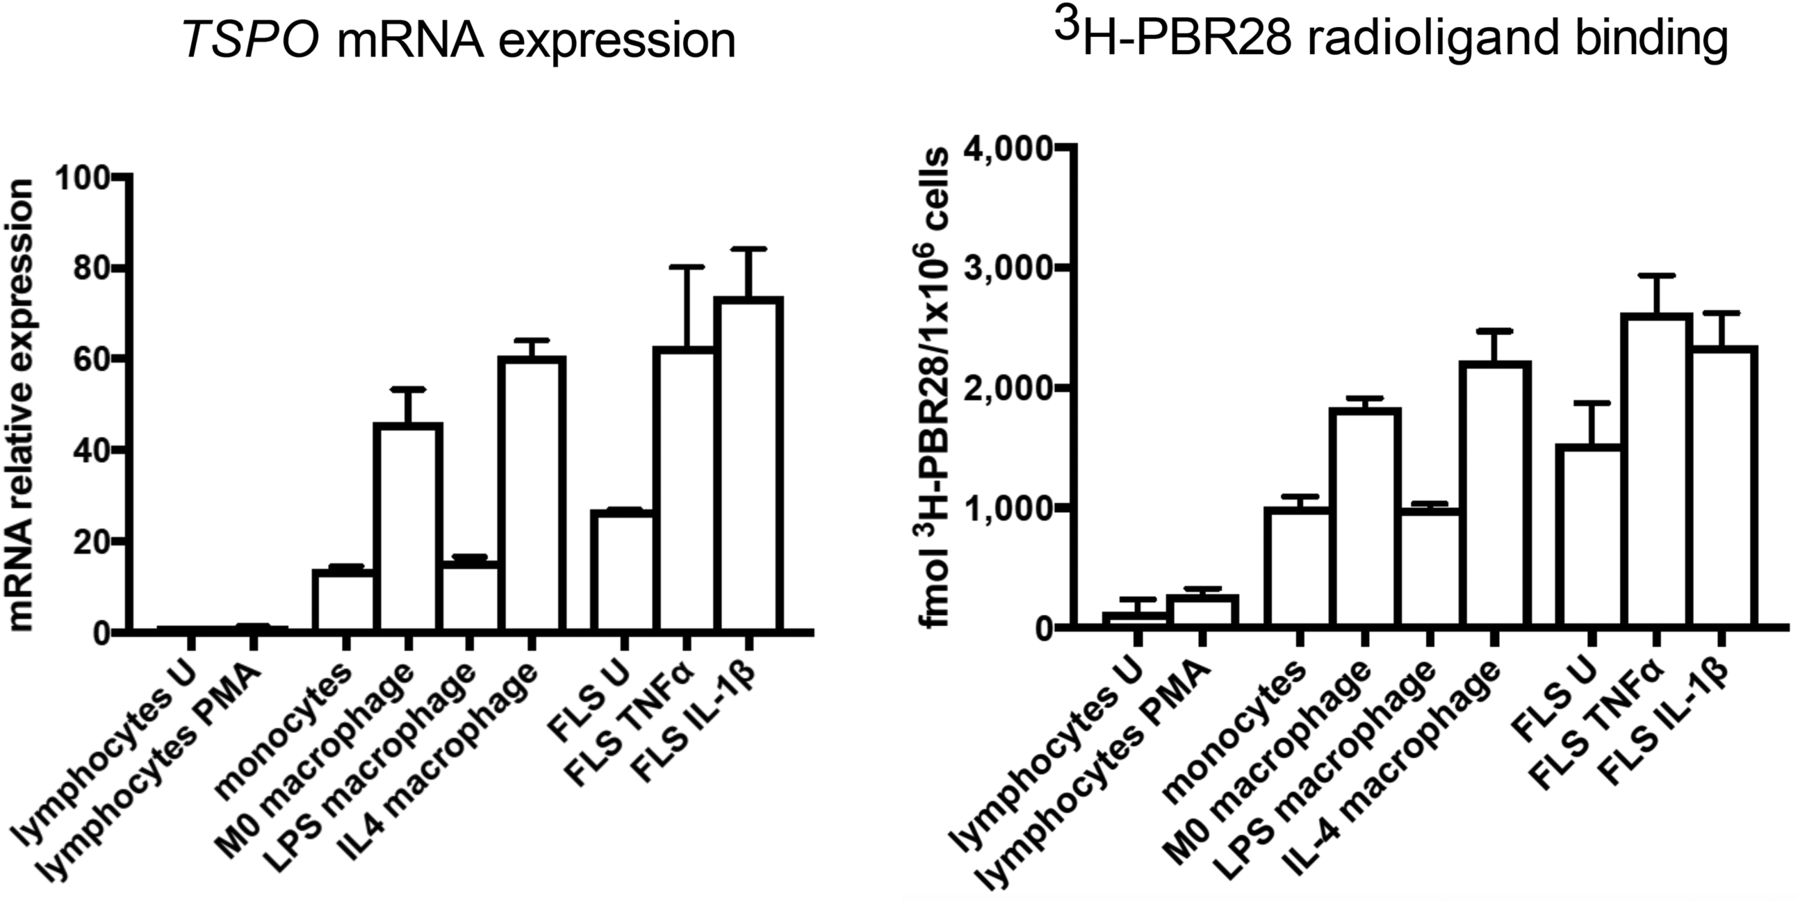
(Left) mRNA expression of TSPO in all cell groups relative to unstimulated CD4+ T cells. (Right) 3H-PBR28–specific binding in all cell groups. Data are mean ± SE for 4 independent experiments, with each experiment being performed in triplicate. One-way ANOVA with Bonferroni multiple-comparison test was used to compare TSPO expression among groups. PMA = phorbol 12-myristate 13-acetate–treated; U = unstimulated.
Likewise, the highest 3H-PBR28 specific binding was seen in FLS cells activated with IL-1β or TNF-α (2,355 ± 153.4 vs. 2,627 ± 180.4 fmol/1 × 106 cells) and in M0 and M2 macrophages (1,838 ± 45.37 vs. 2,223 ± 143.6 fmol/1 × 106 cells). The next highest specific binding was in monocytes, M1 macrophages, and unstimulated FLS cells (1,004 ± 52.61, 994.3 ± 21.93, and 1,532 ± 196 fmol/1 × 106, respectively). The lowest specific binding was in CD4+ T cells (128 ± 64.08 fmol/1 × 106 cells) (Fig. 6).
DISCUSSION
The utility of TSPO-targeted PET as an imaging tool for inflammation is based on the notion of high TSPO expression on activated macrophages (5). The long-established role of macrophages in RA pathogenesis has driven interest in using TSPO PET as a macrophage-targeted imaging tool to detect and quantify RA synovitis in vivo. To date, several studies have demonstrated the ability of TSPO PET to detect and quantify RA joint inflammation, even at subclinical and preclinical stages (11,12,40,41).
However, cell types other than macrophages also play a critical role in RA; the importance of T cells in RA is well established, as evidenced by the efficacy of the T-cell–targeted therapy abatacept for RA (42). Additionally, the role of FLS cells in RA pathogenesis is being increasingly realized (14), with a growing body of research aiming to identify appropriate FLS-cell–specific targets for RA therapies (28,43).
van der Laken et al. previously demonstrated that staining for the macrophage marker CD68 correlated with the signal of the TSPO radioligand 11C-PK11195 in RA joints (11), supporting the idea that TSPO PET signal is macrophage-specific in RA pannus. However, it is recognized that CD68 is also expressed on FLS cells in RA pannus (44,45), and additionally, TSPO expression is known to be ubiquitous (5). Hence, it cannot be assumed that TSPO is macrophage-specific in synovium. In this study, we aimed to better ascertain the major cellular contributors to TSPO PET signal in human RA pannus.
The second-generation TSPO PET radioligand 11C-PBR28 has high specificity for its target (18). We demonstrated that in vivo 11C-PBR28 signal was significantly higher in RA knee joints than in healthy control knee joints. Synovial tissue autoradiography confirmed significantly higher 3H-PBR28 binding in RA synovial tissue than in healthy synovial tissue, with a significant correlation between TSPO immunohistochemical staining and 3H-PBR28 binding, confirming that PBR28 binding reflects synovial tissue TSPO expression, as well as the presence of RA pannus.
Immunofluorescence studies demonstrated costaining of TSPO on cells expressing macrophage, FLS-cell, and CD4+ T-cell markers, providing the first histology data indicating that TSPO appears to be expressed on all major cell types in RA pannus.
The lowest expression of TSPO was determined to be in CD4+ T cells compared with monocytes, as determined by in vivo mRNA and radioligand binding studies, which is in keeping with a previous study of peripheral blood leucocytes (46). However, previous data comparing TSPO expression on monocytes and macrophages are lacking, with this study confirming that TSPO is significantly upregulated on nonactivated macrophages, compared with monocytes.
We previously reported that activation of macrophages to a more M2 phenotype in the presence of IL-4 does not significantly alter TSPO expression (33), yet activation to an M1 phenotype (19) was found to significantly downregulate both TSPO mRNA and specific binding of 3H-PBR28. This finding is in keeping with a recent study on a mouse model of infection-induced neuroinflammation, in which TSPO downregulation was observed in brain microglia in the presence of increased proinflammatory cytokine expression (47).
In contrast, activation of FLS cells with TNF-α or IL-1β further increased TSPO mRNA expression and 3H-PBR28 binding, whereas activation of CD4+ T cells did not affect TSPO expression. Given that the function of TSPO is currently uncertain, further in vitro study may lend insight into the role of TSPO in macrophage phenotype generation, as well as leukocyte and stromal activation, in RA pathogenesis.
Overall, 3H-PBR28 binding to TSPO was highest in activated FLS cells and in M2 and M0 macrophages; was significantly lower in M1 macrophages, monocytes, and unstimulated FLS cells; and was lowest in unstimulated and activated CD4+ T cells. Given the known prominence of synovial hyperplasia in RA due to FLS-cell proliferation, it is feasible that a significant contribution of TSPO PET signal will be from activated FLS cells, as well as macrophages.
Although the number of participants was small in this investigation, both histology and in vitro data confirmed expression of TSPO on all major cell groups in pannus, and in vitro data reached statistical significance. Because of the need for a large amount of protein for radioligand binding studies, leukocytes were derived from healthy donors for in vitro cell work. Therefore, it is plausible that TSPO expression patterns seen in this study might differ in cells from RA patients. Further, although the stimuli applied to activate in vitro cells in this study are widely accepted, the stimuli acting on cells in vivo are multiple and complex. Therefore, additional study of TSPO expression on cells directly extracted from RA synovium, in a larger patient cohort, would help to confirm the findings of this study.
This work assessed TSPO expression in only the reportedly most abundant cell groups in pannus (13). However, multiple other cell groups also exist in pannus, including endothelial cells and osteoclasts (13). The use of flow and mass cytometry studies could enable assessment of TSPO expression in less abundant cells isolated directly from RA synovial tissue.
Although second-generation TSPO radioligands such as PBR28 have superior affinity and specificity for their target, the requirement for genotyping to interpret results may preclude their routine use in clinical practice. However, they remain potentially highly useful research tools in assessing treatment response in early-phase clinical trials.
Our observation that TSPO is expressed on all major cell groups in RA pannus could explain why TSPO PET has been found to be a highly sensitive indicator of synovitis, being superior to MRI in detecting subclinical joint inflammation (41). The histologic heterogeneity of RA synovial tissue is increasingly recognized, with the cellular components changing as the disease advances and differing between individuals regardless of disease activity (48,49). The ability of TSPO PET to detect all major cell groups in pannus means that the technique may be highly sensitive in detecting synovitis, as it will not depend on a single pattern of synovial histology. The fact that TSPO is expressed most highly in activated fibroblasts and in M2 macrophages may render TSPO-targeted PET particularly useful for assessing response to potential FLS-cell–targeted therapies, a key new area of drug development in RA therapy (28).
CONCLUSION
Our results suggest that TSPO PET radioligand binding in RA joints reflects cellularity and activation of inflammatory cells within RA pannus. The high contribution of activated FLS cells to TSPO PET signal may lend utility to TSPO PET as a tool for assessing response to emerging RA therapies targeting synovial FLS cells.
Using synovial tissue from human RA patients and healthy volunteers, we confirmed that the TSPO radioligand PBR28 binds in RA pannus, with negligible signal in healthy joints and tissue. Immunofluorescence studies of RA synovium, and in vitro 3H-PBR28 binding studies, confirmed the presence of TSPO on all major cell groups of pannus, with maximal TSPO mRNA expression and 3H-PBR28 binding in activated FLS cells and in M2 macrophages. Activation of macrophages to an M1 phenotype significantly reduced TSPO mRNA expression and 3H-PBR28 binding.
Although TSPO is upregulated in activated FLS cells, its differential expression on activated macrophages of different phenotypes may provide further clues as to the role of TSPO in chronic inflammatory disease, such as RA, where macrophages are well recognized to play a critical role.
DISCLOSURE
Nehal Narayan was supported by the National Institute for Health Research (NIHR) Oxford Biomedical Research Centre (BRC). The views expressed are those of the authors and not necessarily those of the NHS, the NIHR, or the Department of Health. Nehal Narayan was also supported by an IMPETUS pilot study grant from Imanova, Academic Centre for Imaging Sciences. David Owen is funded by an MRC clinician scientist award (MR/N008219/1). Stephanie Dakin is funded by an Oxford UCB Prize Fellowship in Biomedical Sciences and also received funding from Arthritis Research U.K. (20506). No other potential conflict of interest relevant to this article was reported.
Acknowledgments
We thank the outpatients from the Nuffield Orthopaedic Centre of Oxford Rheumatology Hospitals for participating in this work. Professor Hemant Pandit assisted in the acquisition of healthy synovial tissue.
Footnotes
Published online Jan. 4, 2018.
- © 2018 by the Society of Nuclear Medicine and Molecular Imaging.
REFERENCES
- Received for publication September 13, 2017.
- Accepted for publication November 30, 2017.


