


Abstract
Impaired fundic accommodation (FA) limits fundic relaxation and the ability to act as a reservoir for food. Assessing intragastric meal distribution (IMD) during gastric emptying scintigraphy (GES) allows for a simple measure of FA. The 3 goals of this study were to evaluate trained readers’ (nuclear medicine and radiology physicians) visual assessments of FA from solid-meal GES; develop software to quantify GES IMD; and correlate symptoms of gastroparesis with IMD and gastric emptying. Methods: After training to achieve a consensus interpretation of GES FA, 4 readers interpreted FA in 148 GES studies from normal volunteers and patients. Mixture distribution and κ-agreement analyses were used to assess reader consistency and agreement of scoring of FA. Semiautomated software was used to quantify IMD (ratio of gastric counts in the proximal stomach to those in the total stomach) at 0, 1, 2, 3, and 4 h after ingestion of a meal. Receiver-operating-characteristic analysis was performed to optimize the diagnosis of abnormal IMD at 0 min (IMD0) with impaired FA. IMD0, GES, water load testing, and symptoms were then compared in 177 patients with symptoms of gastroparesis. Results: Reader pairwise weighted κ-values for the visual assessment of FA averaged 0.43 (moderate agreement) for normal FA versus impaired FA. Readers achieved 84.0% consensus and 85.8% reproducibility in assessing impaired FA. IMD0 based on the division of the stomach into proximal and distal halves averaged 0.809 (SD, 0.083) for normal FA and 0.447 (SD, 0.132) (P < 0.01) for impaired FA. On the basis of receiver-operating-characteristic analysis, the optimal cutoff for IMD0 discrimination of normal FA from impaired FA was 0.568 (sensitivity, 86.7%; specificity, 91.7%). Of 177 patients with symptoms of gastroparesis, 129 (72.9%) had delayed gastric emptying; 25 (14.1%) had abnormal IMD0. Low IMD0 (impaired FA) was associated with increased early satiety (P = 0.02). Conclusion: FA can be assessed visually during routine GES with moderate agreement and high reader consistency. Visual and quantitative assessments of FA during GES can yield additional information on gastric motility to help explain patients’ symptoms.
- fundic accommodation
- gastric emptying
- gastroparesis
- Gastroparesis Cardinal Symptom Index
- Patient Assessment of Upper Gastrointestinal Symptoms questionnaire
Gastric emptying scintigraphy (GES) is routinely used to measure overall gastric emptying in patients with dyspeptic symptoms of gastroparesis, which include nausea, vomiting, early satiety, postprandial fullness and, in some patients, upper abdominal pain. Gastroparesis symptoms correlate, albeit weakly, with delayed global gastric emptying (1,2). This weak association may reflect separate mechanisms that together contribute to gastric emptying.
With normal meal ingestion, the proximal stomach relaxes and increases in volume to accommodate the meal (3). During gastric emptying, the solid meal progresses from the proximal stomach to the distal stomach. Impaired fundic accommodation (FA) compromises the ability of the upper stomach to act as a reservoir for ingested food and can result in accelerated transit from the proximal stomach to the distal stomach (4). Abnormal FA may explain some dyspeptic symptoms (3). Studies using a gastric barostat suggested that impaired accommodation is associated with early satiety and weight loss (5). Although a barostat study is considered the gold standard for assessing FA, it is invasive and not widely available. In addition, the barostat balloon itself can alter gastric physiology (6). Several alternate methods for measuring FA, such as SPECT and MRI, have been developed, but these are not in widespread use or involve technology that is not widely available (7).
Quantitative measurement of intragastric meal distribution (IMD), comparing the proportions of the meal in the proximal stomach and the distal stomach, can be used as an indirect measure of FA (8). Assessment of IMD during a standard GES study may yield additional information and permit a better assessment of symptoms of gastroparesis and abnormal gastric motility. This information may then lead to therapy directed to improving gastric accommodation (9–11).
The 3 aims of this study were to evaluate agreement and consistency among trained readers visually assessing FA during routine solid-meal GES; develop computer software for the quantitative analysis of IMD during solid-meal GES and establish quantitative criteria for determining normal FA versus abnormal FA; and correlate symptoms of gastroparesis with different measures of gastric function, including IMD, GES, and water load testing.
MATERIALS AND METHODS
Overview of Study
In this study, we developed visual and quantitative assessment tools to measure FA and IMD using standard solid-meal GES. We developed a numeric cutoff value for abnormal IMD on the basis of visual assessments of FA by an expert panel of nuclear medicine and radiology physicians. We applied the cutoff value to solid-meal GES of patients from National Institutes of Health (NIH) Gastroparesis Consortium centers to relate abnormal IMD to defined symptoms of gastroparesis. We also examined the relationships of other measures of gastric function (total gastric emptying and water loading) to symptoms.
This study was approved by the institutional review boards at Temple University School of Medicine and each of the NIH Gastroparesis Consortium centers contributing patients’ studies for analysis.
GES
Solid-meal GES was performed using the 4-h protocol of Tougas et al. (12) and as recommended in the consensus report of the Society of Nuclear Medicine and Molecular Imaging and the American Neurogastroenterology and Motility Society (8). Patients refrained from using prokinetic agents, narcotic analgesics, and anticholinergic agents for 2 d before GES. Patients were studied in the morning after overnight fasting. The meal consisted of 120 g of liquid egg white radiolabeled with 18.5–37.0 mBq (0.5–1 mCi) of 99mTc-sulfur colloid, 2 pieces of white bread, 30 g of jelly, and 120 mL of water, as recommended in the Society of Nuclear Medicine and Molecular Imaging procedure guideline (13). Patients were asked to finish ingesting the meal within 10 min. Imaging was performed at 0, 1, 2, and 4 h with the patient upright. Some centers also performed imaging at 30 min and 3 h. Anterior and posterior images were acquired for 60 s. Total gastric emptying was analyzed as the percentage of radioactivity retained in the whole stomach over time using the geometric mean of the decay-corrected anterior and posterior counts for each time point. Gastric retention of the 99mTc-labeled solid meal of greater than 60% at 2 h or greater than 10% at 4 h was considered delayed gastric emptying (8,12).
Reader Validation of Visual Assessment of FA During GES
We assessed whether normal FA and abnormal FA can be consistently assessed visually during GES. An instruction guide on how to interpret FA was first developed and sent to 4 nuclear medicine and radiology physicians of the NIH Gastroparesis Consortium (Supplemental Appendix A) (supplemental materials are available at http://jnm.snmjournals.org). Examples of normal FA and impaired FA are shown in Figure 1. After completing the instruction guide, all readers had to successfully complete a training set of 24 studies to identify 16 normal volunteers and 8 patients with abnormal FA.

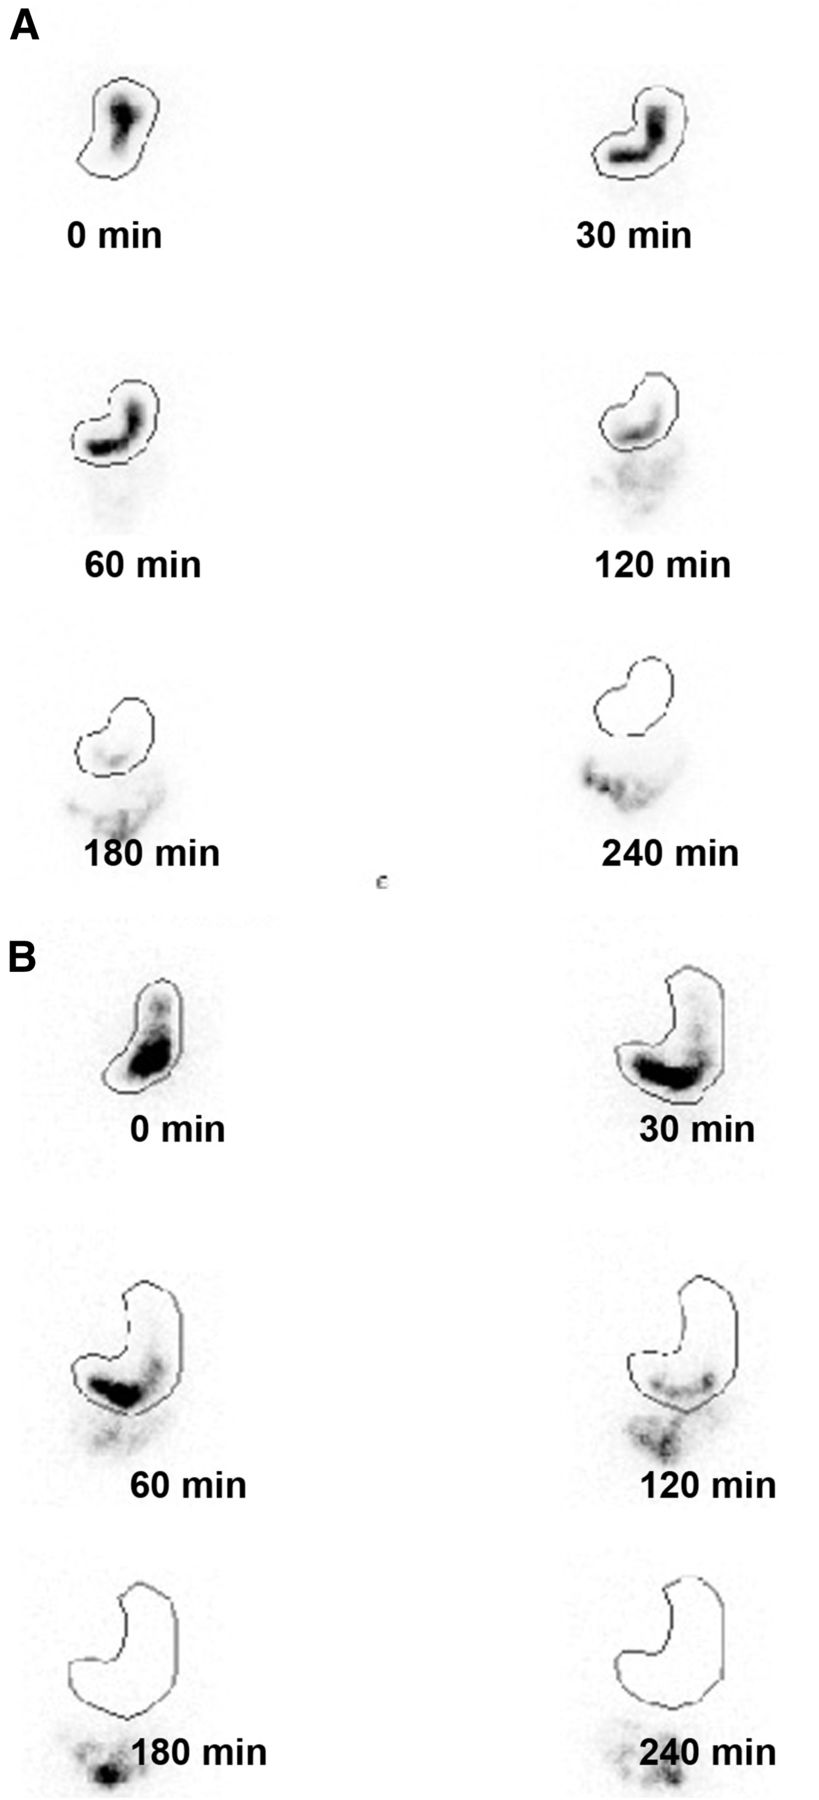
Examples of normal FA (A) and abnormal FA (B) assessed by GES. In normal FA, most radiolabeled solids appeared in proximal stomach immediately after meal ingestion (time, 0 min). Over time, solids progressed into distal stomach. In abnormal FA, most radiolabeled solids appeared in distal stomach at 0 min.
After the initial training, the readers interpreted 148 GES studies performed at Temple University Hospital. This study set included studies from 19 normal volunteers and 99 patients (18 with impaired FA and 81 with normal FA). In addition, 30 patient studies (4 showing impaired FA and 26 showing normal FA) from the study set were repeated to test reader reproducibility. The readers used FA interpretive scores of 1–5, where 1 indicated definitely abnormal accommodation, 2 indicated probably abnormal accommodation, 3 indicated possibly abnormal accommodation, 4 indicated probably normal accommodation, and 5 indicated definitely normal accommodation. These scores were based on the mixture distribution analysis (MDA) described by Kundel and Polansky (14).
Computer Assessment of IMD
To our knowledge, there are no well-established criteria for how to divide the stomach into proximal and distal segments to assess FA. We developed semiautomated MatLab (MathWorks) software to automatically derive threshold-based gastric borders to outline the gastric region of interest. Supplemental Appendix B shows the details of the software approach.
To quantitate whether there was normal FA or abnormal FA in the GES images obtained immediately after meal ingestion (time, 0 min), we defined IMD at 0 min (IMD0) as the ratio of gastric counts in the proximal stomach to those in the entire stomach. For this study, we evaluated 3 different quantitative approaches for measuring IMD0. The first approach divided the stomach into 2 equal parts (proximal and distal halves) using the midpoint of the longitudinal axis of the stomach. This “halves” approach was previously described by Piessevaux et al., who evaluated gastric images at different time intervals after meal ingestion and then summed the images (15). The longitudinal axis of the stomach was defined as the curve that runs from the most proximal point of the stomach wall to the most distal point; the stomach was divided into 2 parts along the midlength of this axis (15). The second approach divided the stomach into 3 parts using 3 equal segments along the longitudinal axis (16). The third approach divided the stomach into proximal and distal parts visually using the anatomic incisura (17). These methods for dividing the stomach are illustrated in Figure 2.
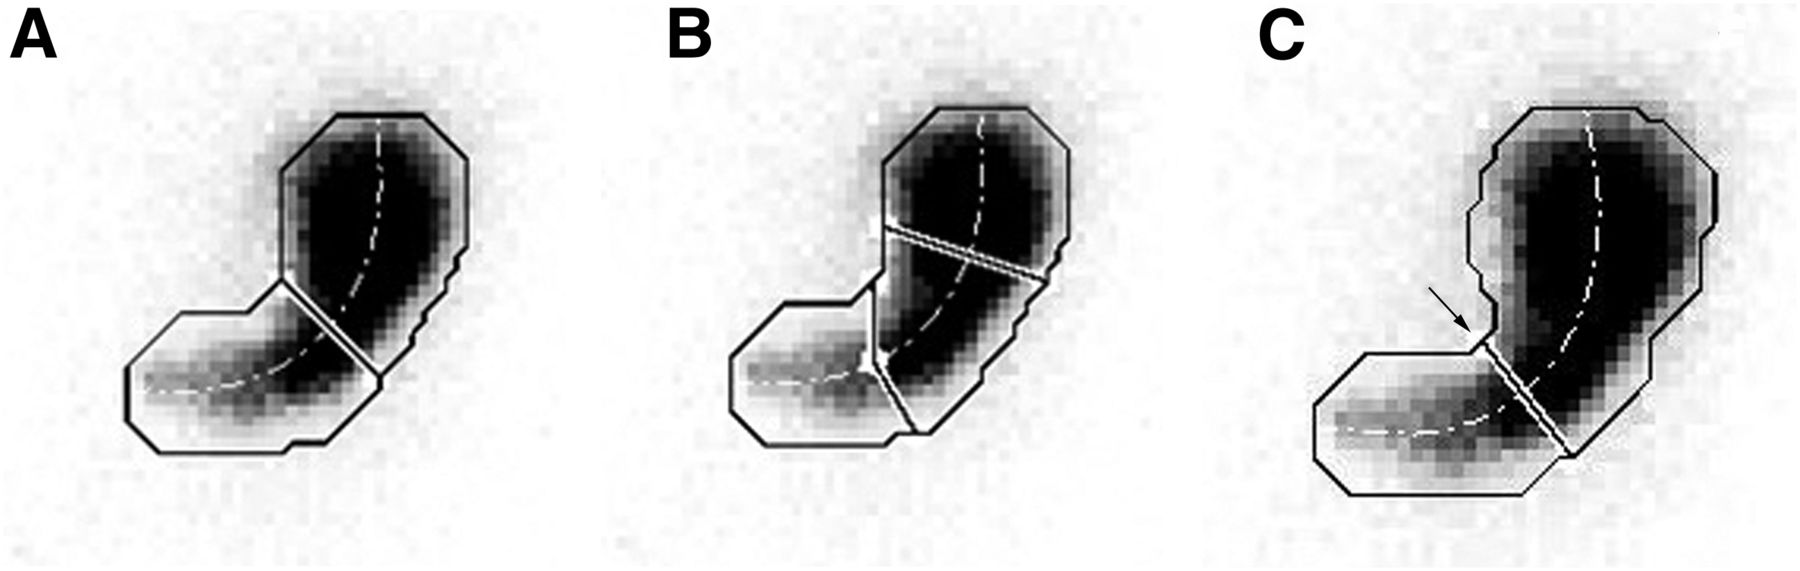
Three methods for dividing stomach into proximal and distal portions. (A) Illustration of how computer-generated regions of interest (ROIs) for proximal and distal stomach (solid line) were defined by dividing stomach at one-half the distance along long axis of stomach (dotted line). (B) Illustration of how computer-generated ROIs were defined by selecting equal one-third divisions along long axis of stomach. (C) Stomach incisura angularis is site of formation of acute angle on lesser curvature (arrow) to form localized “notch.” Location of incisura varies depending on degree of gastric distension; therefore, consistent localization is difficult.
Correlation with Symptom Scores from Gastroparesis Registry Patients
The second study group comprised 177 patients who had recorded symptoms of gastroparesis, were undergoing GES, and were enrolled at 8 centers in the NIH Gastroparesis Registry from September 2012 to March 2016 (18). The patients met specific entry criteria: being 18 y old or older, having symptoms suggestive of gastroparesis (nausea, vomiting, early satiety, and postprandial fullness) for a duration of at least 12 wk, having had GES using the 4-h liquid egg white protocol, and having no structural abnormality on upper endoscopy within 1 y of enrollment. Each patient completed the 20-item Patient Assessment of Upper Gastrointestinal Symptoms questionnaire to assess symptoms of gastroparesis, dyspepsia, and gastroesophageal reflux disease (19). This questionnaire includes the 9 symptoms of the Gastroparesis Cardinal Symptom Index: nausea, retching, vomiting, stomach fullness, inability to finish meal, excessive fullness, loss of appetite, bloating, and abdominal distension (20). The patients were asked to assess the severity of their symptoms during the previous 2 wk using a scale from 0 to 5, where 0 indicated no symptoms, 1 indicated very mild symptoms, 2 indicated mild symptoms, 3 indicated moderate symptoms, 4 indicated severe symptoms, and 5 indicated very severe symptoms.
GES studies were performed at each NIH Gastroparesis Registry center as described earlier (8,12). Patients also underwent a noncaloric water load test (21). The water load test is a standardized test for inducing gastric distension. Patients reported after fasting overnight and were instructed to drink a maximal volume of water using an opaque 15-mL cup over 5 min until they felt completely full (21). The volume of water consumed was recorded.
Statistical Analysis Methods
As there is currently no routinely available, gold standard test in clinical use to assess whether normal FA or abnormal FA is present in patients undergoing GES for suspected gastroparesis, we used a statistical method described by Kundel and Polansky (14) (MDA) to assess the consistency of scoring for normal FA or abnormal FA observed during solid-meal GES. MDA was originally applied to the interpretation of plain-film radiographs and is used to evaluate the consistency of assessments among different readers when a gold standard does not exist to allow for a determination of whether an accurate diagnosis can be made. It assumes that high consistency among readers can be used to establish a correct diagnosis (14).
For the MDA, an initial set of GES studies (n = 148) was independently evaluated by the 4 trained readers and given a score from 1 to 5 as described by Kundel and Polansky (14): 1 indicated definitely abnormal accommodation, 2 indicated probably abnormal accommodation, 3 indicated possibly abnormal accommodation, 4 indicated probably normal accommodation, and 5 indicated definitely normal accommodation. This scoring system was then condensed into a 2-level scoring system as described by Kundel and Polansky (14): abnormal/impaired accommodation (scores 1, 2, and 3) and normal/nonimpaired accommodation (scores 4 and 5). These scores were compiled and analyzed using an iterative method (expected-maximization algorithm) (22) to calculate the maximum-likelihood estimates of the model parameters and derive the proportion “correctly” or consistently diagnosed by way of consensus of the 4 readers—in other words, how much the readers agreed with one another as a panel indicated a reproducible diagnosis. A more complete description of MDA statistical analysis is shown in Supplemental Appendix C (23–28).
Next, we correlated the characteristics and symptoms of a second set of patients from the NIH Gastroparesis Registry with their IMD values. Descriptive statistics (means, SDs, frequencies, and percentages) were used to characterize subgroups of patients with gastroparesis. Demographics, medical history, gastroparesis history, symptom severity, and quality-of-life characteristics at the enrollment visit were compared across IMD0 subgroups by receiver-operating-characteristic analyses and characterized as normal (>0.643), borderline (0.568–0.643), and abnormal (<0.568) (Supplemental Appendix C). P values were derived from a Cochran–Armitage trend test for binary variables or linear regression of continuous variables on the 3 categories of IMD, with modeling IMD as an ordinal variable (29,30). Multiple logistic models regressing abnormal or abnormal/borderline IMD on enrollment characteristics were selected on the basis of the Akaike Information Criterion from a candidate set of all characteristics (31,32).
We also analyzed each of the other assessments of gastric motility, specifically, water loading and gastric emptying, to explore their relationships with items from the Patient Assessment of Upper Gastrointestinal Symptoms questionnaire. Symptom severity was determined for different degrees of abnormalities for each test.
All P values were 2-sided and nominal, with P values of less than 0.05 being considered statistically significant. Analyses were performed using methods described in SAS version 9.3 (SAS Institute Inc.) or Stata version 13.1 (StataCorp).
RESULTS
Visual Assessment of FA
The results of the readers’ assessment of FA in the first set of 99 patient studies are shown in Table 1. On the basis of FA scores, 15 patients had impaired accommodation (3 or 4 readers rating accommodation as impaired, that is, scores of 1–3), 73 patients had normal accommodation (3 or 4 readers rating accommodation as normal, that is, scores of 4 or 5), and 11 patients had indeterminate accommodation (2 readers rating accommodation as impaired and 2 readers rating accommodation as normal). Pairwise weighted κ-values among the 4 readers’ assessments of FA using the 5 levels of normal or impaired accommodation averaged 0.38 (fair agreement; 95% CI, 0.25–0.51) (Table 2). The agreement of κ-values among the 4 readers for the classification of normal or impaired accommodation (i.e., 4 or 5 vs. 1–3) averaged 0.43 (moderate agreement; 95% CI, 0.25–0.62).
Agreement of Assessment of FA by 4 Nuclear Medicine and Radiology Physicians Evaluating 99 Subjects
κ-Values and CIs for Readers Assessing FA in 99 Test Subjects
Using MDA, a panel could reach a “correct” consensus about the impairment of FA 84% of the time (Table 1C of Supplemental Appendix C). MDA of the 99 patients’ data further revealed that approximately 11% of the assessments were easily classified as true-positive, 62% of the assessments were easily classified as true-negative, and the remaining 27% of assessments were difficult to classify. In addition, approximately 87.2% of the true-positive assessments and 5.3% of the true-negative assessments were classified as true-positive, whereas 41.0% of the difficult assessments were classified as true-positive.
For analysis of the reproducibility of the readers’ assessments of FA, 30 patient studies (4 impaired and 26 normal) were repeated by the 4 readers, giving a total of 120 repeated readings. Of 90 readings initially classified as normal FA (scores of 4 or 5), 77 (85.6%) were classified as normal FA on the second reading. Of the 30 readings initially classified as impaired FA (scores of 1–3), 26 (86.7%) were classified as impaired FA on the second reading. These data resulted in an overall reproducibility of 85.8%.
Software Analysis
Three different approaches for dividing the stomach (equal halves, equal thirds, and division at the incisura) were evaluated. Division of the stomach into proximal and distal halves resulted in mean IMD0 values of 0.768 (SD, 0.107) for normal FA and 0.488 (SD, 0.132) for impaired FA (P < 0.0001). Division of the stomach into proximal, middle, and distal thirds resulted in mean IMD0 values of 0.506 (SD, 0.120) for normal FA and 0.271 (SD, 0.091) for impaired FA (P < 0.0001). The incisura method for segmentation resulted in mean IMD0 values of 0.850 (SD, 0.083) for normal FA and 0.584 (SD, 0.122) for impaired FA (P < 0.0001). Although all 3 methods were able to differentiate normal FA from abnormal FA, we found that the incisura was difficult to reliably identify on some of the images (Fig. 2); therefore, this method (15) was not further used for correlation to symptom scores. Division by equal thirds often left the antrum with very low counts for analysis; therefore, this method also was not used for further analysis. Thus, gastric division into proximal and distal halves along the long axis was used for analyzing the remaining results of the study.
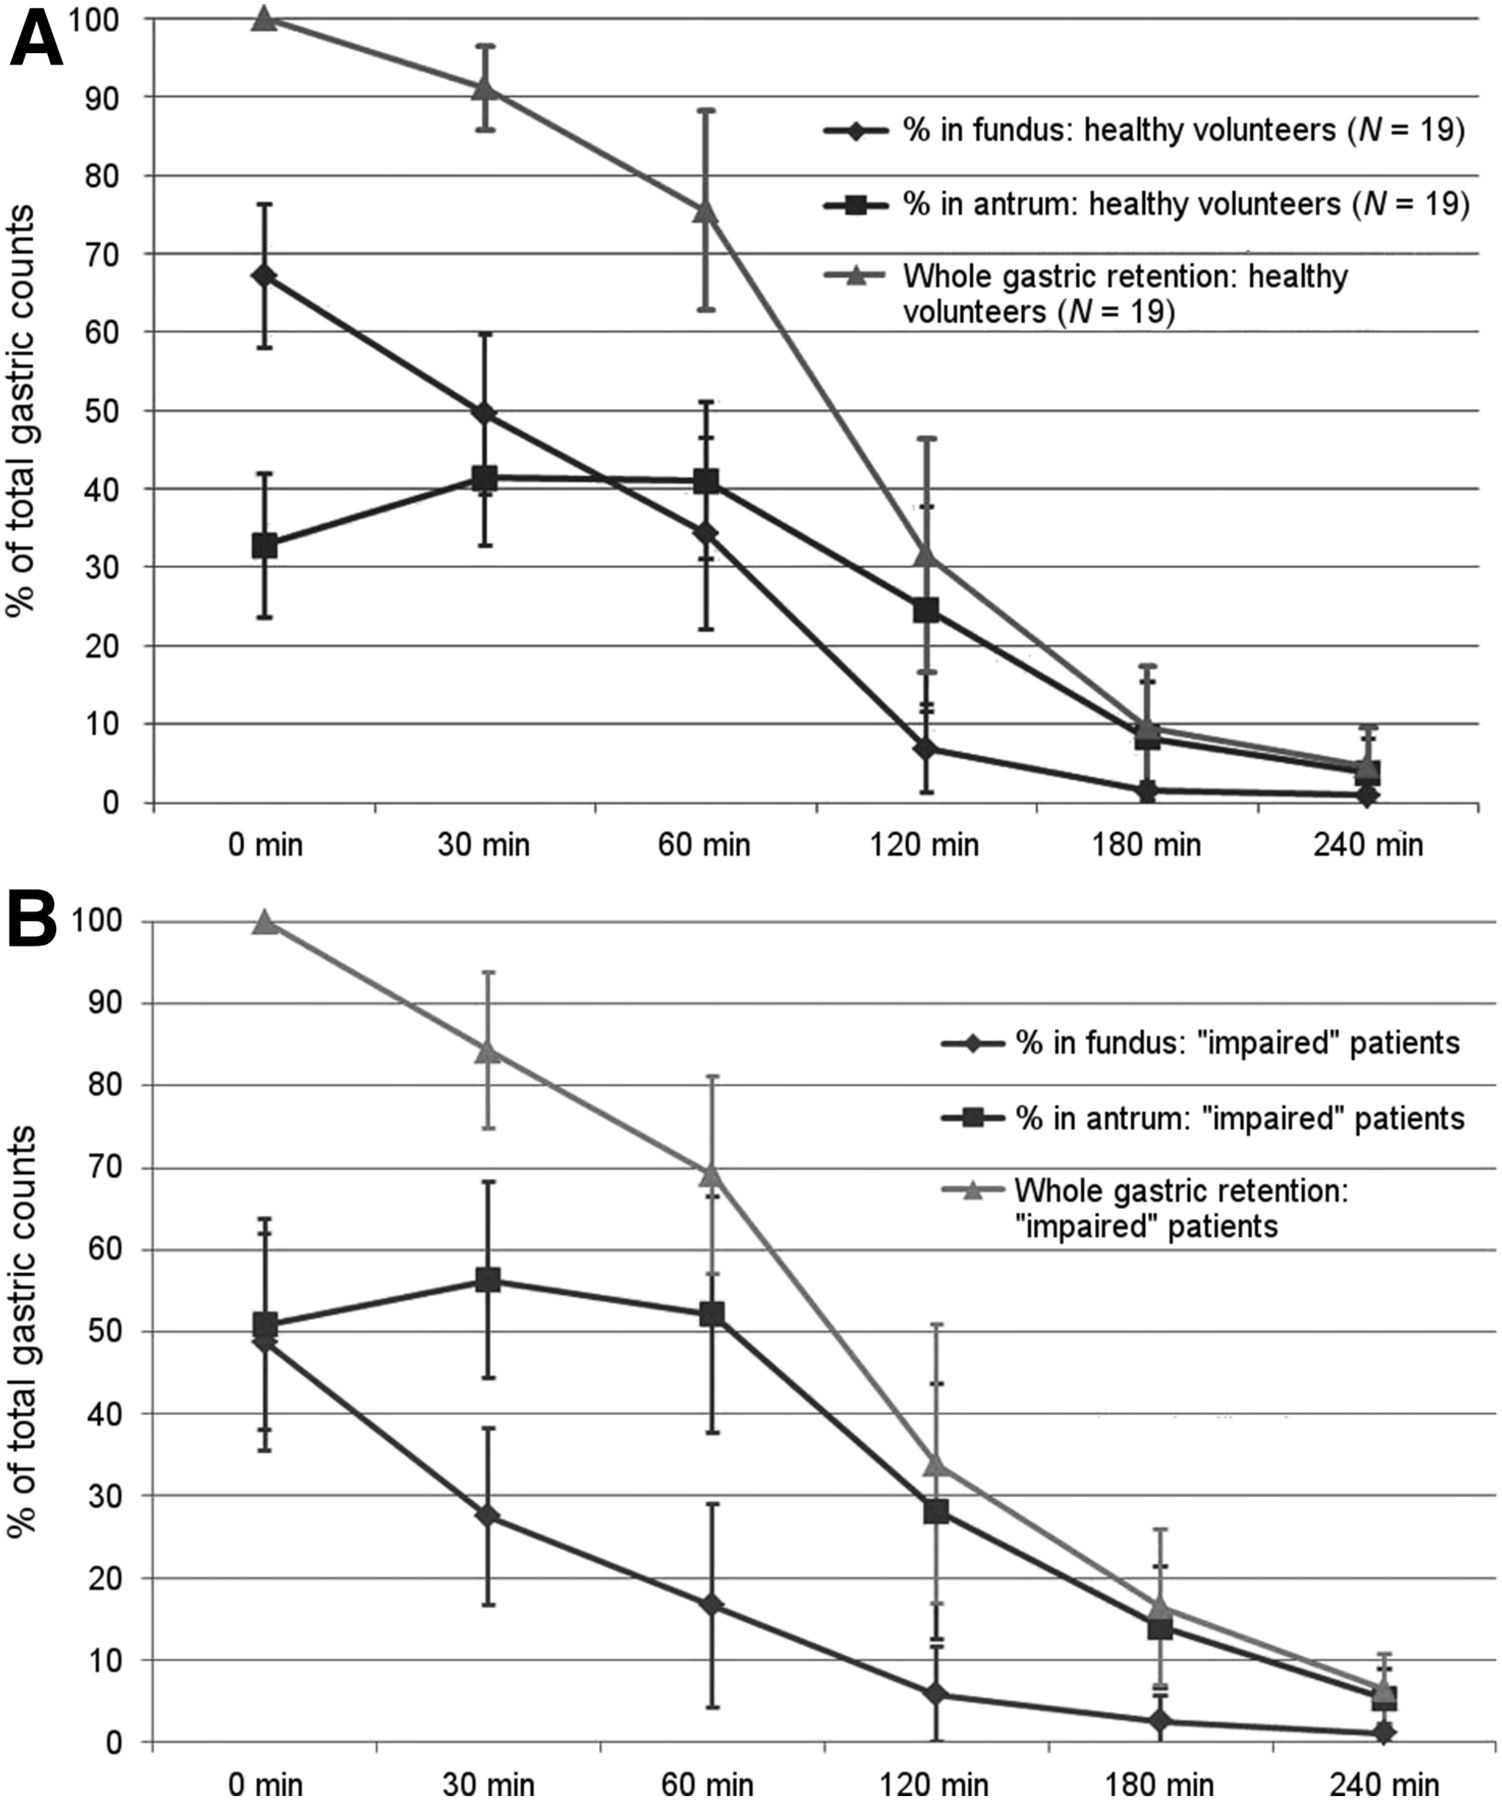
The time courses for IMD in the 19 normal volunteers and patients with abnormal FA are shown in Figure 3. IMD0 (on the image immediately after meal ingestion) averaged 0.672 (SD, 0.092). For the 19 normal volunteers, the mean FA score from the 4 readers was 4.2 (SD, 0.6; range, 3.25–5.00). IMD0 correlated with the mean FA score from the readers (r = 0.660; P < 0.01). For the 99 patients, the average score from the visual reading was 4.1 (SD, 0.9; range, 1.0–5.0). The correlation between the mean visual FA score and IMD0 for the 99 patients was 0.832 (P < 0.01). The correlation between the mean visual FA score and IMD0 for the combined 99 patients and 19 normal volunteers was 0.812 (P < 0.01).

IMD over time after meal ingestion for normal volunteers (A) and for patients with abnormal FA (B), as indicated by readers’ assessment of FA. Values are means ± 1 SD at each recorded time.
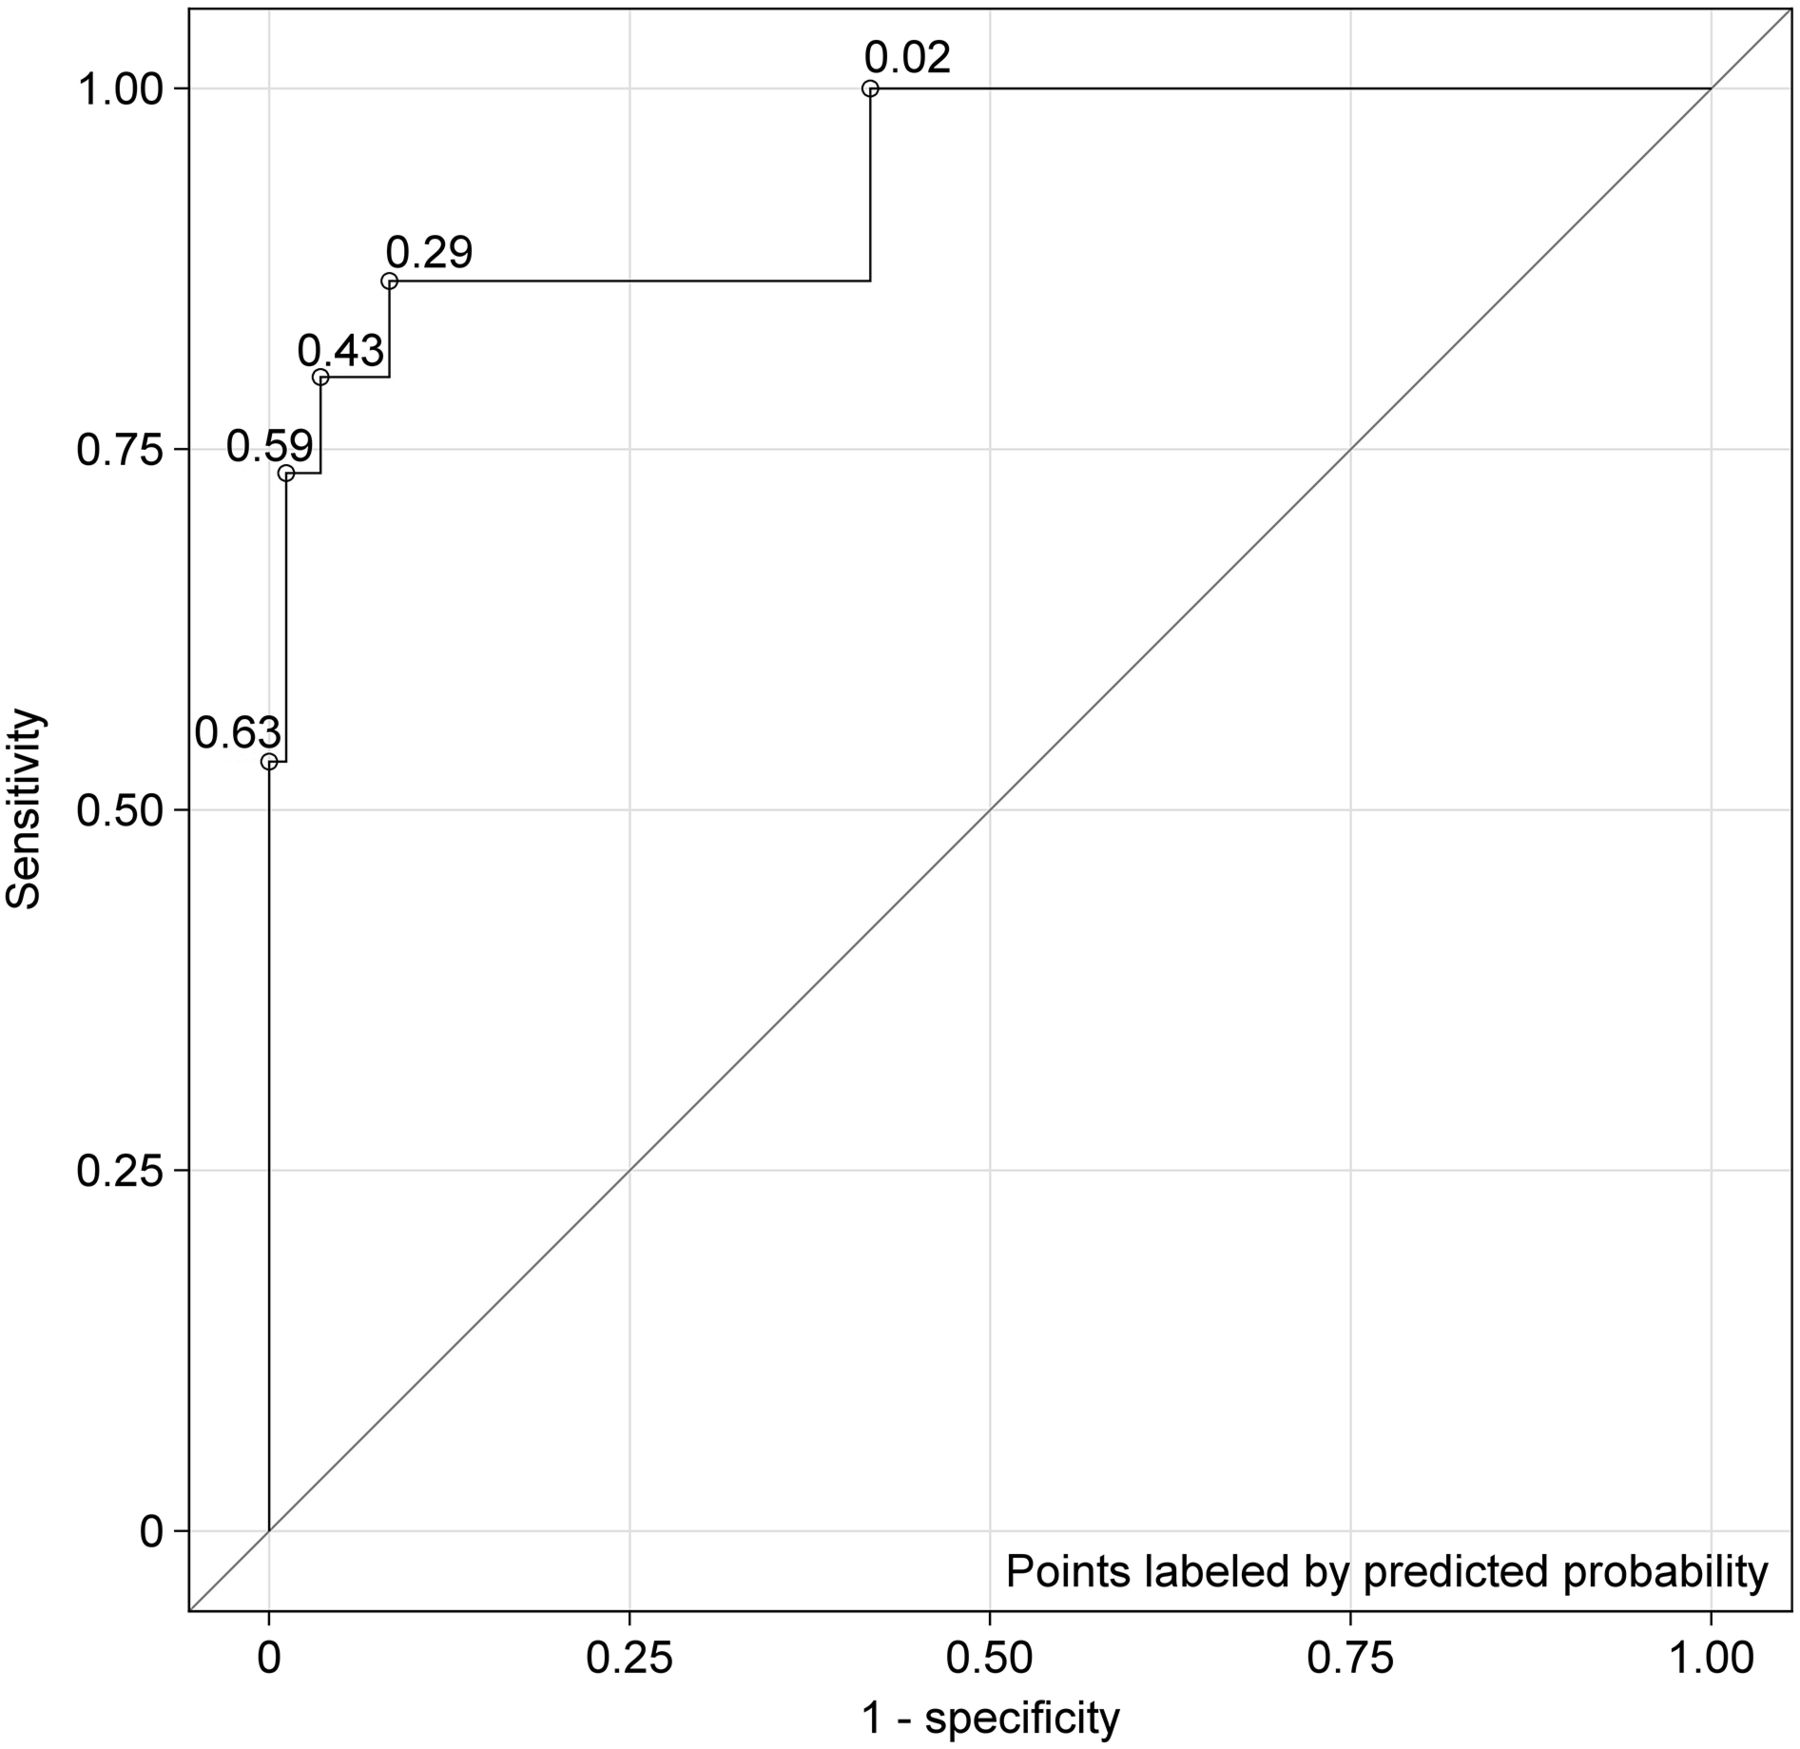
Patients with normal FA had an average IMD0 of 0.809 (SD, 0.083); for those with impaired FA (defined as ≥3 of the 4 readers reading the FA as impaired), the value was 0.447 (SD, 0.132) (P < 0.01). Receiver-operating-characteristic analysis (Fig. 4) yielded an area under the curve of 0.93 and an optimal cutoff of 0.568 for the IMD0 ratio of proximal to total gastric counts for discriminating normal FA from impaired FA (Table 2C of Supplemental Appendix C). These data resulted in a sensitivity of 86.7% and a specificity of 91.7%.

Logistic regression and receiver-operating-characteristic (ROC) curve for 99 test subjects, with IMD0 or percentage of proximal gastric retention at baseline being used as predictor of abnormal/impaired FA. Area under curve (concordance statistic) for this ROC curve was 0.934; this value implied that corresponding logistic regression model offered excellent fit to data (25).
Correlation of GES, IMD, and Water Loading in Patients with Symptoms of Gastroparesis
A total of 129 (72.9%) of 177 NIH Gastroparesis Registry patients had delayed GES (gastric retention of >60% at 2 h or >10% at 4 h). Twenty-five (14.1%) of the 177 patients had abnormal IMD0 (<0.568), and an additional 20 (11.3%) had borderline IMD0 (0.568–0.642) (Fig. 1D and Table 1D of Supplemental Appendix D). Impaired FA status, as defined by low IMD0, was associated with a low body mass index (P = 0.006), loss of weight since the diagnosis of gastroparesis (P = 0.06), patients who did not have diabetes (P = 0.01), and prior pyloric botulinum toxin treatment (P = 0.04). Low IMD0 was also associated with less gastric retention of the solid meal at 1 h (P = 0.001), 2 h (P = 0.002), and 4 h (P = 0.05).
Associations with measured clinical parameters did not vary significantly by whether or not a patient had delayed GES. We found that 77% of the 132 patients with normal IMD0 and 64% of the 25 patients with impaired IMD0 had delayed gastric emptying (P = 0.13). Of the 47 patients with normal gastric emptying, 9 (19%) had low IMD0. Of the 130 patients with delayed gastric emptying, 16 (12%) had impaired IMD0.
Low IMD0 was associated with more severe early satiety (P = 0.02) but not nausea (P = 0.39), vomiting (P = 0.49), postprandial fullness (P = 0.34), or upper abdominal pain (P = 0.68) (Table 1D of Supplemental Appendix D). Of the 130 patients with delayed gastric emptying, the 16 patients with impaired IMD0 had greater severity of early satiety than those with normal IMD0 (4.2 ± 1.3 vs. 3.4 ± 1.6; P = 0.01). Of the 47 patients with normal gastric emptying, the 9 patients with impaired IMD0 tended to have greater nausea than those with normal IMD0 (3.9 ± 0.09 vs. 3.1 ± 1.3; P = 0.06).
Increased gastric retention of the solid meal at 4 h was associated with increased severity of vomiting (P = 0.03) (Table 1E of Supplemental Appendix E). An abnormal water load test was associated with severity of nausea (P = 0.05), lower abdominal pain (P = 0.0001), and diarrhea (P = 0.01) (Table 2E of Supplemental Appendix E).
DISCUSSION
Several different tests have been proposed for assessment of the FA response to an ingested meal, but no single test has gained widespread clinical use (6). In the present study, we evaluated IMD0, which is readily obtained from routine GES, as a marker of the FA response. The current gold standard for the assessment of FA is the gastric barostat. A barostat study, however, is invasive and uncomfortable for the patient. It is not widely available and not used routinely. In the present study, we evaluated IMD0 as a potential measure of FA and correlated the finding of abnormal IMD0 with patient symptoms.
We used visual assessment by trained readers of solid-meal GES to determine normal FA or abnormal FA. Using κ-analysis and the MDA described by Kundel and Polansky (14), we found that FA can be assessed visually during routine GES with fair to moderate pairwise agreement and high panel consistency (84%) among trained readers. For quantitative IMD, semiautomated MatLab software was developed not only to semiautomate outlining the gastric region of interest but also to divide the stomach into proximal and distal halves on the basis of the midpoint of the longitudinal axis of the stomach. The relative amount in the proximal half of the stomach could then be automatically calculated. This analysis revealed that a ratio of less than 0.568 for IMD0 was an optimum cutoff for correlation with the visual determination of impaired FA.
In a large group of patients (n = 177) with symptoms of gastroparesis from the NIH Gastroparesis Registry (most with delayed GES and some with normal GES), impaired IMD0 was present in 25 (14%). However, of the 47 patients with normal gastric emptying, 9 (19%) had low IMD0; this finding yielded new diagnostic information on abnormal gastric motility. Of the 130 patients with delayed gastric emptying, 16 (12%) had low IMD0.
Early satiety was more severe in patients with abnormal IMD0 than in those with normal IMD0. This finding agrees with those of the study of Piessevaux et al. using GES in functional dyspepsia patients (15) as well as studies using the gastric barostat (5). Abnormal IMD0 was also significantly associated with loss of weight and low body mass index and was predominantly seen in patients who did not have diabetes.
Solid-meal GES is a clinical test that is widely available and currently performed typically only to measure total gastric emptying. The present study shows that GES not only can measure global gastric emptying but also can be used to assess IMD as an indirect measure of FA. This approach can add diagnostic information on gastric motility by assessing gastric emptying as well as FA. Several agents, such as sumatriptan and buspirone, have been shown to help improve FA and the symptom of early satiety (9–11).
The present study shows that different pathophysiologic bases are associated with different symptoms in patients with suspected gastroparesis. Gastric retention on GES was associated primarily with vomiting. Abnormal IMD0 was associated with early satiety. An abnormal water load test was associated with nausea. Thus, different treatments targeting these distinct gastric motility defects may be indicated for different symptoms.
We recognize several limitations of the present study. First, the population studied had a high percentage of delayed gastric emptying, likely because they were a highly selected group from the NIH Gastroparesis Registry. Our results may not be typical of what would occur with screening of a more diverse patient population with dyspepsia and suspected gastroparesis. This factor may explain why only 14% of our patients had impaired FA, whereas in the work of Tack et al. with patients who had functional dyspepsia, about 30% had impaired FA (5). We recognize that a potential limitation of using routine GES imaging is that if a patient has taken a long time to eat the meal, then some of the radiolabeled meal may have progressed into the antrum when the first image is obtained. This condition can lead to an impression of abnormal IMD0. In our study protocol, all patients completed the meal in less than 10 min. Another potential limitation of GES is that if a patient is not able to consume the entire meal, then the smaller volume and fewer calories ingested will affect FA and gastric emptying.
CONCLUSION
FA can be visually assessed during routine solid-meal GES with moderate pairwise agreement and high consistency among trained readers. For quantitative analysis of FA, semiautomated software has been developed to provide a simple division of the stomach into proximal and distal halves along the long axis of the stomach to measure IMD. This approach adds information during routine solid-meal GES. Abnormal IMD0 was significantly associated with early satiety. These physiologic and quantitative assessments of FA can improve the understanding of the relationship of symptoms to gastric dysmotility.
DISCLOSURE
The Gastroparesis Clinical Research Consortium is supported by the National Institute of Diabetes and Digestive and Kidney Diseases (grants U01DK073975, U01DK073983, U01DK073985, U01DK074007, U01DK073974, and U01DK074008). No other potential conflict of interest relevant to this article was reported.
Acknowledgments
The clinical trial registration identifier of this study is NCT01696747.
Footnotes
↵* Contributed equally to this work.
Published online Sep. 28, 2017.
- © 2018 by the Society of Nuclear Medicine and Molecular Imaging.
REFERENCES
- Received for publication June 17, 2017.
- Accepted for publication August 23, 2017.


Jump to section
Related Articles
Cited By...
- Relationship between intragastric meal distribution, gastric emptying and gastric neuromuscular dysfunction in chronic gastroduodenal disorders
- Distinct subgroups in gastroparesis defined by simultaneous body surface gastric mapping and gastric emptying breath testing
- Gastric emptying study before gastric peroral endoscopic myotomy (G-POEM): can intragastric meal distribution be a predictor of success?
- Actionable biomarkers: the key to resolving disorders of gastrointestinal function
- Proximal and Distal Gastric Retention Patterns in Gastroparesis and the Impact of Gastric Per-Oral Endoscopic Myotomy: A Retrospective Analysis Using Gastric Emptying Scintigraphy
- Enhanced Gastric Emptying Scintigraphy to Assess Fundic Accommodation Using Intragastric Meal Distribution and Antral Contractility