


Abstract
The lysophosphatidic acid receptor type 1 (LPA1) is 1 of 6 known receptors of the extracellular signaling molecule lysophosphatidic acid. It mediates effects such as cell proliferation, migration, and differentiation. In the lung, LPA1 is involved in pathways leading, after lung tissue injury, to pulmonary fibrosis instead of normal healing, by mediating fibroblast recruitment and vascular leakage. Thus, a LPA1 PET radiotracer may be useful for studying lung fibrosis or for developing LPA1-targeting drugs. We developed and evaluated the radiotracer 11C-BMT-136088 (1-(4′-(3-methyl-4-(((1(R)-(3-11C-methylphenyl)ethoxy)carbonyl)amino)isoxazol-5-yl)-[1,1′-biphenyl]-4-yl)cyclopropane-1-carboxylic acid) in rhesus monkeys to image LPA1 in the lung in vivo with PET. Methods: The study consisted of 3 parts: test–retest scans; self-saturation to estimate the tracer’s in vivo dissociation constant, nondisplaceable volume of distribution (VND), and nondisplaceable binding potential (BPND); and dosimetry. In the first 2 parts, the radiotracer was administered using a bolus-plus-infusion protocol, the arterial input function was measured, and the animals underwent 2 scans per day separated by about 4 h. Lung regions of interest were segmented, and the tissue density estimated, from CT images. A fixed blood volume correction was applied. The tracer volume of distribution (VT) was estimated using multilinear analysis 1 (MA1) or equilibrium analysis (EA). Results: 11C-BMT-136088 baseline VT was 1.83 ± 0.16 (MA1, n = 5) or 2.1 ± 0.55 (EA, n = 7) mL of plasma per gram of tissue in the left and right lung regions of interest, with a test–retest variability of −6% (MA1, n = 1) or −1% ± 14% (EA, n = 2). For the self-saturation study, 11C-BMT-136088 VND and BPND were estimated to be 0.9 ± 0.08 mL of plasma per gram of tissue and 1.1 ± 0.14, respectively. The unlabeled drug dose and plasma concentration leading to a 50% reduction of 11C-BMT-136088 specific binding were 73 ± 30 nmol/kg and 28 ± 12 nM, respectively. The average plasma free fraction was 0.2%; thus, the tracer’s in vivo dissociation constant was estimated to be 55 pM. For the dosimetry study, the highest organ dose was in the liver (43.1 ± 4.9 and 68.9 ± 9.4 μSv/MBq in reference human male and female phantoms, respectively), and the effective dose equivalent was 6.9 ± 0.6 and 8.7 ± 0.6 μSv/MBq, respectively. Conclusion: Specific binding of 11C-BMT-136088 can be reliably measured to quantify LPA1 in the lungs of rhesus monkeys in vivo.
- lysophosphatidic acid receptor type 1
- lung, positron emission tomography
- preclinical imaging
- idiopathic pulmonary fibrosis
Lysophosphatidic acid is a glycerophospholipid serving as a precursor for the formation of other phospholipids and is an extracellular signaling molecule through a family of G-protein–coupled receptors (1). The lysophosphatidic acid receptor type 1 (LPA1) is encoded by one of the endothelial differentiation genes, EDG-2, which is widely expressed in the body but with different levels of expression between organs and between species (2,3). Lysophosphatidic acid signaling through LPA1 receptors has been linked to fibrosis in the lung (4), kidney (5,6), and liver (7,8), and LPA1 antagonists are currently under investigation as potential therapeutic drugs against fibrosis (9).
No radioligand was available to study LPA1 with PET. BMT-136088 (1-(4′-(3-methyl-4-(((1(R)-(3-methylphenyl)ethoxy)carbonyl)amino)isoxazol-5-yl)-[1,1′-biphenyl]-4-yl)cyclopropane-1-carboxylic acid) is a high-affinity and selective LPA1 antagonist (international patent applications PCT/US2012/032222 and PCT/US2014/063391). In this study, we report the first evaluation of 11C-BMT-136088 as a PET radioligand to quantify specific binding to LPA1 in lung. The body distribution and kinetics of 11C-BMT-136088 were evaluated to estimate its radiation dosimetry.
MATERIALS AND METHODS
Study Plan and Population
This study consisted of 3 parts. The first part was a within-day test–retest study to evaluate the variability of 11C-BMT-136088 volume-of-distribution (VT) (10) estimates and verify that the duration of anesthesia does not induce a bias in VT estimates. The second part was a self-blocking study to quantify the fraction of specific binding of 11C-BMT-136088 and the tracer dose limit. The third part was a dosimetry study.
Two rhesus monkeys were included in the test–retest and self-blocking studies (1 male, 1 female; age, 4.8 ± 0.8 y; weight, 8.6 ± 0.4 kg [all data are presented as mean ± SD, unless otherwise stated]). Four animals were included in the dosimetry study (2 male, 2 female; age, 6.5 ± 2.2 y; weight, 7.6 ± 10 kg). All experiments were conducted in accordance with the guidelines of the Yale University Institutional Animal Care and Use Committee.
Radiochemistry
Figure 1 shows the radiolabeling of 11C-BMT-136088, prepared via a Suzuki–Miyaura cross-coupling method by C–11C-methylation of the aryl boronic ester precursor with 11C-methyl iodide, followed by hydrolysis of the carboxylate ester intermediate. The molar activity at the end of synthesis was 491 ± 131 MBq/nmol (n = 16; range, 81–634 MBq/nmol). The radiochemical purity was 99% ± 1% (n = 16; range, 95%–100%), and the chemical purity was 76% ± 20% (n = 16; range, 27%–96%). The following radio–high-performance liquid chromatography (HPLC) system components were used: a preparative HPLC system including a Shimadzu LC-20A pump, a Rheodyne 7133i injector with a 2-mL loop, a Knauer K200 ultraviolet detector, a Bioscan flow cell γ-detector, and a laptop computer running the EZStart data acquisition software; as well as an analytic HPLC system consisting of a Shimadzu LC-20A quaternary pump, a Rheodyne 7133i injector, a Shimadzu SPD-M20A PDA or SPD-20A ultraviolet detector, a Bioscan flow cell γ-detector, and a personal computer with Shimadzu Class VP 7.2 software used for system control. 11CO2 was produced through the 14N(p,α)11C nuclear reaction by bombardment of a high-pressure target containing a mixture of nitrogen and oxygen (0.5%–1%) with a 16.8-MeV proton beam that was produced by a PETTrace cyclotron (GE Healthcare). 11C-methyl iodide was synthesized by the gas-phase method from 11CO2 using the FXMeI or the FXC module (GE Healthcare), was swept with helium at 20 mL/min into an acetone/ice bath-cooled reaction vial containing a solution of the boronic ester precursor 1 (2.5–3 mg) along with a catalytic amount of Pd(dppf)Cl2 (0.8–1.2 mg), and cesium carbonate (3–4 mg) in 4:1 N,N-dimethylformamide (DMF):water. The reaction vial was then heated during stirring at 100ºC for 5 min. The resulting solution was cooled, diluted with about 1.7 mL of the semipreparative HPLC buffer solution of the intermediate 2, and then purified by semipreparative HPLC (Gemini C18, 5 μm, 75:25 acetonitrile:0.1 M ammonium formate containing 0.5% acetic acid [pH 4.2–4.3], and a flow rate of 2 mL/min for 3 min, followed by 5 mL/min). The radioactive intermediate 2 fraction (tR, 13–14 min) was collected in a plastic syringe containing 10 mL of dionized water and then was loaded onto a Waters C18 SepPak. After drying of the SepPak with argon gas, intermediate 2 was eluted from the SepPak with 1–1.2 mL of DMF into a reaction vial containing 400 μL of 12N KOH, and the mixture was heated at 100°C for 5 min. The resulting solution was cooled, diluted with a mixture of 250 μL of acetic acid and 500 μL of the semipreparative HPLC buffer solution of 3, and then purified by semipreparative HPLC (Luna C18, 5 μm, 70:30 ethanol [190 proof, U.S. Pharmacopeia (USP) grade]:saline [USP grade] containing 0.5% acetic acid [pH 3.2], and a flow rate of 5 mL/min). The desired radioactive product 3 fraction was collected (tR, 5–6 min) into a sterile syringe barrel containing 2 mL of USP saline, and the resulting mixture was then passed through a sterile membrane filter (0.22 μm) for terminal sterilization and collected in a sterile vial containing 18 mL of sterile USP saline and 100 μL of sterile USP sodium bicarbonate (4.2%) to afford a formulated intravenous solution of 11C-BMT-136088 3 ready for dispensing and administration. The chemical purity, radiochemical purity, and molar activity of 3 were determined by analytical HPLC (Phenomenex Prodigy C18, 5 μm, 100 Å, 4.6 × 250 mm; mobile phase, 60% acetonitrile and 40% 0.1 M aqueous ammonium formate solution containing 0.5% acetic acid [pH 4.2]; flow rate, 2 mL/min; ultraviolet detector wavelength, 300 nm). The identity of 11C-BMT-136088 was confirmed by coinjection with unlabeled BMT-136088.

Radiosynthesis of 11C-BMT-136088.
PET Data Acquisition
PET scans were performed on a whole-body PET/CT scanner (Biograph mCT; Siemens Medical Systems).
For the test–retest and self-blocking studies, each monkey underwent 2 scans per day, with 11C-BMT-136088 injections 4.5 ± 0.3 h apart. After a low-dose CT scan for attenuation correction and delineation of the lung regions of interest (ROIs), 11C-BMT-136088 was injected with a bolus-plus-infusion protocol, with an initial 3-min bolus. The volume injected during the initial bolus represented 100 min worth of infusion in the test–retest study and 300 min worth of infusion in the self-blocking study. The first test–retest study was performed using polyethylene tubing to inject the radiotracer. After we noticed that 29% ± 2% of the activity was not injected but remained in the tubing, polytetrafluoroethylene tubing was used to inject the tracer in all following studies. The initial bolus was increased from 100 to 300 min in the self-blocking studies after analysis of the data from the second test–retest study (the first one with polytetrafluoroethylene tubing) to reoptimize the bolus-plus-infusion protocol to achieve the flattest time–activity curves (11). With polytetrafluoroethylene tubing, the activity lost in the injection line was negligible: 1% ± 5%. Molar activity at the time of injection was 280 ± 35 MBq/nmol (n = 12). The injected dose was 126 ± 45 MBq (n = 12), and the injected mass was 40 ± 19 ng/kg (n = 7; for tracer dose studies only). For the self-blocking studies, lower molar activity was achieved by added unlabeled BMT-136088 to the injection syringe. The injected mass then ranged from 10 to 865 μg/kg for the nontracer dose scans (n = 5). Beginning at the start of each injection, a 120-min time-of-flight list-mode acquisition was performed. Dynamic PET scan data were reconstructed with corrections for point-spread function, attenuation, normalization, scatter, randoms, and dead time using a 3-dimensional ordinary Poisson ordered-subset expectation-maximization time-of-flight algorithm. PET images were reconstructed into 33 frames (same timing as in a previous report (12)). Each frame contained 400 × 400 × 111 (x,y,z) voxels 2.04 × 2.04 × 2.0 mm in size.
For the dosimetry studies, after a low-dose CT scan was obtained for attenuation correction, 11C-BMT-136088 was injected as a 1-min bolus. Molar activity at the time of injection was 228 ± 127 MBq, the injected activity was 135 ± 30 MBq, and the injected mass was 84 ± 89 ng/kg (n = 4). The subjects were scanned for about 2 h in a sequence of 14 passes with 4 bed positions each, covering the top of the head to the mid thigh.
Arterial Blood Measurements
Arterial blood samples were drawn from a catheter inserted in a limb artery to measure the whole-blood and plasma radioactivity curves, the metabolite-corrected plasma curve, and the plasma free fraction (fP), as previously described (12,13), with modifications for the HPLC methods. Aliquots of plasma drawn at 3, 8, 15, 30, 60, and 90 min after injection were treated with urea (8 M) and then filtered through 1.0-μm Whatman 13-mm GD/X syringe filters (GE Healthcare). Up to 6 mL of plasma filtrate were injected onto the automatic column-switching HPLC system, equipped with a capture column (19 × 4.6 mm) packed with Phenomenex SPE C18 Strata-X sorbent and eluting with 1% acetonitrile in water at a flow rate of 2 mL/min. After 4 min, activity trapped on the capture column was back-eluted onto a Phenomenex Luna C18(2) analytical column (5 μm, 4.6 × 250 mm) eluting with a mobile phase of 52.5% acetonitrile and 47.5% 0.1 M ammonium formate (v/v) at a flow rate of 1.75 mL/min. In 1 test–retest study, arterial blood sampling was not available and was replaced with venous blood sampling.
ROI Delineation
The lung ROIs were semiautomatically delineated using CT images collected before each PET scan. First, the lungs were segmented on the basis of the Hounsfield scale (−1,000 < HU < −200), using a region-growing algorithm and manually placed seeds; then, the trachea was manually excluded, and slices that were 10 mm or less above the top of the liver dome were discarded; finally, the segmented lung ROIs were divided into right and left ROIs by manually selecting a sagittal plane.
Additional ROIs were drawn using CT images for the right atrium, right and left ventricles, aorta, and inferior (for leg vein injections) or superior (for arm vein injections) vena cava on early PET images (0–5 min after injection) to evaluate input functions for the lungs. An ROI was also drawn on the liver, the organ with the highest uptake.
Density Correction for Lung ROIs
It is critical to correct image data measured in the lung for the effect of tissue density, as shown in previous studies (14,15). Indeed, the time–activity curves were originally computed for each ROI and expressed in kBq/cm3. The lung ROI contains tissue, blood, and air, and net lung density can vary from scan to scan because of changes in animal positioning (e.g., variations due to changes in the left–right location of the heart, which can compress one side of the lungs and expand the other). Therefore, the density of lung ROIs was estimated to convert the lung time–activity curve units from kBq/cm3 to kBq/g, as follows. The CT images were converted from the Hounsfield unit scale to linear attenuation values (in cm−1) for 511-keV photons as described previously (16). These attenuation values were assumed to be linearly proportional to mass for soft tissue, and the heart density was assumed to be 1 g/cm3. The size and the estimated density and mass of each lung ROI are listed in Supplemental Table 1 (supplemental materials are available at http://jnm.snmjournals.org).
Quantification of VT Values
VT values were estimated using kinetic modeling and equilibrium analysis (EA). For kinetic modeling, 3 compartmental models and multilinear analysis 1 (MA1) (17) were tested. The 3 compartmental models were the 1- and 2-tissue-compartment models (1TC and 2TC, respectively) and a model with 1 tissue compartment for 11C-BMT-136088 and 1 tissue compartment for all metabolites (1P1MC model). In that last model, all metabolites were assumed to enter and exit the tissue with the same rate constants. For the other models, it was assumed that no radioactive metabolites enter lung tissue. The MA1 method was modified to include a blood volume correction, using a fixed vascular fraction of 0.5 based on the reported 0.92 value of the ratio of extravascular lung mass to blood volume in healthy humans (18). The operational equation for the modified MA1 method was… Eq. 1where CPET, CP, and CWB denote the lung time–activity curve (after density correction), the metabolite-corrected plasma time–activity curve, and the whole-blood radioactivity time–activity curve, respectively, and FV denotes the fixed vascular fraction.
For EA, VT was computed as follows: Eq. 2In all analyses, the arterial whole-blood and metabolite-corrected plasma curves were corrected for the delay (δ) between the right ventricle and the arterial sampling point. δ was estimated by fitting the right ventricle curve with a shifted and scaled arterial blood curve:
 Eq. 3where i,
  , A,
, A,  , and
, and  represent the frame index, the right ventricle time–activity curve, a scale factor, the frame start time, and the frame duration, respectively. δ and A were estimated to be 6.1 ± 3.6 s and 1.11 ± 0.07, respectively.
Test–Retest Variability of 11C-BMT-136088 VT Estimates
The within-day variability of 11C-BMT-136088 VT estimates was estimated by computing the test–retest variability as… Eq. 4The between-day variability of 11C-BMT-136088 VT estimates was estimated by computing the average within-subject and within-ROI coefficients of variation across tracer dose (nonblocking) studies on different days.
Analysis of 11C-BMT-136088 Self-Blocking Study
The unlabeled drug dose and plasma concentration (ID50 and IC50, respectively) leading to a 50% reduction of 11C-BMT-136088 specific binding were estimated by plotting the estimated VT values versus the injected masses of BMT-136088 and fitting the resulting curves with the following models: Eq. 5
Eq. 5 Eq. 6where VND is the nondisplaceable volume of distribution and VS is the specific volume of distribution (10). The nondisplaceable binding potential (BPND) (10) was computed from these 2 parameters as VS/VND. Data for each monkey and each lung (right or left) were analyzed separately or together to determine whether they were compatible with a single model (using the F test for statistical analysis).
RESULTS
Blood Compartment
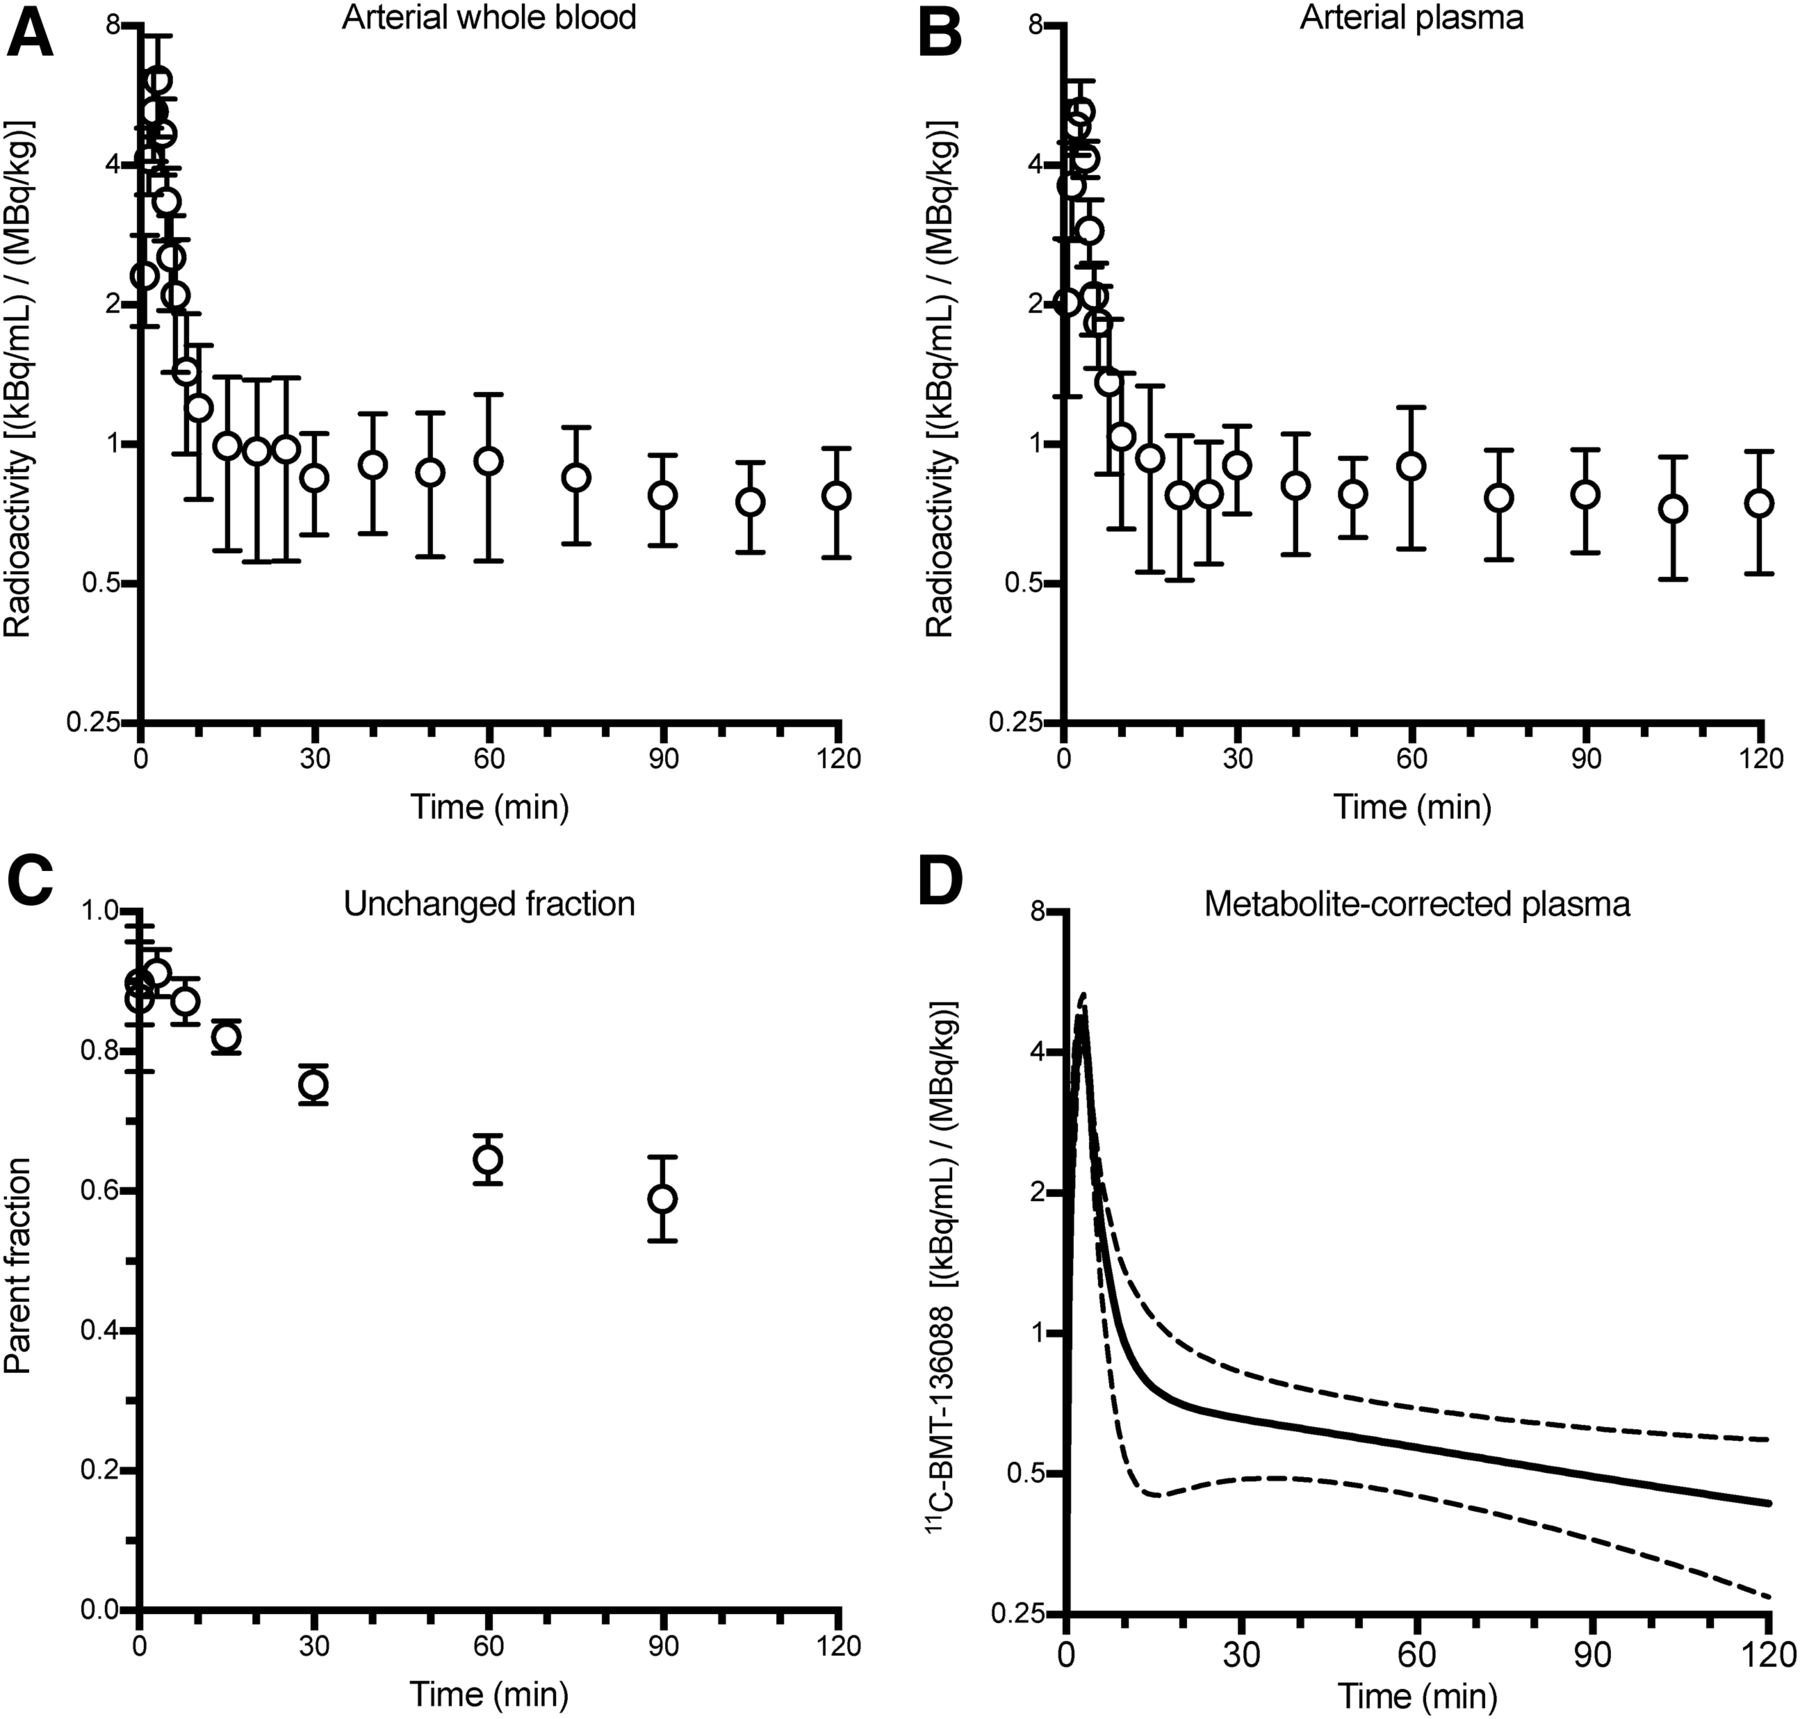
The distribution of radioactivity in the body after a baseline injection of 11C-BMT-136088 is shown in Figure 2. The radioactivity curves in arterial whole blood and plasma are shown in Figure 3, as well as the fraction of unchanged 11C-BMT-136088 in arterial plasma and the metabolite-corrected arterial plasma concentration. The ratio of whole-blood radioactivity to plasma radioactivity was 1.18 ± 0.27 at the beginning of the scans (0–3 min after injection, n = 10) and 1.05 ± 0.15 at the end of the scans (90–120 min after injection, n = 10). The unchanged fraction was 91% ± 3% (n = 10) at 3 min after injection, 75% ± 3% (n = 10) at 30 min after injection, and 59% ± 6% (n = 10) at 90 min after injection. fP was very low, at 0.19% ± 0.06% (n = 10).
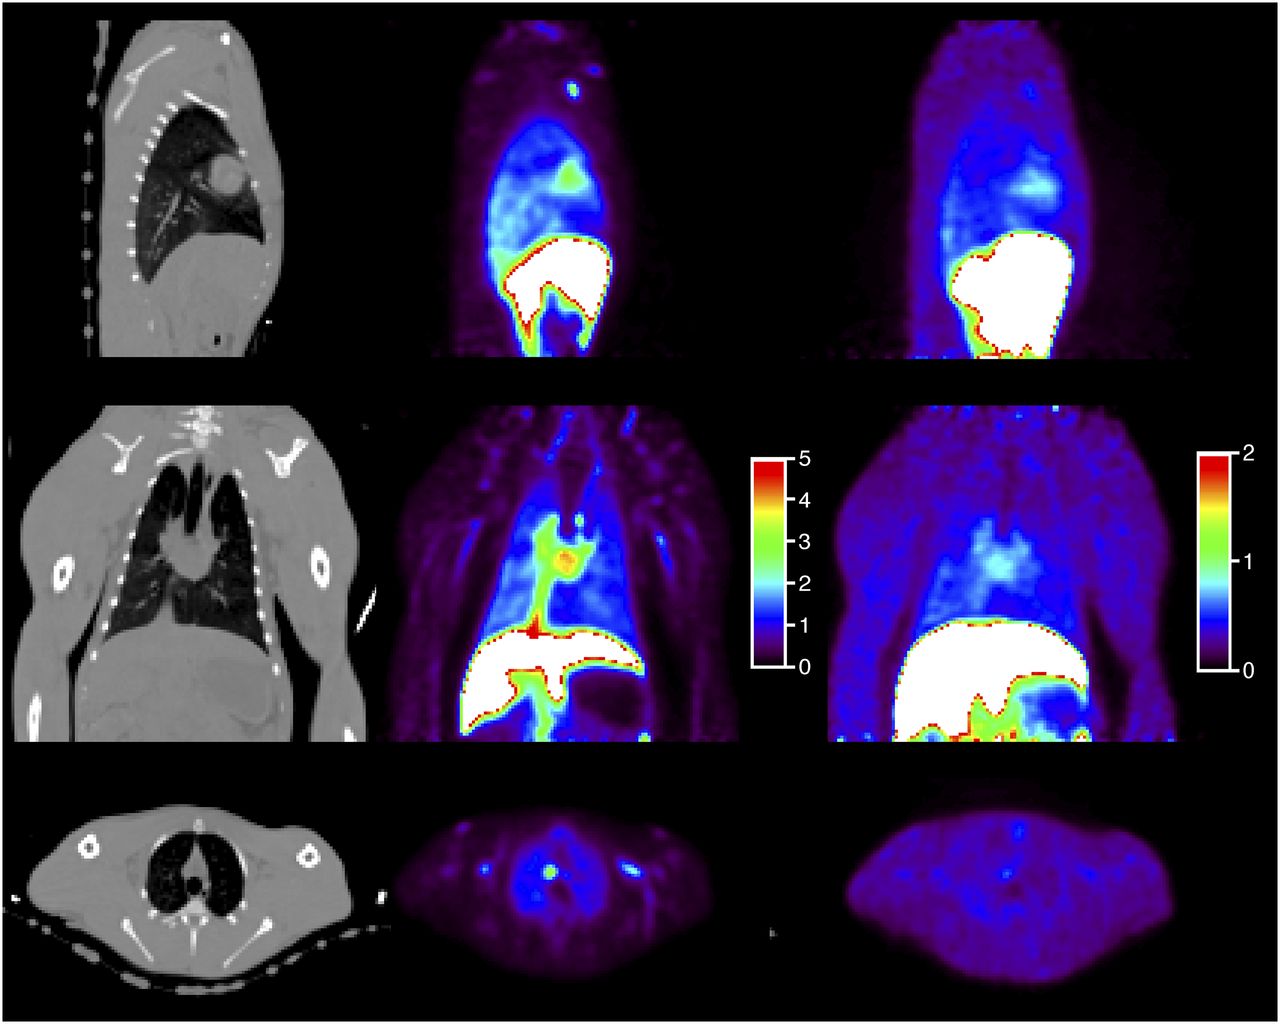
From top to bottom, sagittal, coronal, and transverse views of CT images (left), PET images showing early 11C-BMT-136088 distribution (0–5 min after injection, center), and PET images showing late 11C-BMT-136088 distribution (40–60 min after injection, right). Color scale represents SUV.

Average whole-blood (A), plasma (B), unchanged fraction (C), and metabolite-corrected plasma (D) curves (n = 10 scans with arterial blood sampling). Error bars (A–C) or dashed lines (D) represent SD across studies.
Tissue Compartments
The density, estimated using the CT images, of the right and left lung ROIs was 0.33 ± 0.02 and 0.32 ± 0.01 g/cm3, respectively, in the first monkey (n = 6) and 0.46 ± 0.04 and 0.42 ± 0.03 g/cm3, respectively, in the second monkey (n = 6).
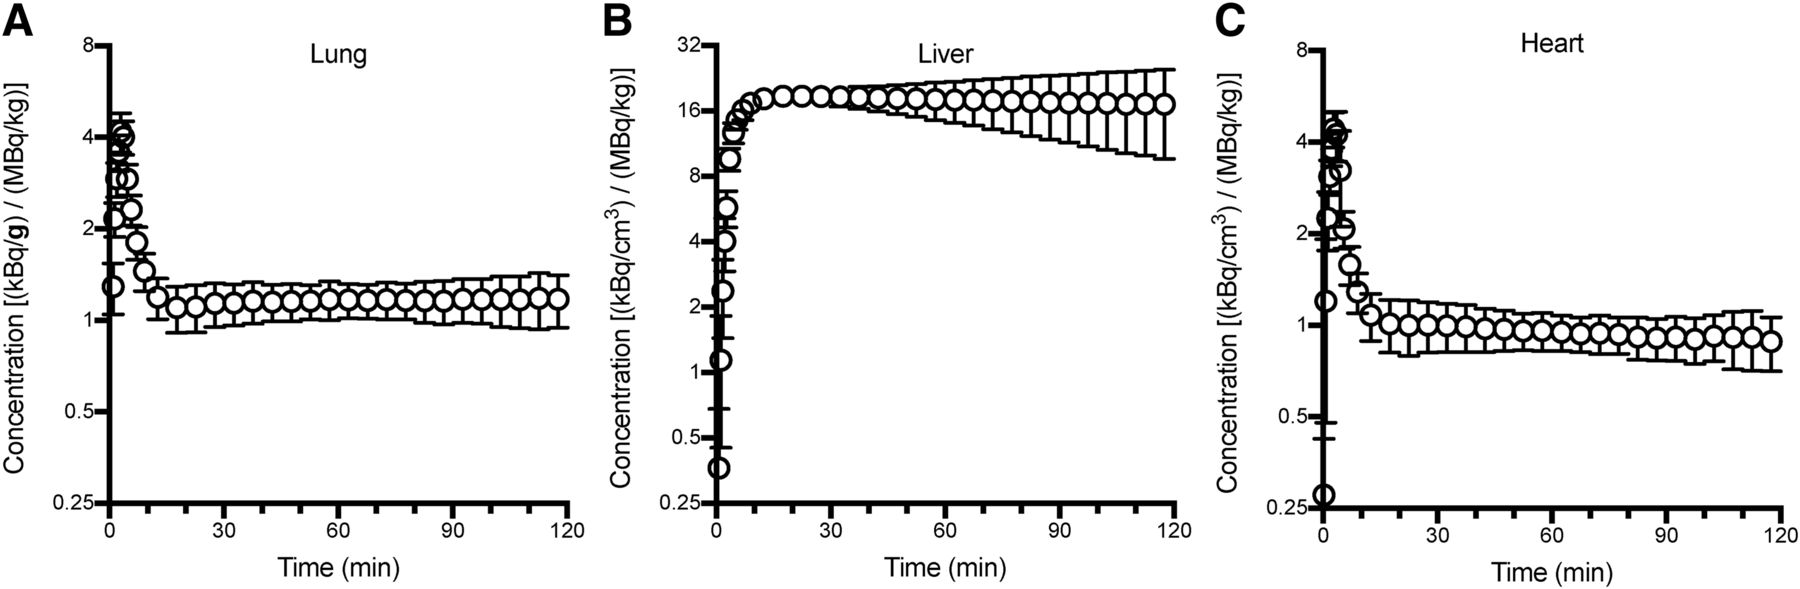
Time–activity curves for the lung, liver, and heart from tracer dose studies are shown in Figure 4. The highest uptake was seen in the liver: the SUV was 18 ± 4.7 during the interval from 30 to 120 min after injection (n = 7). During the same interval, the SUV in lung was 1.2 ± 0.15 on both sides (density-corrected values). The percentage change per hour (computed over the same interval) was −5% ± 17%, −3% ± 17%, −11% ± 18%, and −11% ± 16%/h in the right and left lungs, liver, and heart, respectively (n = 12), and −23% ± 19%/h (n = 10) for the metabolite-corrected arterial plasma concentration. Thus, equilibrium was apparently reached in the lung on average but not in the arterial plasma.

Lung (A), liver (B), and heart (C) time–activity curves from tracer dose studies (n = 7). Error bars represent SD across studies.
Kinetic Modeling
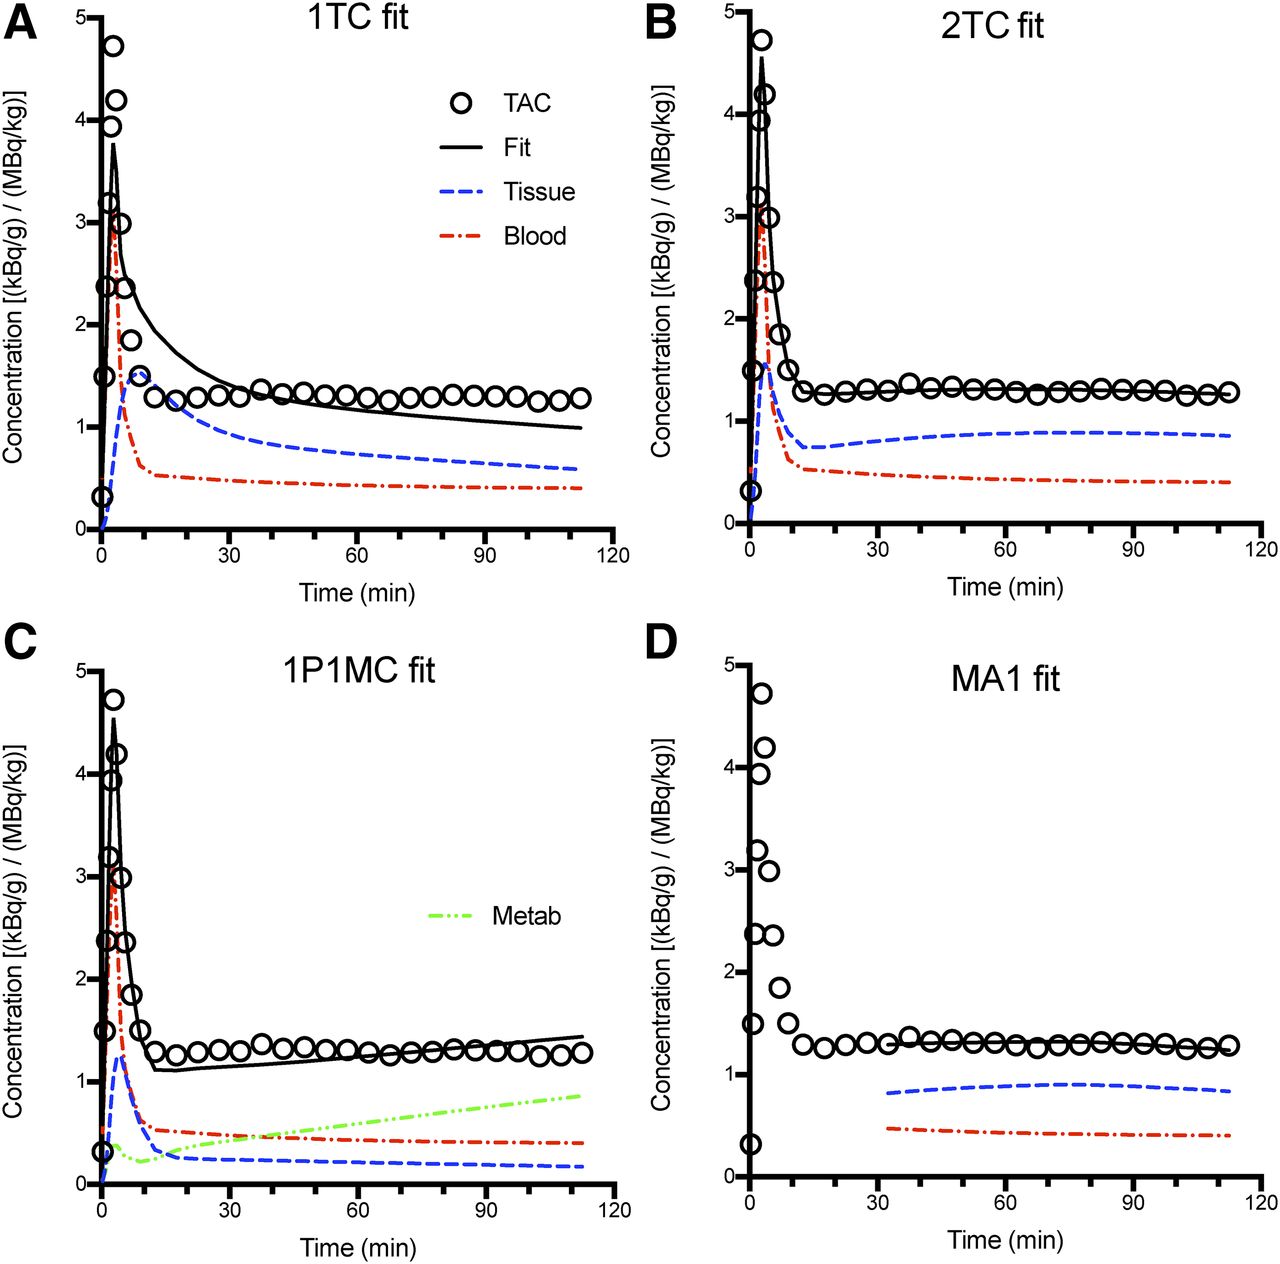
Representative fits obtained with the 1TC and 2TC models (which assume only parent tracer enters the lungs) and the 1P1MC model (with 1 metabolite compartment) are shown in Figure 5.

Model fits of lung time–activity curves: 1TC (A), 2TC (B), 1P1MC (C), and MA1 with blood volume correction (D) fits. Open circles represent measured PET data, solid black lines represent best fit, dashed red lines represent blood contribution, blue dashed lines represent modeled (parent) activity in lung tissue, and green dashed line represents modeled activity in lung due to metabolites.
Better fits were obtained with the 2TC model than with the 1TC and 1P1MC models: the reduced residual sum of squares and the Akaike information criterion were always lower for the 2TC model than for the 1TC model (P < 0.0001, Wilcoxon matched-pairs signed-rank test, n = 20, for both metrics); the same metrics were lower for the 2TC model than for the 1P1MC model for 16 of 20 lung time–activity curve fits (P < 0.005, Wilcoxon matched-pairs signed-rank test, n = 20). However, because of the complexity of the 2TC model (4 estimated parameters), the VT estimates were not precise (%SE was 5%–60%, with a median of 7%). Thus, we tested MA1, which provides a compromise between the accuracy of fits and the stability of parameter estimates (VT %SE was 1%–7%, with a median of 2%). Because of the high fraction of blood in the lungs, a modified version of MA1 was used, incorporating a fixed (50% by mass) correction for blood radioactivity. The average VT estimates in the right and left lungs were 1.8 ± 0.19 and 1.9 ± 0.13 mL/g, respectively, for tracer dose studies (n = 5). The average 2TC K1 estimates at baseline in the right and left lungs were 0.33 ± 0.26 and 0.35 ± 0.32 mL/min/g, respectively.
EA was also tested to quantify VT. EA tended to overestimate VT compared with MA1. The mean EA VT in the right and left lungs was 2.1 ± 0.55 and 2.1 ± 0.56 mL/g, respectively, for tracer dose studies (n = 7). The slope of the regression line between EA VT values and MA1 VT values was 1.21 ± 0.23 (intercept, −0.04 ± 0.35; r2 = 0.611; n = 20).
Test–Retest Study
The within-day test–retest variability of VT with MA1 could be estimated for only 1 monkey because of missing arterial data in the other animal. In this animal, the test–retest variability was −8% and −5% in the right and left lung ROIs, respectively. With EA, test–retest variability was computed for both animals, using venous data for the animal that was missing arterial data. Test–retest variability was −1% ± 11% and −2% ± 10% in the right and left lungs, respectively. The between-day coefficient of variation of 11C-BMT-136088 VT estimates was 10% with MA1 and 17% with EA. Because of this lower coefficient of variation, MA1 was the method selected for the analysis of 11C-BMT-136088 (self-) saturation study. The excess variability of EA VT values, and the fact that EA VT values were higher than MA1 VT values, is likely due to fact that the tracer concentration could not be made constant in the plasma and the lung at the same time, violating EA hypotheses.
Saturation Study
The relationship between the mass of 11C-BMT-136088 administered during the saturation study and the plasma levels of 11C-BMT-136088 was linear, with a slope of 0.92 nM/(μg/kg) (r2 = 0.999, n = 5) (Supplemental Fig. 1A), and thus, the relationship between 11C-BMT-136088 VT and 11C-BMT-136088 injected mass (Supplemental Fig. 1B) was visually similar to the relationship between 11C-BMT-136088 VT and 11C-BMT-136088 plasma levels (Fig. 6). Both relationships could be fitted with a 1-saturable-site model, with identical parameters for both animals and both lung ROIs (right and left) (F9,4 = 0.24, P = 0.96, for VT vs. mass, and F9,4 = 0.26, P = 0.93, for VT vs. plasma concentration). The IC50 and ID50 of 11C-BMT-136088 were estimated to be 28 ± 12 nM and 36 ± 15 μg/kg, respectively. For the average fP value of 0.19%, the in vivo dissociation constant of 11C-BMT-136088 was computed as 55 pM. VND was estimated to be 0.9 ± 0.93 mL/g, and BPND was estimated to be 1.1 ± 0.14, meaning that specific binding of 11C-BMT-136088 in the lung represents 52% of the blood contribution–corrected radioactivity concentration in the lung at equilibrium.

Relationship between 11C-BMT-136088 VT values and plasma levels of BMT-136088. Data from both animals (A1 and A2) and from both sides (right and left) of chest could be fitted by same curve. Solid line represents fit to Equation 6.
Dosimetry
Dosimetry studies were analyzed as previously described (19). Supplemental Table 2 shows the mean absorbed doses. Under Code of Federal Regulations 361.1.1, the liver is the dose-limiting organ, with a single-study dose limit of 1,160 MBq for a man and 726 MBq for a woman. Thus, multiple injections per year can be administered to healthy subjects.
DISCUSSION
In this study, we evaluated the properties of the novel radiotracer 11C-BMT-136088 for imaging LPA1 receptors in the lung. We used quantitative modeling techniques accounting for lung blood volume, and we found that the tracer binds to LPA1 and that we could determine the in vivo dissociation constant and the tracer’s BPND.
Arterial data sampled from a limb artery were used as the input function for modeling. This is not the actual input function for the lung, which should ideally be measured from the pulmonary artery or the right ventricle. However, because of this tracer’s properties, arterial data are a reasonable alternative lung input function. The image-derived whole-blood time–activity curves from the right and left ventricles were very similar (Supplemental Fig. 2) because of the low uptake of this tracer in the lung: K1 was about 0.3 mL/min/g; by comparison, in nonanesthetized human subjects at rest, pulmonary perfusion measured with 15O-water is at least 1.2 mL/min/mL (20,21), which would be at least 3.0 mL/min/g assuming a lung density of 0.40 g/mL. In anesthetized pigs, pulmonary blood flow was estimated to be 0.59 mL/min/mL (or 1.5 mL/min/g assuming a lung density of 0.40 g/mL) (22). Thus, the exit curve (i.e., the left ventricle time–activity curve, and subsequently limb arterial data) is similar to the input curve (i.e., the right ventricle). The inferior vena cava is another promising ROI for measuring the lung input function if the radiotracer is injected in a leg vein (Supplemental Fig. 2).
For imaging studies outside the brain, the possibility of metabolites entering the tissue should be considered. In this study, we tested a simple model with 1 tissue compartment for the parent tracer and 1 tissue compartment for metabolites. This model did not provide good fits, implying that more compartments are needed for parent or metabolites. However, such models would be too complex to obtain stable VT estimates. Moreover, it is unlikely that these models could be used without a priori data about the parent fraction in tissue, and such data can be obtained only with ex vivo measurements.
For studies on the lung, density correction is critical to obtain reproducible and reliable data. Density correction was especially important because the effects of animal positioning on the position of the heart in rhesus monkeys led to differences in compression and expansion of the right and left lungs from scan to scan. In future studies involving idiopathic pulmonary fibrosis (IPF) patients or animal models, density correction would also be needed to take into account the increased density in the diseased state (14,15). In this study, density correction was based on CT data, which were acquired over the duration of 1–2 breathing cycles and applied on a whole-ROI basis. For studies on humans, care should be taken to obtain CT data representative of an average whole cycle to match the PET data or from a fixed and reproducible part of the cycle to minimize breathing-based variability in the density correction. Methods have been proposed to coregister 2 CT images taken at different parts of the breathing cycle and preserve the lung tissue mass during that registration (23); however, it is simplest if such a mismatch is avoided whenever possible. For parametric imaging of the lung, it is likely that even more care would be needed to obtain reliable per-voxel density estimates (15).
A final correction that is needed in lung studies is one to account for blood radioactivity. Indeed, blood volume in the lung is high, with about 50% of the total mass of the lungs being attributed to blood. Using 11C-CO, Rhodes et al. measured a ratio of 0.92 for extravascular lung volume to blood volume in healthy humans (18), which translates to a fractional mass of blood of 52%. Thus, blood volume correction is potentially needed for all tracers in the lung. Here, the radioactivity concentration of 11C-BMT-136088 in whole blood was on the same order of magnitude as that of 11C-BMT-136088 in the lung (SUVs were 0.74 ± 0.13 in blood vs. 1.2 ± 0.15 in lung for tracer dose studies); thus, blood volume correction has a large effect on the data. In addition, in the blockade studies, drug administration tended to increase radioactivity in whole blood, which would have reduced the apparent reduction of 11C-BMT-136088 VT values if blood volume correction had not been applied. These last 2 properties of 11C-BMT-136088 make blood volume correction especially important for this tracer. In this study, we used a fixed vascular fraction of 0.5 mL/g, as it is the previously estimated typical fraction of blood in the lung, by mass, in healthy humans. This value was also close to the average fitted value (0.52 ± 0.22 mL/g) obtained when vascular fraction was estimated in 1TC fits of the first 11 min of lung time–activity curves.
The presence of saturable (displaceable) signal could be verified with the self-blocking study, and 11C-BMT-136088 is a high-affinity LPA1 antagonist in vitro. However, future work is still needed to verify its selectivity in vivo, using well-characterized, subtype-selective antagonists for various lysophosphatidic acid receptors to block 11C-BMT-136088 binding.
This study showed that 11C-BMT-136088 is a potentially useful radioligand for imaging LPA1 receptors in the lung. However, human studies will be needed to confirm its suitability. The density of LPA1 in healthy humans is unknown, but EDG-2 expression is detectable in healthy humans (2), though relatively low in the lung compared with other organs. In IPF, the concentration of lysophosphatidic acid is increased in the bronchoalveolar lavage fluid, and LPA1-expressing fibroblasts are present, whereas they are absent in healthy controls (4). Thus, 11C-BMT-136088 may be a useful tracer to detect potential upregulation of LPA1 receptors in the lungs of IPF patients. One caveat is that IPF is most prevalent in the lower lung at the beginning of the disease (24,25); therefore, correction of respiratory motion will be needed, and spill-in from the liver could affect quantification.
Future studies on rodents are also needed to evaluate the usefulness of 11C-BMT-136088 in animal models of IPF (26). One drawback of 11C-BMT-136088 is its high uptake in the liver, which makes PET quantification difficult in the lower parts of the monkey lung, and which will be worse in smaller animals if high liver uptake is also seen in these species. 11C-BMT-136088 may also be useful for studying the involvement of LPA1 receptors in fibrosis in organs other than the lung, such as the kidney, where LPA1 activation has been shown to promote interstitial fibrosis (6).
Finally, since 11C-BMT-136088 specific binding is clearly saturable, with a BPND of about 1.1, this study showed that 11C-BMT-136088 is a suitable radioligand to verify target engagement and quantify the IC50 or ID50 of drugs targeting LPA1 in preclinical studies on rhesus monkeys.
CONCLUSION
11C-BMT-136088 is the first available radioligand for quantifying the density of LPA1 receptors in the lung with PET. It is also suitable for preclinical drug occupancy studies on rhesus monkeys. These findings warrant further evaluation of this radioligand in animal models of fibrosis and in patients.
DISCLOSURE
No potential conflict of interest relevant to this article was reported.
Footnotes
Published online Sep. 1, 2017.
- © 2018 by the Society of Nuclear Medicine and Molecular Imaging.
REFERENCES
- Received for publication April 28, 2017.
- Accepted for publication August 22, 2017.


Jump to section
Related Articles
Cited By...
- No citing articles found.