


Abstract
11C-preladenant is a selective antagonist for mapping of cerebral adenosine A2A receptors (A2ARs) by PET. This is a first-in-human study to examine the safety, radiation dosimetry, and brain imaging of 11C-preladenant in healthy human subjects. Methods: Dynamic 11C-preladenant PET scans (90 min) were obtained in 5 healthy male subjects. During the scan, arterial blood was sampled at various time intervals, and the fraction of the parent compound in plasma was determined. For anatomic coregistration, T1-weighted MRI was performed. The total distribution volume (VT) was estimated using 1- and 2-tissue-compartment models (1T and 2T, respectively). The distribution volume ratio (DVR) was calculated from VT of target and reference region and obtained with a noninvasive Logan graphical reference tissue method (t* = 30 min). The applicability of a shortened protocol as an alternative to the 90-min PET scan was investigated. Tracer biodistribution and dosimetry were determined in 3 healthy male subjects, using serial whole-body PET scans acquired over 2 h after 11C-preladenant injection. Results: There were no serious adverse events in any of the subjects throughout the study period. 11C-preladenat readily entered the brain, with a peak uptake in the putamen and head of the caudate nucleus 30−40 min after tracer injection. Other brain regions showed rapid clearance of radioactivity. The regional distribution of 11C-preladenant was consistent with known A2AR densities in the brain. At pseudoequilibrium (reached at 40 min after injection), stable target–to–cerebellar cortex ratios of around 3.8−10.0 were obtained. The 2T fit better than the 1T in the low-density A2AR regions. In contrast, there were no significant differences between 1T and 2T in the high-A2AR-density regions. DVRs in the putamen and head of the caudate nucleus were around 3.8−10.3 when estimated using a Logan graphical reference tissue method with cerebellum as the reference region. PET scanning at 50 or 70 min can provide the stable DVR estimates within 10% or 5% differences at most, respectively. The radioactivity was mainly excreted through the hepatobiliary system after 11C-preladenant injection. As a result, the absorbed dose (μGy/MBq) was highest in the gallbladder wall (mean ± SD, 17.0 ± 2.5) and liver (11.7 ± 2.1). The estimated effective dose for 11C-preladenant was 3.7 ± 0.4 μSv/MBq. Conclusion: This initial evaluation indicated that 11C-preladenat is suitable for imaging of A2ARs in the brain.
Adenosine acts as an endogenous modulator of synaptic function through adenosine receptors (ARs) in the central nervous system (1,2). ARs are members of the G-protein–coupled superfamily (3) and are divided into at least 4 subtypes: A1, A2A, A2B, and A3 (4–6). Postmortem studies showed that A2A receptors (A2ARs) are abundant in the putamen, caudate nucleus, nucleus accumbens, and globus pallidus pars lateralis (7). A2ARs are known to stimulate adenylate cyclase and interact negatively with dopamine D2 receptors at the level of second messengers and beyond (8). A2ARs also have a key role in adenosine-mediated sleep-promoting effects (9). In addition, A2ARs are involved in many neuropsychiatric disorders such as Parkinson disease, Huntington disease, Alzheimer disease, drug addiction, alcohol abuse, epilepsy seizures, sleep disorders, and schizophrenia (10). Notably, selective A2AR antagonists have been tested for nondopaminergic treatment of Parkinson disease (11), resulting in the approval of istradefylline as an antiparkinsonian agent in Japan in 2013 (12).
Noninvasive in vivo imaging of A2ARs with PET represents a potentially useful method for monitoring changes in A2AR density during the disease course and the assessment of receptor occupancy of investigational drugs. Several compounds have been tested as PET tracers for A2AR imaging in human subjects (13–16). Among them, 7-(2-(4-(4-(2-18F-fluoroethoxy)phenyl)piperazin-1-yl)ethyl)-2-(furan-2-yl)-7H-pyrazolo[4,3-e][1,2,4]triazolo[1,5-c]pyrimidin-5-amine (18F-MNI-444) seems to have the best properties as an A2AR imaging agent so far, with highest target-to-nontarget ratios (putamen-to-cerebellum ratio at 60−90 min, 5.0) (16). 18F-MNI-444 is the 18F-fluoroethoxy derivative of 2-(furan-2-yl)-7-(2-(4-(4-(2-methoxyethoxy)phenyl)piperazin-1-yl)ethyl)-7H-pyrazolo[4,3-e][1,2,4]triazolo[1,5-c]pyrimidin-5-amine (preladenant), which has already been tested in phase III clinical trials as a potential treatment for Parkinson disease.
Recently, Zhou et al. developed 11C-preladenant for use as a PET tracer and showed a high striatum-to-cerebral ratio in rats by PET imaging (17). In vivo blocking and A2AR quantification in rat PET studies showed that 11C-preladenant is a suitable tracer to quantify striatal A2AR density and assess A2AR occupancy by istradefylline (18). The toxicologic profile of preladenant in humans is already known from clinical phase I/II/III studies, in which preladenant was investigated as a drug for the treatment of Parkinson disease (19). We conducted an additional preclinical safety and radiation dosimetry study of 11C-preladenant (supplemental materials, Supplemental Tables 1–3; supplemental materials are available at http://jnm.snmjournals.org). The radiation absorbed dose estimated from mouse distribution data was highest in the small intestine, but the effective dose was somewhat lower than that obtained from rat data (20). Nevertheless, the effective dose was similar in magnitude to most other 11C-labeled PET tracers (21). The absence of any abnormalities in rats in the acute toxicity test of 11C-preladenant injections demonstrated the clinical suitability of 11C-preladenant for use in PET studies in humans. These findings prompted us to undertake an initial evaluation of 11C-preladenant in human subjects as a phase I study. Here, we report the first-in-human study to examine the safety, radiation dosimetry, and brain imaging of 11C-preladenant in healthy human subjects.
MATERIALS AND METHODS
Subjects
All experiments were approved by the Tokyo Metropolitan Institute of Gerontology institutional review board and were performed in accordance with the institutional review board rules and policies. All subjects gave study-specific informed consent to participate in the study, and all experiments were performed in accordance with the relevant guidelines. The study was registered in UMIN-CTR (UMIN000019999) on November 30, 2015. Eight healthy male volunteers, aged 21−25 y (mean age ± SD, 23 ± 1 y), were enrolled in this study (Supplemental Table 4). Although there were no restrictions of diet, all subjects were required to refrain from drinking caffeinated beverages up to 12 h before PET imaging. Five of the 8 subjects were recruited into the safety monitoring and dynamic brain PET study. The subjects weighed 61.0−72.2 kg (mean weight ± SD, 63.7 ± 5.9 kg). For anatomic coregistration, MRI was performed using a Discovery MR750w 3.0T scanner (GE Healthcare). A 3-dimensional (3D) fast spoiled gradient-echo (repetition time, 7.6 ms; echo time, 3.1 ms; inversion time, 400 ms; matrix, 256 × 256 × 196 voxels) T1-weighted whole-brain image was acquired for each subject. The other 3 subjects participated in the whole-body PET distribution study. The subjects weighed 62.5−86.1 kg (mean weight ± SD, 71.5 ± 12.8 kg). All subjects were free of somatic and neuropsychiatric illnesses, according to their medical history and the findings of physical examination, and had no brain abnormalities on MRI.
Preparation of 11C-Preladenant
11C-preladenant was prepared by O-methylation of the corresponding desmethyl precursor using 11C-methyl iodide in the presence of potassium hydroxide according to a previously described procedure (17) with slight modification. Details on the methods, results, and quality control data of 11C-preladenant preparations are provided in the supplemental materials.
Safety Monitoring
Safety data were collected after administration of 11C-preladenant and throughout the follow-up period of 1 wk in 5 subjects. Safety monitoring included the recording of adverse events, changes in vital signs, physical examination, electrocardiogram, and laboratory parameters (serum biochemistry and hematology analyses). The detailed protocol for investigating safety monitoring was the same as that reported previously (22).
Brain PET Scanning
PET scanning was performed using a Discovery PET/CT 710 scanner (GE Healthcare) in 3D mode. This scanner has an axial field of view of 15.7 cm, a spatial resolution of 4.5 mm in full width at half maximum, and a z-axis resolution of 4.8 mm in full width at half maximum. We acquired 47 slices for each 3D reconstruction. After low-dose CT scanning to correct for attenuation, 11C-preladenant (508−691 MBq/9.3−24.3 nmol) was injected into the antecubital vein of each subject as a bolus for 1 min, and a 90-min dynamic scan in 3D mode (20 s × 3 frames, 30 s × 3 frames, 60 s × 5 frames, 150 s × 5 frames, and 300 s × 14 frames) was acquired. Arterial blood (0.5 mL each) was sampled from the catheter that had been placed in the radial artery at 10, 20, 30, 40, 50, 60, 70, 80, 90, 100, 110, 120, 135, 150, and 180 s, as well as at 5, 7, 10, 15, 20, 30, 40, 50, 60, 75, and 90 min. The whole blood and separated plasma were weighed, and radioactivity was measured with a NaI (Tl) well scintillation counter (BeWell Model-QS03 F/B; Molecular Imaging Labo). To analyze the labeled metabolites, an additional 1.5 mL of blood were obtained at 3, 10, 20, 30, 40, and 60 min. Plasma protein binding free fraction could not be measured due to the undesirable adsorption of 11C-preladenant to the ultrafiltration membrane. After the PET scan, urine was obtained from each subject and radioactivity was measured. Unaltered 11C-preladenant and radioactive metabolites in the plasma and urine were determined with high-performance liquid chromatography (HPLC).
Tomographic images were reconstructed using a 3D ordered-subset expectation maximization algorithm (subset, 16; iteration, 4) with incorporated time-of-flight information. The dynamic images were postsmoothed with a gaussian filter of 4 mm in full width at half maximum. The data were reconstructed in a 128 × 128 × 47 matrix, and the voxel size was 2 × 2 × 3.27 mm. Partially overlapping circular regions of interest (ROIs) that were 10 mm in diameter were placed on the frontal and cerebellar cortices, thalamus, putamen, and head of the caudate nucleus with reference to the coregistered MRI (Fig. 1C). Time–activity curves for these ROIs were calculated as Bq/mL or as SUV: (activity/mL tissue)/(injected activity/body weight). Using the time–activity curves of tissues and the metabolite-corrected time–activity curve of plasma, we evaluated the total distribution volume (VT) for 11C-preladenant with the 1-tissue-compartment model (1T) (K1/k2) and 2-tissue-compartment model (2T) (K1/k2 × (1 + k3/k4)). The goodness of fit by the 2-model analyses was evaluated using the Akaike information criterion. The distribution volume ratio (DVR) was calculated as the ratio of VT in the target and reference regions and estimated with Logan graphical reference tissue method (LGRM) (t* = 30 min) (23). The cerebellum was used as a candidate of the reference region. Finally, with the DVRs from LGRM, the applicability of shortened protocols (45, 50, 55, 60, 65, 70, 75, 80, and 85 min) as alternatives to the standard 90-min PET scan for stable DVR quantification was investigated.

Representative 11C-preladenant PET and MR images obtained from 24-y-old male subject. (A) PET images (SUV summed 40−60 min). Radioactivity levels are expressed as SUVs. (B) DVR images from Logan graphical reference tissue method (t* = 30 min). (C) MR images. ROIs are indicated by the red circles: Cb = cerebellar cortex; Cdt = head of the caudate nucleus; Frt = frontal cortex; Put = putamen; Thm = thalamus.
Metabolite Analysis
The parent and metabolites of 11C-preladenant in the plasma sampled at 3, 10, 20, 30, 40, and 60 min and urine recovered at 97−101 min were analyzed by HPLC. The blood was centrifuged at 8,700g for 40 s at 2°C to obtain the plasma, which was denatured with an equivalent volume of 100% acetonitrile (final concentration, 50% acetonitrile) in an ice-water bath. The suspension was centrifuged using the same conditions and divided into soluble and precipitated fractions. The precipitate was resuspended in the same volume of 100% acetonitrile followed by centrifugation. This procedure was repeated twice. Radioactivity in the 3 soluble fractions and precipitates was measured with an auto-γ-counter (LKB Wallac). In this treatment of plasma, less than 4% of the total radioactivity was left in the final precipitates. The soluble fractions were combined and analyzed by HPLC with a radioactivity detector (FLO-ONE 150TR; Packard Instrument). A YMC-Pack ODS-A column (10-mm inner diameter × 250-mm length; YMC) was used with acetonitrile/50 mM aqueous acetic acid/50 mM aqueous sodium acetate, pH 4.5 (80/10/10, v/v/v) at a flow rate of 4 mL/min. The retention time of 11C-preladenant was 8.0 min. The urine sample was directly applied to HPLC.
Whole-Body Imaging
The protocol for investigating radiation dosimetry in human subjects using whole-body imaging was essentially the same as that reported previously (24). Whole-body PET/CT scans were obtained using a Discovery 710 PET/CT scanner in 3D mode. Low-dose CT was used for attenuation correction of the PET emission scan. The first PET acquisition was started 1 min after the intravenous bolus injection of 751 ± 36 MBq (7.1−11.3 nmol) of 11C-preladenant. After the initial whole-body scan, 18-bed-position scans (overlap of 23 of 47 slices per bed position, 15 s/bed position × 4 frames, 30 s/bed position × 12 frames, and 60 s/bed position × 2 frames) from the top of the head to midthigh were obtained. Images were reconstructed using a 3D ordered-subset expectation maximization algorithm (subset, 24; iteration, 2) with a 6.4-mm gaussian filter.
ROIs were manually placed over 15 organs that could be identified from PET or low-dose CT: adrenals, brain, gallbladder, small intestine, stomach, heart wall, kidneys, liver, lungs, pancreas, bone marrow (thoracic and lumbar vertebrae), spleen, thymus, thyroid, and urinary bladder. The decay-uncorrected and decay-corrected time–activity curves of organs were calculated as the percentage injected dose per organ. Then, the normalized number of disintegrations (MBq-h/MBq administered) for each source organ was calculated, which is equal to the area under the time course curve multiplied by the volume of the organ ROI. The volume of bone marrow, in which only part of the organ could be measured, was substituted by the volume, which was calculated from the mass of red marrow in the adult male phantom (1.12 kg for 73.7 kg of body weight) adjusted by the subject’s body weight and 1 g/mL as the specific gravity (25). The area under the time course curve was calculated by summing the area from time 0 to the endpoint and the area from the endpoint to infinity of the uncorrected time–activity curves. The former area was calculated by trapezoidal integration. The latter area was calculated by integration of radioactive decay from the endpoint.
The absorbed doses in 25 target organs of the adult male phantom was estimated from the normalized number of disintegrations of source organs by implementing the MIRD method using OLINDA/EXM (Vanderbilt University) (26). The effective dose was also calculated by OLINDA/EXM using the methodology described in International Commission on Radiological Protection Publication 60 (27).
RESULTS
Safety Monitoring
The mean ± SD of the administered mass of 11C-preladenant was 6.5 ± 3.3 μg (range, 3.6–12.2 μg). The mean ± SD of administered activity was 677 ± 86 MBq (range, 508−786 MBq). The administration of 11C-preladenant was well tolerated by all subjects. There were no adverse or clinically detectable pharmacologic effects in any of the 5 subjects. No clinically important trends indicative of a safety signal were noted for laboratory parameters, vital signs, or electrocardiogram parameters.
Brain PET Scanning
Figure 1 shows representative static 11C-preladenant images (Fig. 1A), parametric DVR images (Fig. 1B), and MR images (Fig. 1C) of the corresponding slices. Figure 2A shows the mean time–activity curves in 5 brain regions of healthy subjects (n = 5) after intravenous injection of 11C-preladenant. The radioactivity levels were high in the putamen and head of the caudate nucleus, regions known to contain high densities of A2AR, with a peak uptake in the putamen of 3.2−6.6 SUV at around 40–60 min after injection. The caudate showed a lower peak uptake of 2.3−4.9 SUV at around 20–50 min after injection. Radioactivity levels in the other 3 brain regions known to contain low densities of A2AR peaked within 2 min and rapidly washed out, followed by steady baseline levels until the end of the scan.

Mean decay-corrected time–activity curves of 5 brain regions after intravenous injection of 11C-preladenat into human subjects. (A) Radioactivity levels are expressed as SUVs: putamen (●), head of the caudate nucleus (○), thalamus (■), frontal cortex (□), and cerebellar cortex (▲). (B) SUV ratio (SUVr): putamen/cerebellar cortex (♦) and head of the caudate nucleus/cerebellar cortex (♢). Data represent mean ± SD for 5 subjects.
The preliminary kinetic analysis revealed that the 2T provided significantly lower Akaike information criterion scores than the 1T (paired t test, P < 0.05) in brain regions with low A2AR densities (i.e., frontal and cerebellar cortices and thalamus), and that Akaike information criterion scores did not show any significant differences in regions with high A2AR density. The average SUVr (SUV ratio to the reference region) graph showed pseudoequilibrium from about 40 to 60 min after injection onward, with target–to–reference region ratios of 3.8–10 (Fig. 2B).
The VT obtained with 1T and 2T and DVR calculated from VT with 2T and LGRM are summarized in Table 1. The highest VT values were measured in the putamen. The VT values of the frontal cortex and thalamus were close to those in the reference candidate region (cerebellar cortex). The SD of DVR calculated from VT with 2T was larger than that of DVR obtained with LGRM. When an outlier (DVR = 13.1) of 2T estimates occurring in the head of the caudate nucleus were excluded, DVR calculated from VT with 2T and obtained with LGRM matched with each other well (DVR(LGRM) = 0.95 × DVR(2T) + 0.05, R2 = 0.96). Figure 3 shows the impact of the shortened scan protocol in the estimates of DVR with LGRM. A shortened protocol of 50- or 70-min PET scanning as an alternative to the standard 90-min scanning is capable of providing the stable DVR estimates within 10% or 5% differences at most, respectively.
11C-Preladenant VT Estimated from 1T and 2T and DVR Estimated from 2T and LGRM
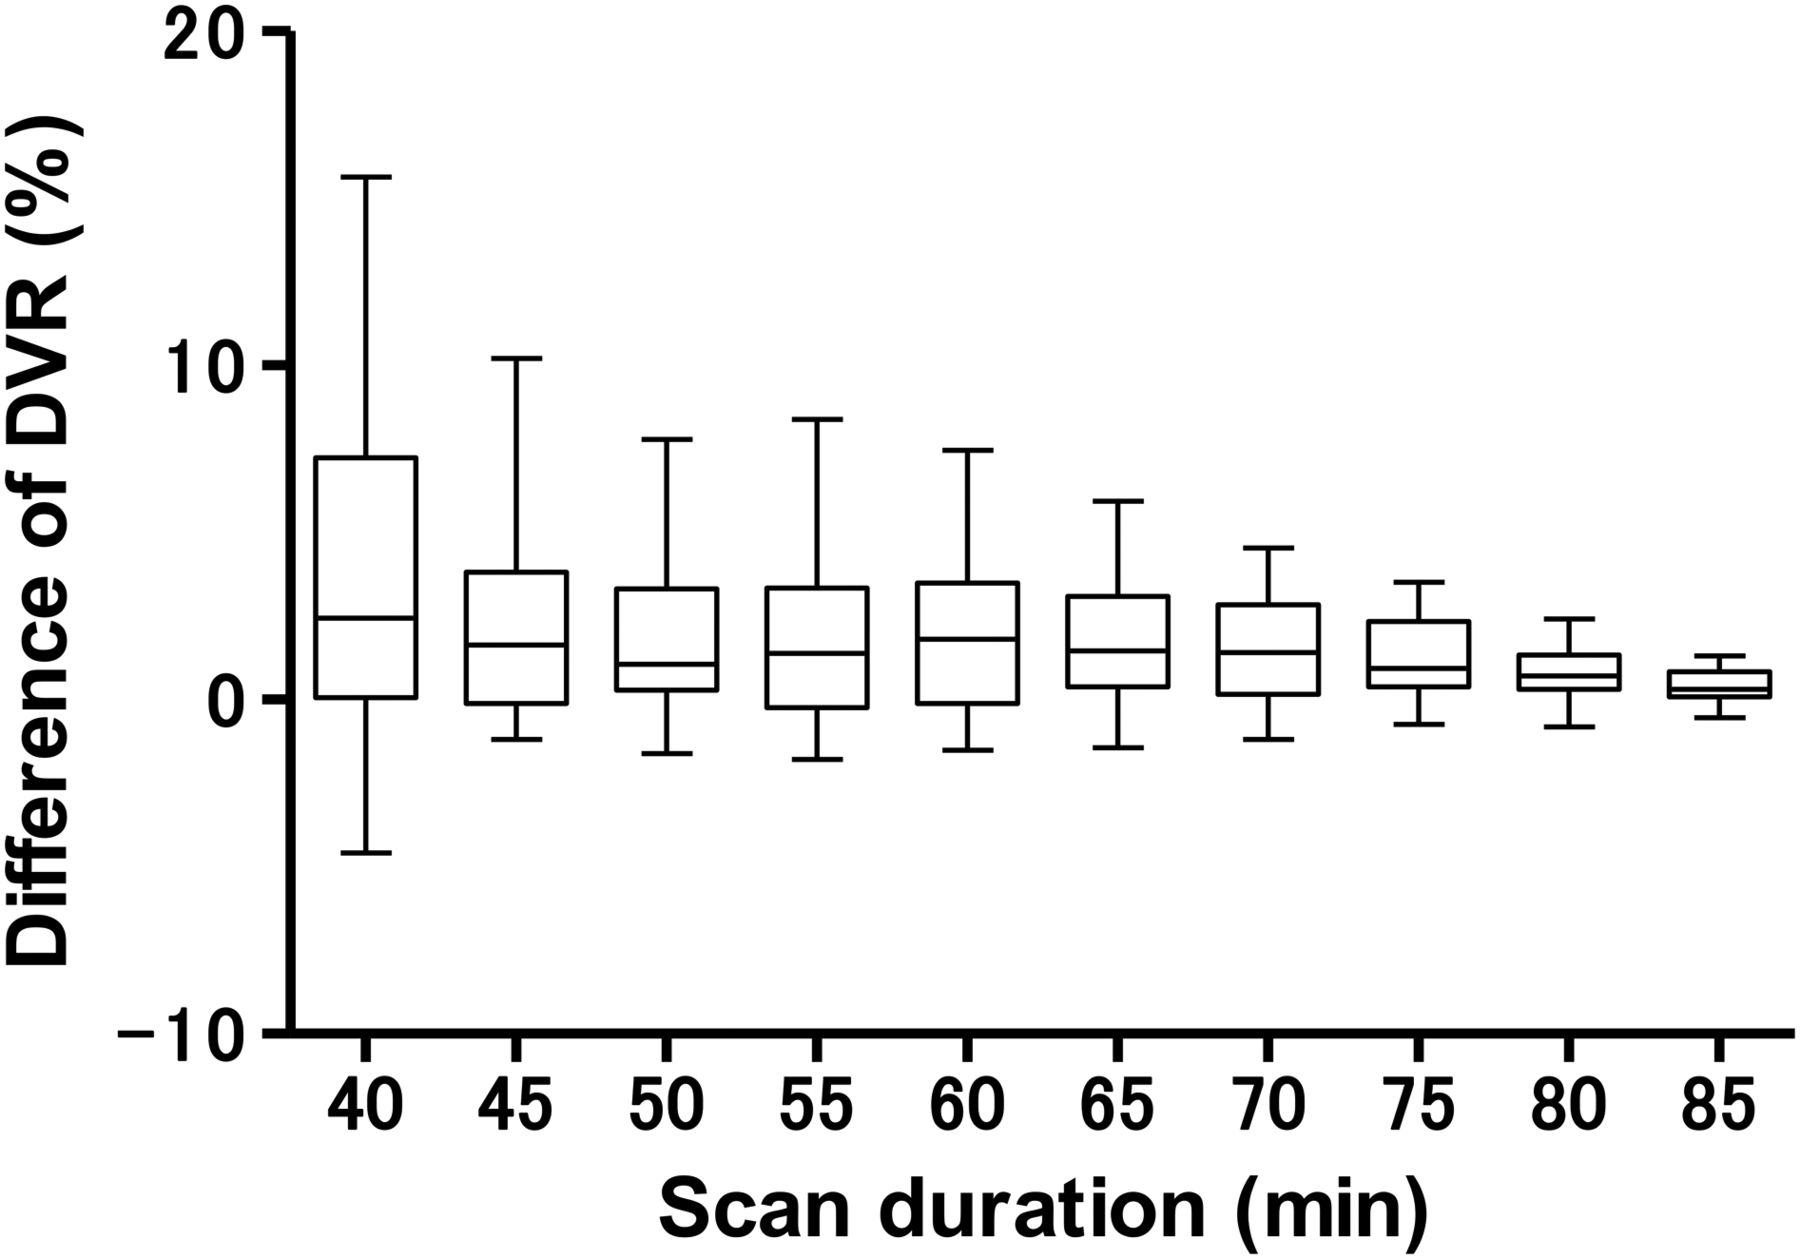
Differences between DVR of 11C-preladenant in the standard 90-min scan protocol and those in shortened protocol with Logan graphical reference tissue method. Box and whiskers show median, quartile, minimum, and maximum of the differences.
Metabolite Analysis
Plasma radioactivity rapidly decreased after bolus injection (Fig. 4A). The radioactivity concentration in plasma was higher than in whole blood (Fig. 4B). The results of the HPLC analysis of plasma are summarized in Table 2.

Mean decay-corrected time–activity curves of whole blood (○), plasma (△), metabolite-corrected plasma (▿), and fraction of intact 11C-preladenant (11C-PLC) (□) after intravenous injection of 11C-PLN into human subjects. (A) Radioactivity levels are expressed as SUV. (B) Values for first 7 min after tracer injection were extracted from A. Data represent mean ± SD for 5 subjects.
Percentages of Radiolabeled Metabolites in Plasma After Intravenous Injection of 11C-Preladenant
Three hydrophilic metabolites (HM1, 3.2 min; HM2, 4.8 min; and HM3, 6.2 min) and a lipophilic metabolite (LM1, 9.9 min) were detected in plasma. At 60 min after injection, intact 11C-preladenant remained dominant (77.8% ± 7.2%, n = 5). The mean radioactivity voided into urine at 111 ± 17 min (range, 97−132 min; n = 8) was 1.2% ± 0.2% of injected activity (range, 1.0%−1.5%, n = 8). In urine, hydrophilic metabolite HM2 was dominant (75.4% ± 2.7%, n = 3), and a small amount of the parent radioligand was observed (3.0% ± 3.4%, n = 3).
Whole-Body Imaging
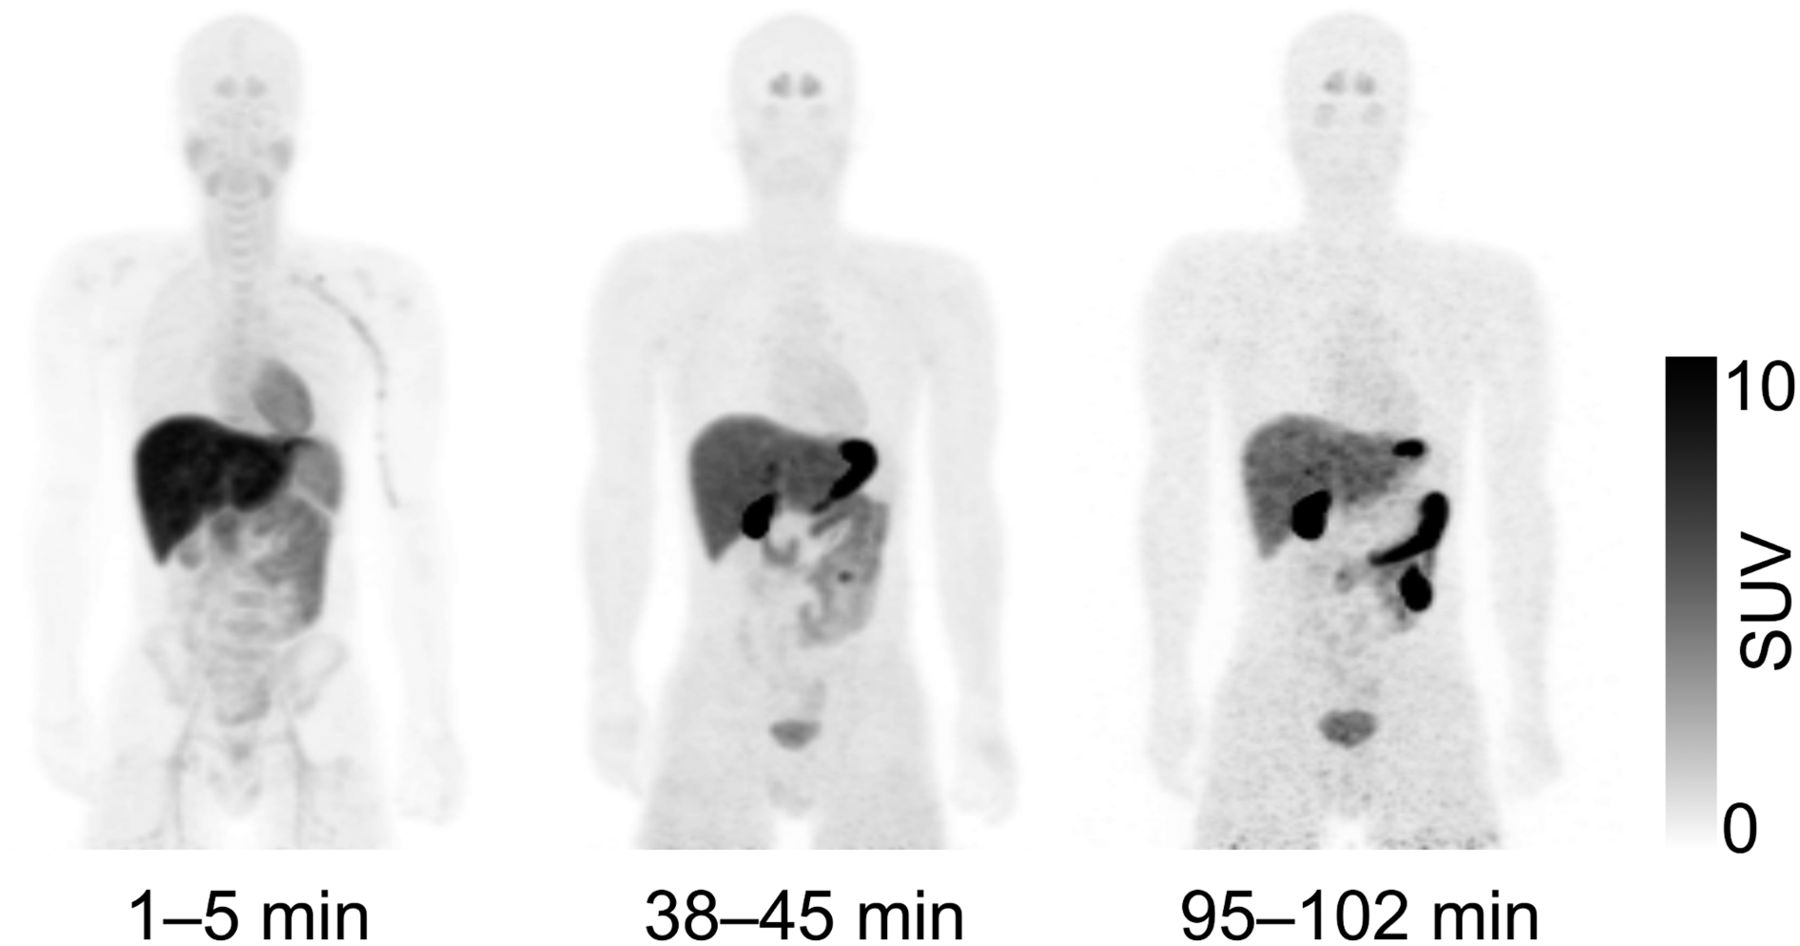
A representative whole-body distribution of 11C-preladenant is shown in Figure 5, and decay-corrected time–activity curves of source organs for the same subject are shown in Figure 6. In the first frame (1−5 min) of Figure 5, the liver showed the highest uptake of radioactivity, which gradually decreased up to 90 min and remained stable thereafter. The radioactivity level of the liver remained the highest in the last frame. The gallbladder was clearly visible and its radioactivity was secreted into the small intestine, illustrating the hepatobiliary excretion of 11C radioactivity. The urinary bladder showed a gradual increase in radioactivity and was visible after the middle frame, indicating some urinary excretion of 11C radioactivity. The mean and SD of radioactivity voided into urine at 132 ± 1 min (n = 3) was 1.3% ± 0.2% (n = 3) of injected activity.

Representative whole-body decay-corrected maximum-intensity-projection images of 11C-preladenant. Images were obtained at 1−5, 38−45, and 95−102 min after intravenous injection of 11C-preladenant into 23-y-old male subject.

Regional decay-corrected time–activity curves after intravenous injection of 11C-preladenant into same subject as shown in Figure 5. Time–activity curves are expressed as % injected dose (%ID) for each of 15 source organs: liver, lungs, small intestine, and gallbladder (A); heart, red marrow, brain, and stomach (B); kidneys, spleen, pancreas, and bladder (C); and thyroid, adrenals, and thymus (D). Activities in bone marrow were estimated from thoracic and lumbar vertebrae.
The normalized number of disintegrations is shown in Supplemental Table 5, and the organ-absorbed and effective doses are shown in Table 3. The highest absorbed dose was observed in the gallbladder wall, followed by the liver, heart wall, small intestine, stomach wall, and pancreas. The mean and SD of the estimated effective dose are 3.7 ± 0.4 μSv/MBq.
Organ-Absorbed Doses
DISCUSSION
To our knowledge, this is the first clinical study to assess the safety, radiation dosimetry, and initial brain imaging of 11C-preladenant in a small population of healthy human subjects.
We determined 11C-preladenant to be safe and well tolerated, with no adverse effects in the 5 subjects included in this study. The radiation absorbed dose was higher in the gallbladder wall, liver, heart wall, small intestine, stomach wall, pancreas, and kidneys than in the other organs studied, but was nonetheless sufficiently low for clinical use. The individual organ and total-body doses of 11C-preladenant were comparable with other 11C-labeled tracers (28,29).
The regional distribution of 11C-preladenant is consistent with the A2AR density in the healthy human brain. The localization of A2AR density in the normal human brain has been demonstrated by in vitro autoradiographic studies with 3H-CGS21680 and 3H-SCH58261 (7). The highest signal level of A2ARs was observed in the basal ganglia, followed by the cerebral cortex and thalamus. The estimated total concentration of A2AR in the putamen and caudate were 7 and 6 nM, respectively, which is sufficiently high for visualization by radioligands with affinity of preladenant (Ki = 1.1 nM). In contrast, A2AR expression levels in the extrastriatal regions were low (total concentration < 1 nM) and theoretically cannot be visualized using 11C-preladenant.
In this preliminary study, we observed large individual differences in 11C-preladenant VT (around 30% coefficient of variation) in the target regions. There were no individual differences in plasma input function and area under the time course curve of metabolite-corrected plasma radioactivity. This variance may be attributable to individual differences in A2AR density, affinity, or competition by endogenous (i.e., adenosine) and exogenous A2AR binding ligands. One limitation of this study is the lack of analysis of plasma caffeine concentration in the subjects. Caffeine is a well-known antagonist of central nervous system A2AR (30). Although all subjects were required to refrain from drinking caffeinated beverages up to 12 h before PET imaging, residual caffeine may have affected the distribution of 11C-preladenat in the target regions.
Significant amounts of the radiometabolite of 11C-preladenant were found in the rat brain (17% of radioactivity in the brain 60 min after injection) (18). In the human plasma, 11C-preladenant was also metabolized, and the radiometabolite profile was identical to that observed in the rat plasma. The ratio of cerebellum-to-plasma time–activity curves was stable over time. However, the ratio of cerebellum–to–metabolite-corrected plasma time–activity curves was slightly increased over time (Supplemental Fig. 1). Therefore, we estimated that a certain amount of radiometabolites would enter the human brain.
In the target regions, no significant differences in the goodness of fit, described by the Akaike information criterion, were observed between 1T and 2T. This may also indicate the difficulty in distinguishing between the specific and nondisplaceable compartments in the 2T model. Therefore, estimated microkinetic parameters in 2T (K1, k2, k3, k4) were unstable, though VT from the microparameters was relatively stable. To estimate the specific binding of 11C-preladenant, a reference tissue model may be useful for quantification of binding potential. Very recently, Zhou et al. assessed 11C-preladenat PET kinetics in the conscious monkey brain. They concluded that the cerebellum is favorable over other investigated reference regions in terms of low VT and robustness of binding potential estimation (31). Therefore, a reference tissue model using cerebellum as the reference region may be applicable for quantification of A2AR density. Further blocking studies in the human brain may be needed to fully validate the presence of a reference region.
CONCLUSION
The initial findings of the present study of a small group of subjects indicated that imaging of A2AR in the brain with 11C-preladenant PET is feasible. The radiation dose is acceptable, and the tracer is pharmacologically safe at the dose required for adequate PET imaging. The regional distribution of 11C-preladenant was consistent with known A2AR densities in the brain. The brain uptake of 11C-preladenant can be calculated as VT and DVR, which is an index of A2AR density. This initial evaluation indicated that the use of 11C-preladenat represents a feasible strategy for imaging of adenosine A2AR in the brain. Further blocking studies in the human brain may be needed to fully validate the presence of a reference region.
DISCLOSURE
This work was supported in part by a Grant-in-Aid for Scientific Research (B) 16H05396 from the Japan Society for the Promotion of Science. No other potential conflict of interest relevant to this article was reported.
Acknowledgments
We thank Kunpei Hayashi and Masanari Sakai for technical support with the cyclotron operation and radiosynthesis, Shotaro Yamaguchi for assistance in data acquisition, Kiyomi Miura for care of subjects in the PET scanning, and Airin Onishi for coordination of the clinical study.
Footnotes
Published online Mar. 9, 2017.
- © 2017 by the Society of Nuclear Medicine and Molecular Imaging.
REFERENCES
- Received for publication December 10, 2016.
- Accepted for publication February 13, 2017.


Jump to section
Related Articles
Cited By...
- No citing articles found.