


Abstract
Different environmental conditions under anesthesia may lead to unstable homeostatic conditions in rodents and therefore may alter kinetics. In this study, the impact of different heating conditions on PET imaging quantification was evaluated. Methods: Two groups of 6 adult female BALB/c nude mice with subcutaneously implanted tumors underwent microPET imaging after injection of 18F-labeled tetrafluoroborate or 18F-FDG. Dynamic scans were acquired under optimal and suboptimal heating conditions. Time–activity curves were analyzed to calculate uptake and washout time constants. Results: With 18F-labeled tetrafluoroborate, optimal animal heating led to a stable heart rate during acquisition (515 ± 35 [mean ± SD] beats/min), whereas suboptimal heating led to a lower heart rate and a higher SD (470 ± 84 beats/min). Both uptake and washout time constants were faster (P < 0.01) in animals maintained with optimal heating. Conclusion: Although the difference in heart rates was slight, optimal heating yielded significantly faster uptake and washout kinetics than suboptimal heating in all organs for both tracers.
Preclinical functional imaging studies in mice have been widely used for translational research (1–4). Nevertheless, the physiologic parameters of mice during imaging studies are still poorly standardized. These parameters can be affected by fasting (5–7) and by anesthesia during or after injection of the tracer (8) or during image acquisition procedures (6,7). Differences in animal handling therefore may lead to considerable differences in results reported by different investigators (7,9,10).
A controlled and standardized environment (10,11), including consideration of circadian rhythms (5, 9), is known to lead to more reproducible functional imaging results in mice (10,11). On the other hand, animal exposure to different conditions—especially under anesthesia—is deleterious to their homeostasis (6,7) and will induce poor reproducibility of experimental outcomes (7,8). However, homeostasis can be maintained if the underlying regulatory functions under experimental conditions are controlled in such a way that these functions approximate those of the normal, awake animal.
Because heart rate, respiratory rate, and body temperature can be monitored in mice (12), we aimed to study the influence of the ambient or heating temperature on these physiologic rates. Because changes in both heart rate and body temperature in mice can also influence the distribution and kinetics of labeled tracers, we also aimed to evaluate throughout this study the impact of modifying heating conditions on PET imaging quantification for 2 tracers, 18F-labeled tetrafluoroborate (18F-TFB) and 18F-FDG.
MATERIALS AND METHODS
The care, preparation, and use of animals were performed in accordance with European legislation on laboratory animals and animal studies.
Impact of Ambient Temperature on Physiologic Parameters
To study the impact of ambient temperature on heart rate, respiratory rate, and body temperature, we first studied 3 groups of 6 normal female BALB/c nude mice (body mass, 22.3 ± 0.7 [mean ± SD] g). Animals were maintained under continuous anesthesia inside a dedicated animal holder (Minerve imaging cell; Minerve SAS), and their physiologic parameters were continuously monitored during the entire procedure. Heart rate was measured with 3 carbon-tube electrodes positioned on the animals’ extremities (12), and body temperature was assessed with a dedicated intrarectal probe. The anesthesia gas mixture was kept constant to avoid any influence of the isoflurane concentration on the animals’ homeostatic capabilities. All groups were maintained under a mixture of 1.5% isoflurane and oxygen.
All animals were warmed at the same temperature for 15 min before any recording to ensure the stabilization of physiologic rates. After this initial delay period, the ambient temperature in the holder was set to 33°C, 35°C, and 37°C for the first, second, and third groups, respectively, and individual heart rates and body temperatures were measured during a 60-min observation period.
From these first monitoring observations and as a preamble to the kinetic measurements, we defined and retained for the forthcoming imaging procedures 2 sets of heating conditions. The optimal heating condition was defined as a holder maintained at a constant temperature of 35°C, and the suboptimal heating condition was defined as a temperature of 33°C. These conditions were applied successively to our animal groups during the imaging procedures.
A higher temperature for the holder (37°C) led to overheating, as attested to by an increase in measured mouse body temperatures, and unstable anesthesia, with uncontrolled limb movements and undesired awakening. Therefore, this heating condition was not considered further for the imaging procedures.
Imaging of Animals Under Different Physiologic Conditions
A pool of 12 adult female BALB/c nude mice (body mass, 18.7 ± 0.3 g) was selected for tumor implantation.
Wild-type anaplastic thyroid cancer cells and human sodium iodine symporter–transfected cancer cell xenografts were implanted subcutaneously in all animals. Implanted cells were obtained and prepared as described by Gholami et al. (13). Transfected xenografts were implanted between the left shoulder and the flank of the animal, and wild-type xenografts were implanted between the right shoulder and the flank of the same animal (14).
Imaging Protocol
After 4 d of tumor growth (both implanted tumors were 5–7 mm), animals were prepared for the imaging procedures. Animals were provided with food and water ad libitum before being imaged with both tracers. Mice were maintained under anesthesia inside the same animal holder attached to an R4 microPET scanner (Concorde Microsystems). Mice were kept warm by the circulating air in the holder and stabilized before tracer administration. The tracers (18F-TFB and 18F-FDG) were injected separately directly in a tail vein inside the holder just before the beginning of imaging acquisition. 18F-TFB was produced as described by Jauregui-Osoro et al. (15).
Each animal underwent 4 tracer injections followed by dynamic PET acquisitions, 2 with 18F-FDG on day 1 and 2 with 18F-TFB on day 2. A 4-h free interval was set between the 2 successive acquisitions on the same day. During this interval and during the night, mice had access to food and water ad libitum.
Circadian rhythm is known to influence homeostatic and metabolic regulation systems and therefore might have influenced tracer uptake in our experiments (5, 9), depending on the time of injection and on the time of the animal’s last food intake. Tumor growth between the first and the last acquisitions (24 + 4 h) also might have influenced tracer uptake and confounded intraindividual comparisons. To limit the influence of these circadian effects (including feeding habits) as well as tumor growth, we divided the animals into 4 groups of 3 animals each and, for each group, cycled the imaging sequence between optimal and suboptimal heating conditions for both tracers as well as the time of injection to avoid any systematic influence or risk of systematic error.
Mice were injected twice with 3.1 ± 0.2 MBq of 18F-TFB and twice with 3.2 ± 0.4 MBq of 18F-FDG. Dynamic PET images were acquired during the first 45 min after injection. The optimal or suboptimal heating condition for the holder was kept stable during the entire acquisition process. Mouse heart rates were monitored and recorded throughout the 45-min process. In total, 48 datasets were collected for the 12 mice with bilaterally implanted tumors.
Image Reconstruction and Data Collection
Ninety successive frames were collected for each dataset during the first 45 min (30 s/frame), with a single bed position covering the entire mouse body (full axial field of view, 7.2 cm). Data were reconstructed by use of the vendor’s OSEM2d algorithm (Concorde Microsystems) with 16 subsets and 4 iterations. 18F decay correction was applied, but no attenuation correction method was selected. The final image reconstruction matrix was 128 × 128 × 95 pixels for a field of view of 11 × 11 × 8 cm.
After data reconstruction (3-dimensional datasets plus time) and to assess time–activity data to ensure reproducible region-of-interest (ROI) positioning, we generated a time series of 2-dimensional projection images; 90 successive single 2-dimensional ventral-to-dorsal projection images were calculated from each 3-dimensional frame. Ventral-to-dorsal projection was preferred over other axis projections for ROI positioning to ensure positioning reproducibility as well as limited overlapping of organs of interest.
Several ROIs were manually drawn on the ventral-to-dorsal projection frames and used to derive time–activity data. ROIs were placed over the thyroid, stomach, implanted tumors, and blood-pool compartment (heart ROI) for 18F-TFB image analysis (Fig. 1, top). ROIs were placed over the liver, brain, heart, and implanted tumors for 18F-FDG image analysis (Fig. 1, bottom). The sizes and shapes of the ROIs were the same for both heating conditions.
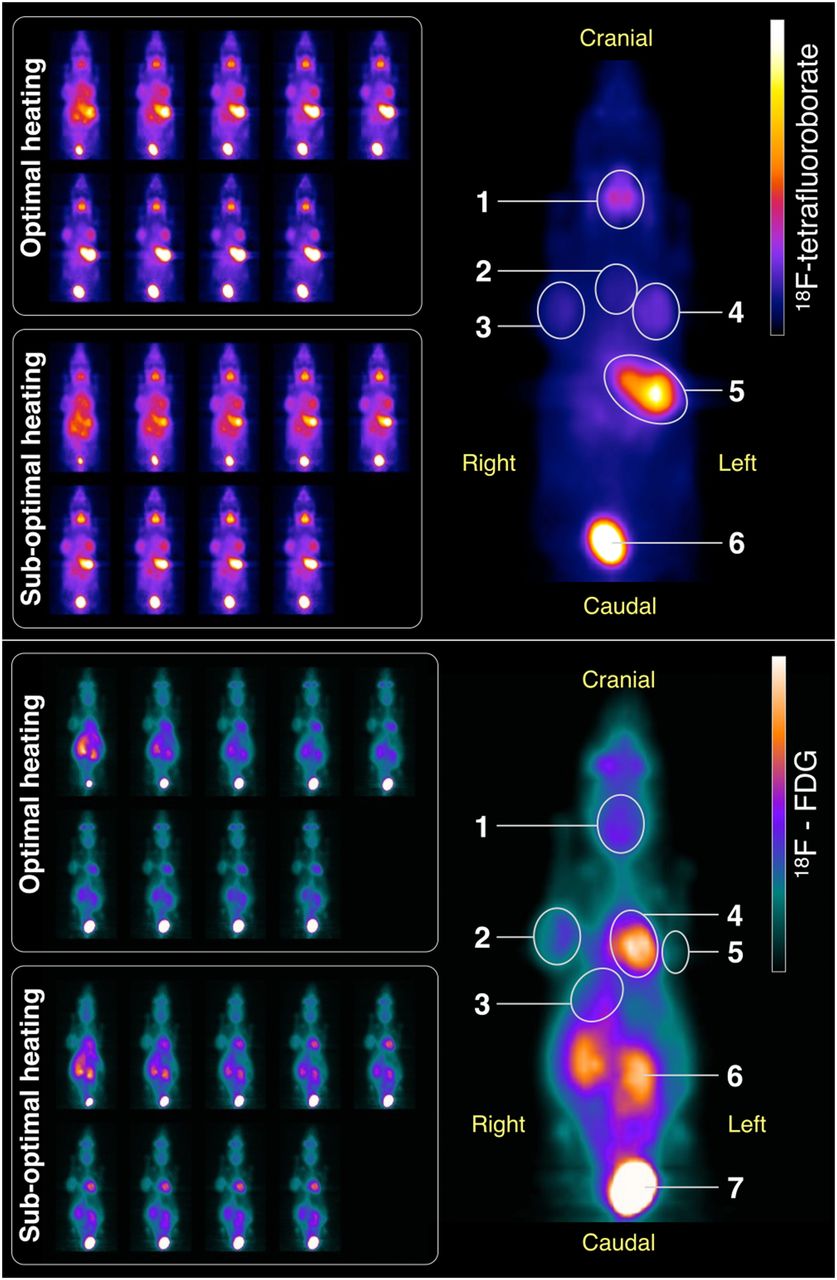
18F-TFB (top) and 18F-FDG (bottom) dynamic image acquisitions. After each tracer injection, full sets of 90 images were acquired for 45 min. Optimal and suboptimal heating acquisitions for same animal are shown at left. Nine reformatted frames (5 min/frame) are presented as ventral-to-dorsal projections. Single 45-min projection is shown at right. Circular ROIs used for time–activity curve extraction are plotted. For 18F-TFB, ROIs were as follows: 1, thyroid gland; 2, heart (blood pool); 3, right implanted tumor; 4, left tumor; 5, stomach area; 6, bladder. For 18F-FDG, ROIs were as follows: 1, brain area; 2, right implanted tumor; 3, liver area; 4, heart; 5, left tumor; 6, kidney; 7, bladder.
Curve Fitting and Kinetic Measurements
Raw time–activity curves were obtained from the ROIs for each animal for both optimal and suboptimal heating acquisitions and for both injected tracers. Image-derived time–activity data for organs and tumors were analyzed with a biexponential model: where A and B are fitting constants (reported as tracer concentrations) and λwashout and λuptake are washout and uptake time constants (reported per minute), respectively. Time–activity curve raw data points collected from the blood-pool compartment were fitted with a biexponential decreasing function:
 where A and B are fitting constants and λfast washout and λwashout are fast initial apparent washout and slow late washout time constants, respectively. Dedicated modeling software (proFit; Quantumsoft) was used to determine the uptake and washout time constants.
Statistical Analysis
A paired Student t test was used for direct comparison of uptake and washout time constants for each compartment of the model—comparing optimal and suboptimal heating regimens. P values of less than 0.01 were considered significant.
RESULTS
Optimal and suboptimal heating conditions were determined to correspond to circulating heating air maintained at temperatures of 35°C and 33°C, respectively.
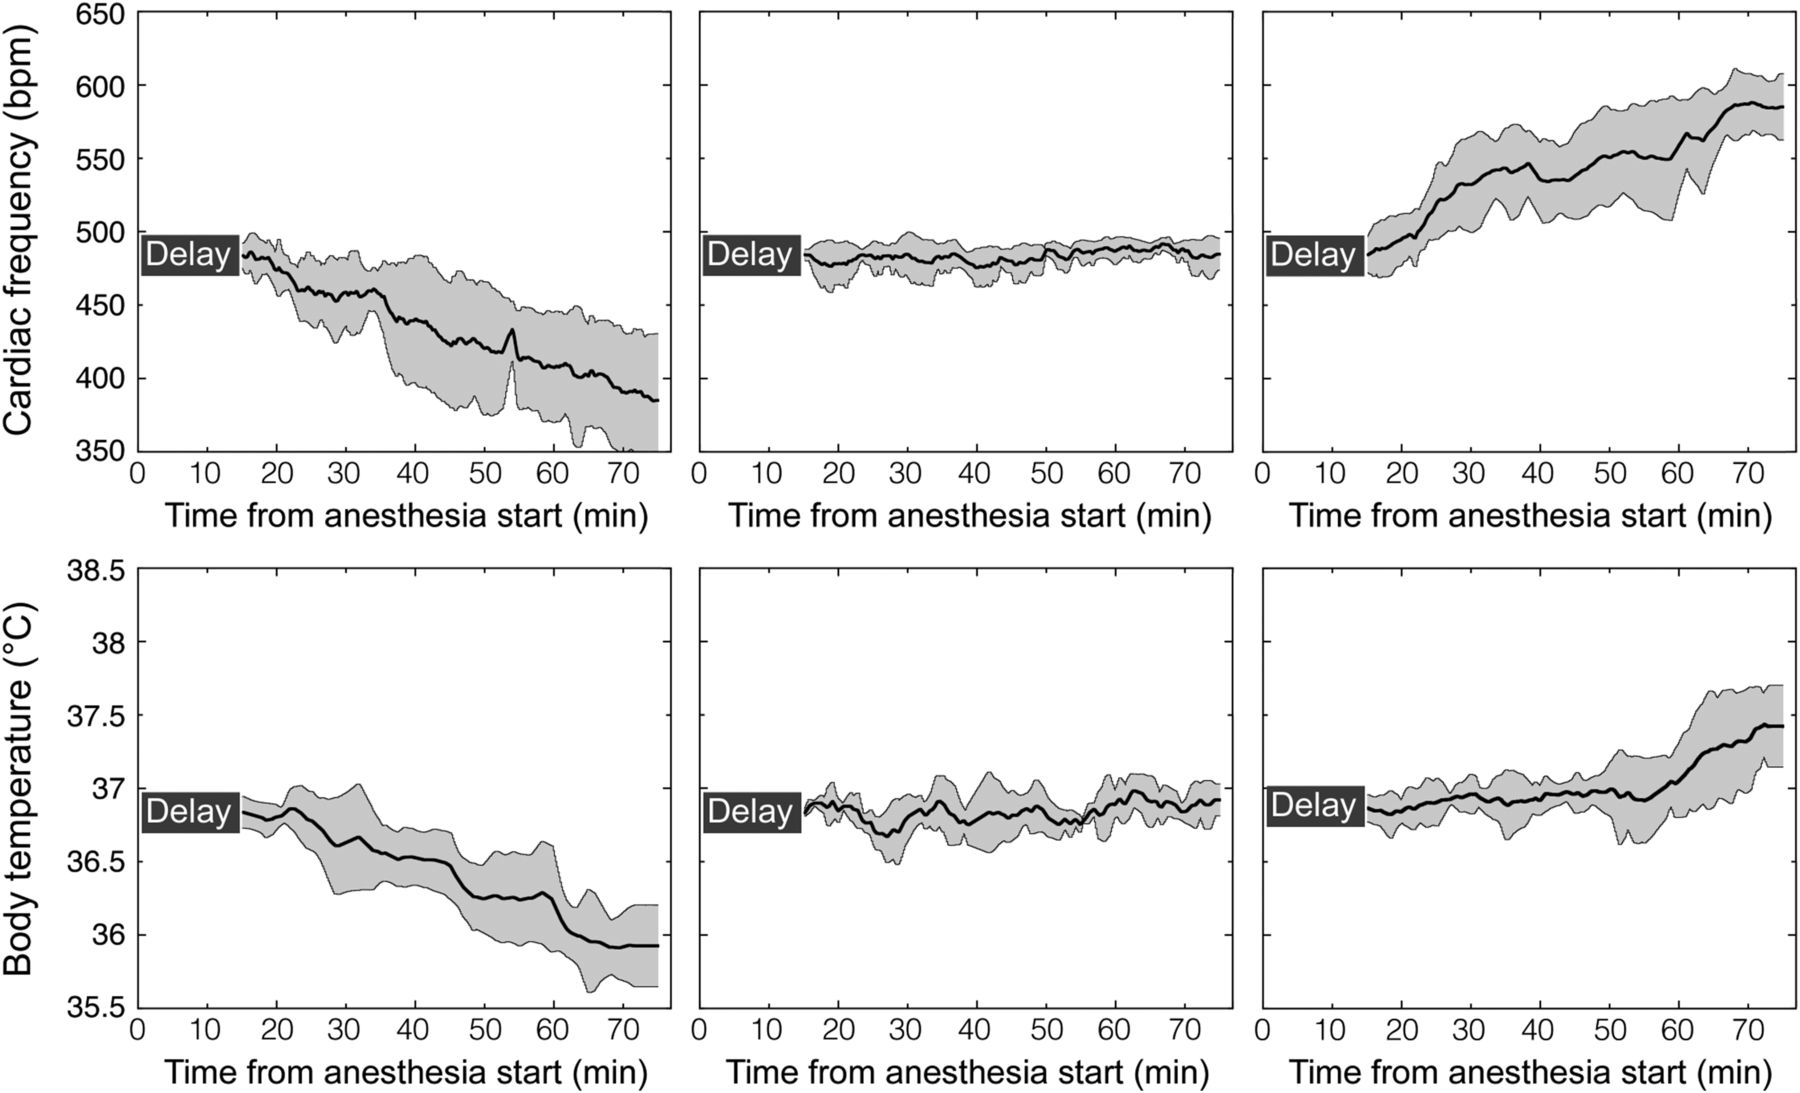
As a preamble to the kinetic measurements, heart rate and body temperature were monitored continuously during the 60-min observation period for all mice. Figure 2 shows the mean evolution of both measured parameters for all 3 groups. The mean heart rate after the first 15 min and the mean body temperature were 482 ± 45 beats/min (bpm) and 36.9°C ± 0.1°C, respectively, for the first group; 487 ± 40 bpm and 37.0°C ± 0.2°C, respectively, for the second group; and 483 ± 53 bpm and 36.9°C ± 0.1°C, respectively, for the third group. No statistically significant difference among the groups was found.

Stability of mouse cardiac frequencies (top) and body temperatures (bottom). Animals under anesthesia were positioned inside heated animal holder. After initial 15-min delay to allow physiologic parameters to stabilize under anesthesia, initial heating conditions were shifted to temperatures of 33°C (suboptimal; left), 35°C (optimal; middle), and 37°C (right). Cardiac frequencies and body temperatures were recorded continuously for 60 min. Values obtained from 6 different animals are represented as means (solid black line) and SDs (gray shading).
The first of our groups showed a continuous and slow decrease in both heart rate and body temperature during the 60 min of observation. The final heart rate was 390 ± 120 bpm, and the final body temperature was 35.9°C ± 0.6°C. The second group showed much better stability during recording; the final heart rate was 489 ± 35 bpm, and the final body temperature was 36.9°C ± 0.3°C. The third group was associated with a continuous increase in both heart rate and body temperature; the final heart rate was 584 ± 62 bpm, and the final body temperature was 37.4°C ± 0.7°C.
According to these preliminary measurements and for our specific animal holding system, homeostasis under anesthesia was best conserved when the circulating air temperature was set at 35°C (described earlier as optimal heating). Suboptimal heating of the animals (33°C) led to a progressive decrease in body temperature measured with a rectal probe and was accompanied by a reduction in heart rate. After 60 min, the mean differences in body temperature and heart rate between the groups were 1°C and 19%, respectively.
Excessive heating (a holder temperature maintained at 37°C) led to overall body heating of 0.5°C and an increase in the heart rate of more than 20%. For this last group, anesthesia was also more difficult to control; measurements had to be repeated for 3 mice that awoke during the last 15 min of the procedures. Therefore, this heating condition was not considered further for the imaging procedures.
Time constants and mean heart rate measurements (mean values for all 12 implanted animals prepared for imaging) are summarized in Tables 1 and 2 for tracers 18F-TFB and 18F-FDG, respectively.
Mean Uptake and Washout Time Constants Measured After 18F-TFB Tracer Injection
Mean Uptake and Washout Time Constants Measured After 18F-FDG Tracer Injection
After a bolus intravenous injection, the tracer 18F-TFB was rapidly distributed into all body compartments. Figure 3 shows 18F-TFB time–activity curves for a single mouse. Fitting and time constant calculations revealed overall faster uptake and washout of the tracer in the optimal heating condition.
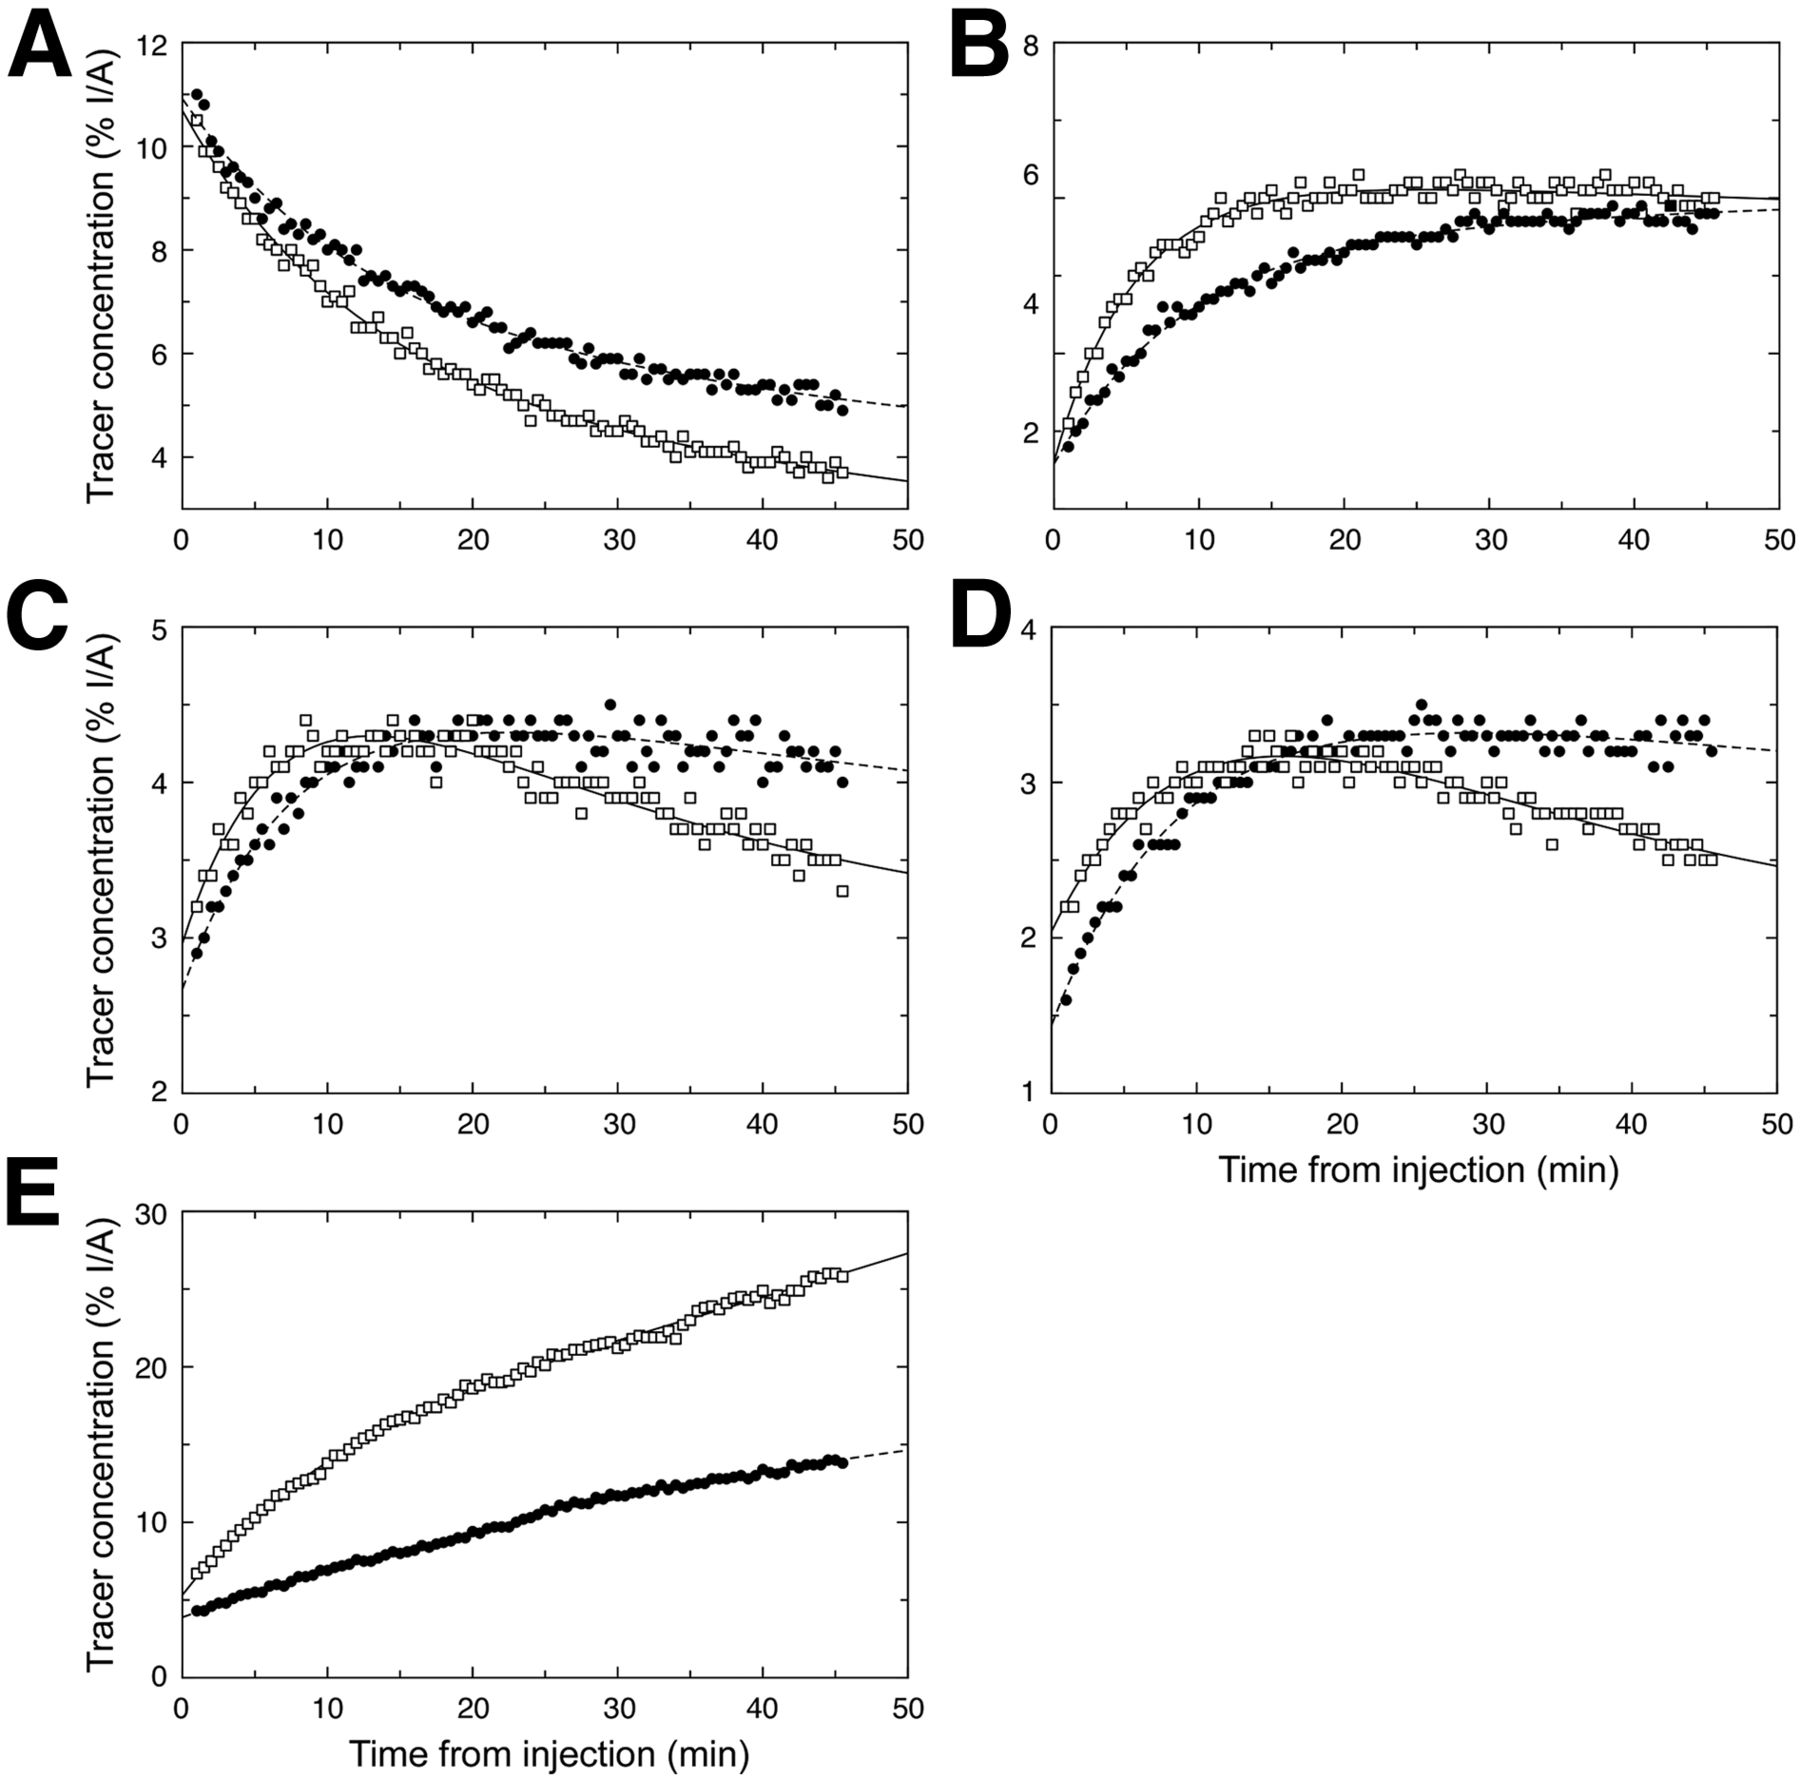
Time–activity curves and fitted kinetics for 18F-TFB. Measurements from different ROIs are shown for both optimal (□) and suboptimal (●) acquisitions. (A) Evolution of blood-pool tracer concentration. (B) Thyroid tracer concentration. (C) Left tumor tracer concentration. (D) Right tumor tracer concentration. (E) Stomach area tracer concentration. I/A = injected activity.
Tracer washout from blood was about 5 times faster in the optimal heating condition (λwashout, 0.131 ± 0.029 min−1) than in the suboptimal heating condition (λwashout, 0.028 ± 0.017 min−1). This difference was significant (P < 0.01; n = 12). Paired comparisons for the entire mouse population showed significantly faster uptake (P < 0.01; n = 12) in the thyroid, stomach, and both tumors as well as faster washout (P < 0.01; n = 12) from these compartments.
The measured data and results of calculations for the tracer 18F-FDG were similar to those for 18F-TFB (Fig. 4; Table 2). Uptake in the brain, heart muscle, and both implanted tumors was faster (P < 0.01; n = 12) in the optimal heating condition. Washout from the same organs was also significantly faster (P < 0.01; n = 12) in the optimal heating condition.
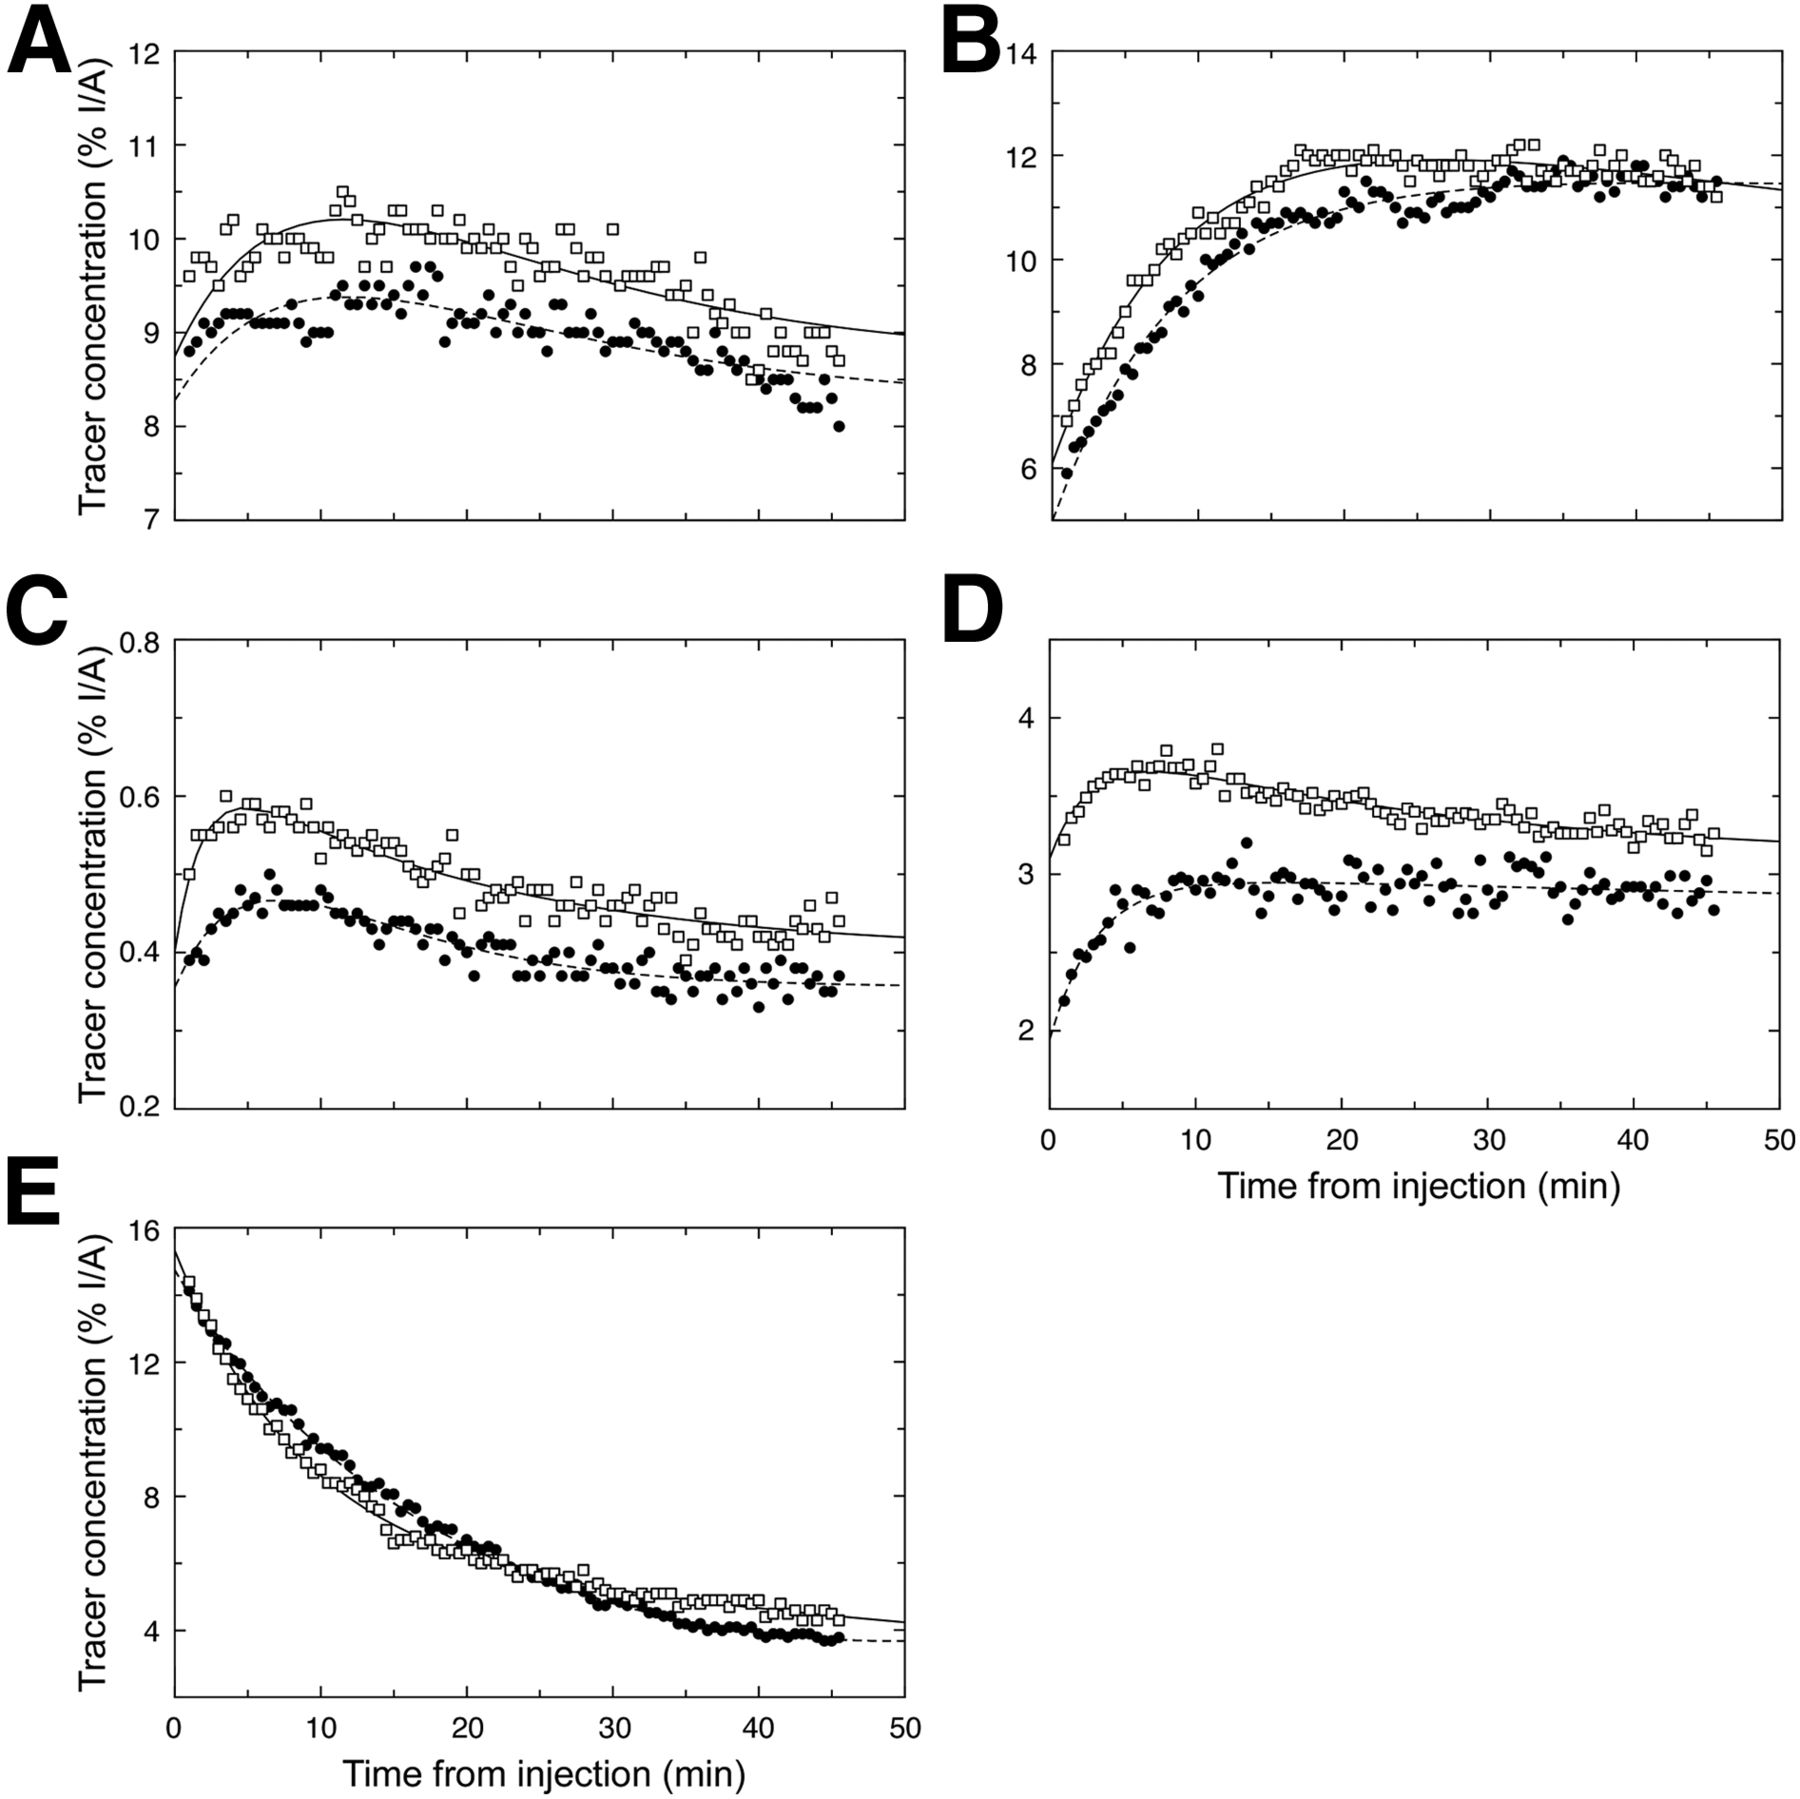
Time–activity curves and fitted kinetics for 18F-FDG. Measurements from different ROIs are shown for both optimal (□) and suboptimal (●) acquisitions. (A) Evolution of brain tracer concentration. (B) Heart area tracer concentration. (C) Left tumor tracer concentration. (D) Right tumor tracer concentration. (E) Liver concentration. I/A = injected activity.
Maximum 18F-TFB uptake and 18F-FDG uptake were not significantly different between optimal and suboptimal conditions, as shown in Figures 3 and 4, respectively. However, the respective fitted curves showed a systematic additional delay in reaching the maximum concentration (shifted time to maximum concentration) for animals in the suboptimal heating condition; this delay was related to the associated overall slower measured kinetics.
Uptake time constants for the liver compartment could not be assessed by calculation; the 30-s frame duration rate that we used was too coarse for reliable assessment of the time course of initial radiotracer uptake in the liver.
All mice survived the imaging procedures; continuous heart rate monitoring during the imaging process allowed the calculation of mean rates for both heating conditions. A slight but significant difference (P < 0.01) between optimal and suboptimal heating conditions was observed (Tables 1 and 2). The optimal heating condition resulted in higher (but stable) heart rates and lower SDs during the imaging procedures (515 ± 35 bpm for 18F-TFB and 537 ± 55 bpm for 18F-FDG) than the suboptimal heating condition (470 ± 84 bpm for 18F-TFB and 442 ± 96 bpm for 18F-FDG).
DISCUSSION
Different heating conditions during anesthesia led to slight but statistically significant differences in heart rates during PET imaging as well as a higher SD associated with suboptimal heating. For both 18F-TFB and 18F-FDG, optimal heating yielding faster uptake and clearance kinetics in all organs evaluated.
These findings highlight the influence of even small differences in animal heating on tracer distribution. In agreement with previously published work (6,7,9,10), strict control of all homeostasis-influencing parameters (body temperature, fasting, and anesthesia conditions) is mandatory to ensure the reproducibility of experimental results.
CONCLUSION
Although the difference in heart rates was slight, optimal heating yielded significantly faster uptake and washout kinetics than suboptimal heating in all organs for both tracers.
DISCLOSURE
No potential conflict of interest relevant to this article was reported.
Footnotes
Published online Dec. 15, 2016.
- © 2017 by the Society of Nuclear Medicine and Molecular Imaging.
REFERENCES
- Received for publication May 9, 2016.
- Accepted for publication December 1, 2016.


Jump to section
Related Articles
Cited By...
- No citing articles found.