


Abstract
Norepinephrine transporter (NET) in the brain plays important roles in human cognition and the pathophysiology of psychiatric disorders. Two radioligands, (S,S)-11C-MRB and (S,S)-18F-FMeNER-D2, have been used for imaging NETs in the thalamus and midbrain (including locus coeruleus) using PET in humans. However, NET density in the equally important cerebral cortex has not been well quantified because of unfavorable kinetics with (S,S)-11C-MRB and defluorination with (S,S)-18F-FMeNER-D2, which can complicate NET quantification in the cerebral cortex adjacent to the skull containing defluorinated 18F radioactivity. In this study, we have established analysis methods of quantification of NET density in the brain including the cerebral cortex using (S,S)-18F-FMeNER-D2 PET. Methods: We analyzed our previous (S,S)-18F-FMeNER-D2 PET data of 10 healthy volunteers dynamically acquired for 240 min with arterial blood sampling. The effects of defluorination on the NET quantification in the superficial cerebral cortex was evaluated by establishing a time stability of NET density estimations with an arterial input 2-tissue-compartment model, which guided the less-invasive reference tissue model and area under the time–activity curve methods to accurately quantify NET density in all brain regions including the cerebral cortex. Results: Defluorination of (S,S)-18F-FMeNER-D2 became prominent toward the latter half of the 240-min scan. Total distribution volumes in the superficial cerebral cortex increased with the scan duration beyond 120 min. We verified that 90-min dynamic scans provided a sufficient amount of data for quantification of NET density unaffected by defluorination. Reference tissue model binding potential values from the 90-min scan data and area under the time–activity curve ratios of 70- to 90-min data allowed for the accurate quantification of NET density in the cerebral cortex. Conclusion: We have established methods of quantification of NET densities in the brain including the cerebral cortex unaffected by defluorination using (S,S)-18F-FMeNER-D2. These results suggest that we can accurately quantify NET density with a 90-min (S,S)-18F-FMeNER-D2 scan in broad brain areas.
Norepinephrine plays important roles in human cognition, and abnormalities of its neurotransmission have been implicated in the pathophysiology of psychiatric disorders (1–3). Norepinephrine transporters (NETs) control norepinephrine dynamics in the brain (4) and are a treatment target for psychiatric disorders such as major depressive disorder, posttraumatic stress disorder, and attention deficit hyperactivity disorder (5–7). NET plays essential roles not only in high-NET-density regions such as the thalamus and locus coeruleus but also in lower-NET-density regions in the cerebral cortex. In the cerebral cortex, NETs are the major transporters for norepinephrine and dopamine reuptake (8,9). Both norepinephrine and dopamine in the prefrontal cortex regulate cognitive functions such as working memory and executive functions (10). Atomoxetine, a selective NET inhibitor, which is effective for treating attention deficit hyperactivity disorder (11), increases extracellular levels of both norepinephrine and dopamine in the prefrontal cortex without affecting dopamine levels in the striatum or nucleus accumbens (7). It is therefore essential to have knowledge of NET densities in the cerebral cortex, which should help investigation of pathophysiology of cognitive disorders and development of drug treatment strategies in psychiatric disorders.
Two radioligands, (S,S)-18F-FMeNER-D2 and (S,S)-11C-MRB, have been used for imaging NETs with PET in humans (5,12). Both radioligands are analogs of reboxetine, which is a selective norepinephrine reuptake inhibitor; they both have a high affinity and selectivity for NETs. (S,S)-18F-FMeNER-D2 has a clear advantage over (S,S)-11C-MRB in estimating NET densities in the deep brain regions such as the thalamus, locus coeruleus, and limbic cortex, because the former has better suited kinetics for quantification of NET densities than does the latter (13). Another advantage of (S,S)-18F-FMeNER-D2 over (S,S)-11C-MRB is that the former provides better PET signal because of a longer half-life of 18F than that of 11C. However, (S,S)-18F-FMeNER-D2 has some disadvantages over (S,S)-11C-MRB in estimating NET densities in the cerebral cortex adjacent to the skull, because the former slowly defluorinates, resulting in the accumulation of 18F ion in the skull. After injection of (S,S)-18F-FMeNER-D2, defluorinated 18F ion slowly accumulates in the skull, resulting in high radioactivity at later scan times. Because of the limited spatial resolution of PET, the high PET signals spill in to the adjacent cerebral cortex, and the amount of spill in depends on the radioactivity in the skull, which varies spatially and temporally (14). Thus, potential objective approaches for removing scalp binding, which require estimation of amount of contamination of signal from the skull in the adjacent cerebral cortex, would be complicated.
In previous studies, (S,S)-18F-FMeNER-D2 allowed measurement of the NET density in the deep brain regions, either by calculating area under the time–activity curve (AUC) ratios on static scan data acquired from 120 to 180 min after injection or by estimating binding potentials (BPND) from dynamic scan data acquired for 240 min (14). On the other hand, although (S,S)-11C-MRB has no interfering skull radioactivity because it is a 11C-labeled radioligand, PET imaging of the NET density with this radioligand has been hampered by its generally unfavorable kinetic behavior for reliable quantification of NET densities (i.e., slow kinetics) (13).
The purpose of this study was to establish and validate reliable analysis methods that are unaffected by the defluorination of (S,S)-18F-FMeNER-D2 to quantify the NET density in the brain including the cerebral cortex adjacent to the skull.
MATERIALS AND METHODS
Participants
PET data of 10 healthy men (mean age ± SD, 22.4 ± 1.6 y) obtained for a previous study were reanalyzed (14). All participants were free of somatic, neurologic, and psychiatric disorders, and none had a history of current or previous drug abuse. This study was approved by the Ethics and Radiation Safety Committee of the National Institute of Radiologic Science, Chiba, Japan. Written informed consent was obtained from all participants.
PET Procedures
Each participant underwent 3 consecutive dynamic PET scans with two 30-min intermissions between the first and second and second and third scans with a PET scanner system (ECAT EXACT HR+; CTI-Siemens) after an intravenous injection of 368 ± 9 MBq (specific radioactivity, 312 ± 76 GBq/μmol) of (S,S)-18F-FMeNER-D2. The PET scanning sequence was as follows: 0–90, 120–180, and 210–240 min after the injection. Transmission scans were obtained before each of the 3 scans. All image and kinetic analyses were performed using PMOD (version 3.7; PMOD Technologies Ltd.). To obtain arterial input functions, arterial blood samples were taken manually during the PET scans.
Regions of Interest (ROIs)
For the gray matter, anatomic automatic labeling template–based ROIs were used (15). These ROIs were trimmed by obtaining the intersection with individual cortical masks generated from segmented T1-weighted MR images of each subject. For the skull, the ROIs were created from the segmented MR images. MR segmentation was performed using statistical parametric mapping (SPM8; Wellcome Trust Centre of Neuroimaging). All ROIs except for the midbrain were transformed to individual PET spaces on the basis of the transformation parameters of MR images coregistered to PET images. The ROIs for the midbrain including the locus coeruleus were drawn manually on summed PET images of each individual guided by their coregistered MR images. The following 9 ROIs were placed on PET images: the midbrain (0.71 ± 0.45 cm3), thalamus (15.5 ± 1.7 cm3), caudate (13.4 ± 3.9 cm3), and insular cortex (18.2 ± 3.4 cm3) from the deep brain regions; frontal cortex (134.7 ± 15.6 cm3), parietal cortex (23.3 ± 4.0 cm3), temporal cortex (110.5 ± 12.0 cm3), and occipital cortex (33.5 ± 4.2 cm3) from the superficial brain regions; and the skull (354.9 ± 55.4 cm3).
Effect of Defluorination
We evaluated the effects of defluorination on the quantification of NET density as follows: first, the accumulation of radioactivity in the skull was evaluated by visually inspecting PET images and the time–activity curves. Then, the effects of the spillover of PET signal from the skull to adjacent cerebral cortices were evaluated by performing a scan-time stability analysis in which we evaluated the stability of regional total distribution volumes (VT) estimated with a 2-tissue-compartment model (2TCM) for scan data of varying scan lengths (truncating scan data by 10 min from 240 to 220 min and 180 to 130 min, and by 5 min from 90 to 40 min). The rationale for this scan-time stability analysis is that when the tissue time radioactivity follows a compartment model, VT estimations are expected to be stable beyond a certain scan length. However, when tissue time radioactivities are contaminated by adjacent skull radioactivities that progressively increase over time, VT estimations are expected to be unstable because the tissue time radioactivities deviate from the compartment model.
Quantification of NET Density
In our previous study, the NET density of only deep brain regions was estimated in 2 ways: first by calculating AUC ratios using the caudate as the reference tissue on the scan data acquired from 120 to 180 min and second by estimating BPNDs from the entire 240-min scan data (14). In the present study, we evaluated whether scan data from only the first dynamic scan (0–90 min) would allow estimation of NET densities in the brain including the cerebral cortex. Our preliminary scan-time stability analysis of binding parameters indicated that the effects of defluorination on the superficial cerebral cortex are negligible for the initial 90 min because the process of defluorination is relatively slow. The NET density in the cerebral cortex is relatively low compared with the midbrain and thalamus, and the short scan duration of 90 min may be sufficiently long for its quantification because the compartment model predicts that the longer scan duration is needed for the higher the binding density. However, the question is whether the 90-min scan is sufficient for the quantification of moderate to high NET binding sites in deep brain regions. In the current study, we used the entire data from the 3 dynamic scans as a gold standard to validate the NET density estimations in deep brain regions from the 90-min scan data. We also validated the regional BPND values estimated with 90-min scans by comparing their rank order with that of a postmortem study (16). NET density estimations for the superficial cerebral cortex from the entire 240-min scan data may not be reliable because of defluorination effects. This issue was dealt with separately by the scan-time stability analysis (mentioned earlier). We estimated 2 NET binding parameters, BPND and AUC ratio, using the caudate as the reference tissue. BPND estimations were performed both with and without arterial blood data.
Quantification with Arterial Blood Data
BPND was estimated for each deep brain region for 90- and full 240-min data with the caudate as reference tissue. BPND was defined as where
where  and
and  are VT values of target regions and reference tissue caudate, respectively.
  values were estimated by 2TCM with individual arterial input functions. The 2 sets of BPND values were compared by correlation analysis. Then, we compared regional rank order of BPND values in all brain regions estimated with 90-min scan data with the known distribution of NETs reported by postmortem studies (16).
Quantification Without Arterial Blood Data
BPND as defined above can also be estimated without blood data. For this purpose, we used a multilinear reference tissue model (MRTM2), which is a robust graphical plot, by fixing  in the model of MRTM (17). The parameter,
  , is the clearance rate constant from the reference tissue (caudate). Here, in the reference tissue model estimation of BPND, we used individually estimated
  as well as a population mean value of
  calculated by applying MRTM to the 240-min scan data in the thalamus. Initially, BPND values were estimated with 90-min scan data by MRTM2 and were compared with those BPND values estimated with blood data. Then, BPND values estimated with various scan lengths (40–80 min) were also estimated to evaluate feasibility of even shorter scan lengths than 90 min in the quantification of NET density.
For the other binding parameter, AUC ratios, we calculated (AUC ratio − 1) between target regions and reference tissue caudate. We evaluated AUC ratios using scan data from several scan intervals ranging from 5 to 30 min at several different time points during 30- to 180-min scanning sessions after injection, because optimal timing for AUC ratios may differ depending on regions of varying NET densities. These (AUC ratio − 1) values were compared with the corresponding BPND values estimated by 2TCM.
RESULTS
Effects of Defluorination
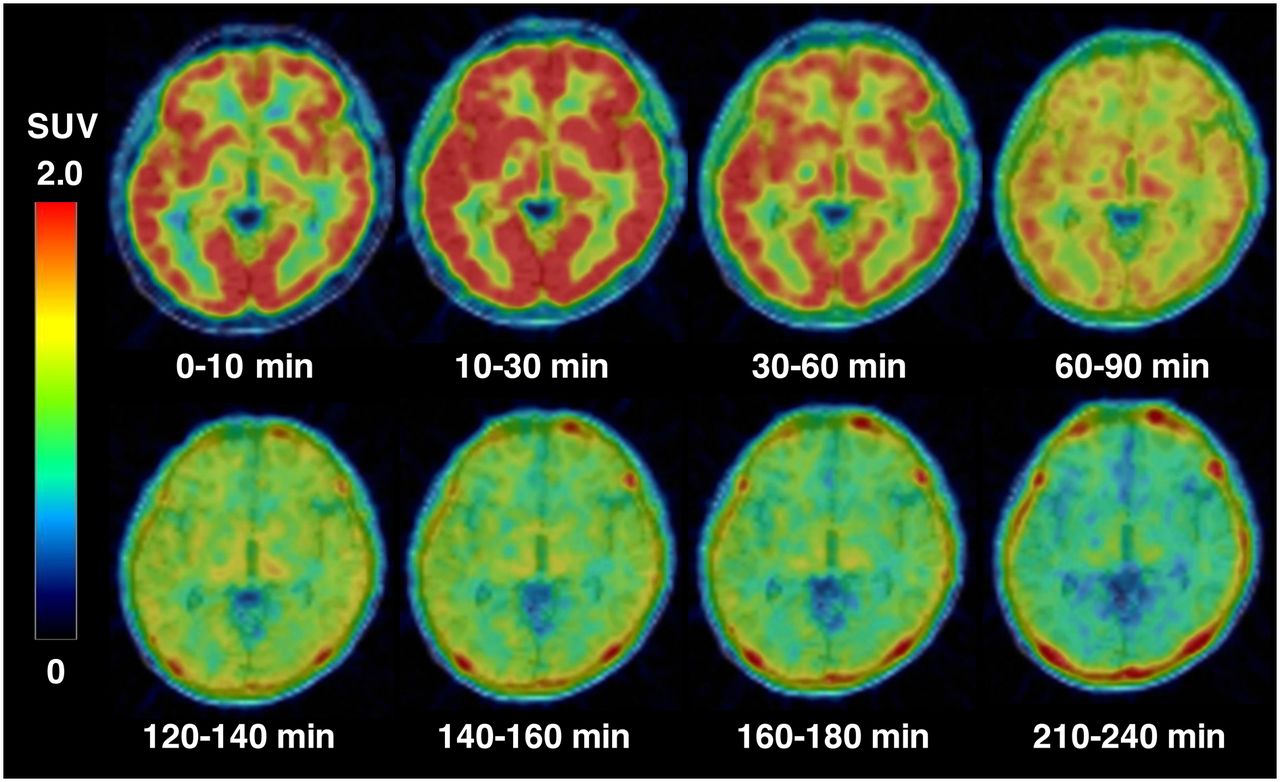
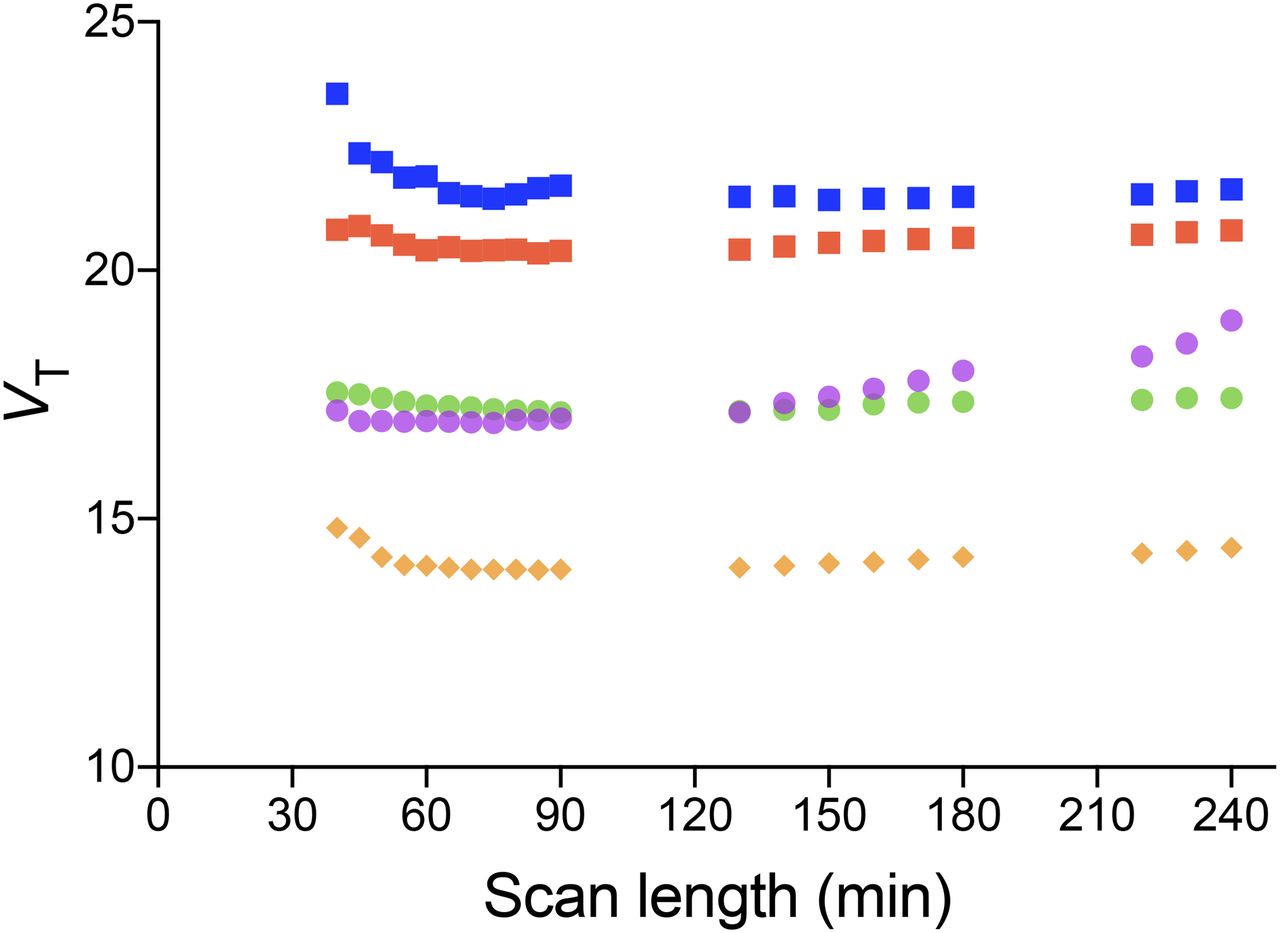
Defluorination of (S,S)-18F-FMeNER-D2 was slow, with its effects on the superficial cerebral cortex becoming prominent toward the latter half of the 240-min scan (Fig. 1). After injection of (S,S)-18F-FMeNER-D2, radioactivity represented the accumulation of (S,S)-18F-FMeNER-D2 in the cerebral cortex for the initial 90 min (Fig. 1). Radioactivity in the skull increased slowly and became progressively more prominent beyond 120 min (Fig. 2). The VT values in superficial cerebral cortical regions were not stable but increased as the scan duration increased beyond 120 min, whereas VT values in the deep brain regions were stable over time (Fig. 3).

Representative time course of radioactivity distribution in PET images of healthy subject injected with (S,S)-18F-FMeNER-D2. Transaxial PET images at level of midthalamus were obtained by averaging images for various time periods and were fused with corresponding T1-weighted MR images. Skull activity is evident from 120 min and beyond and becomes more prominent with time (bottom).

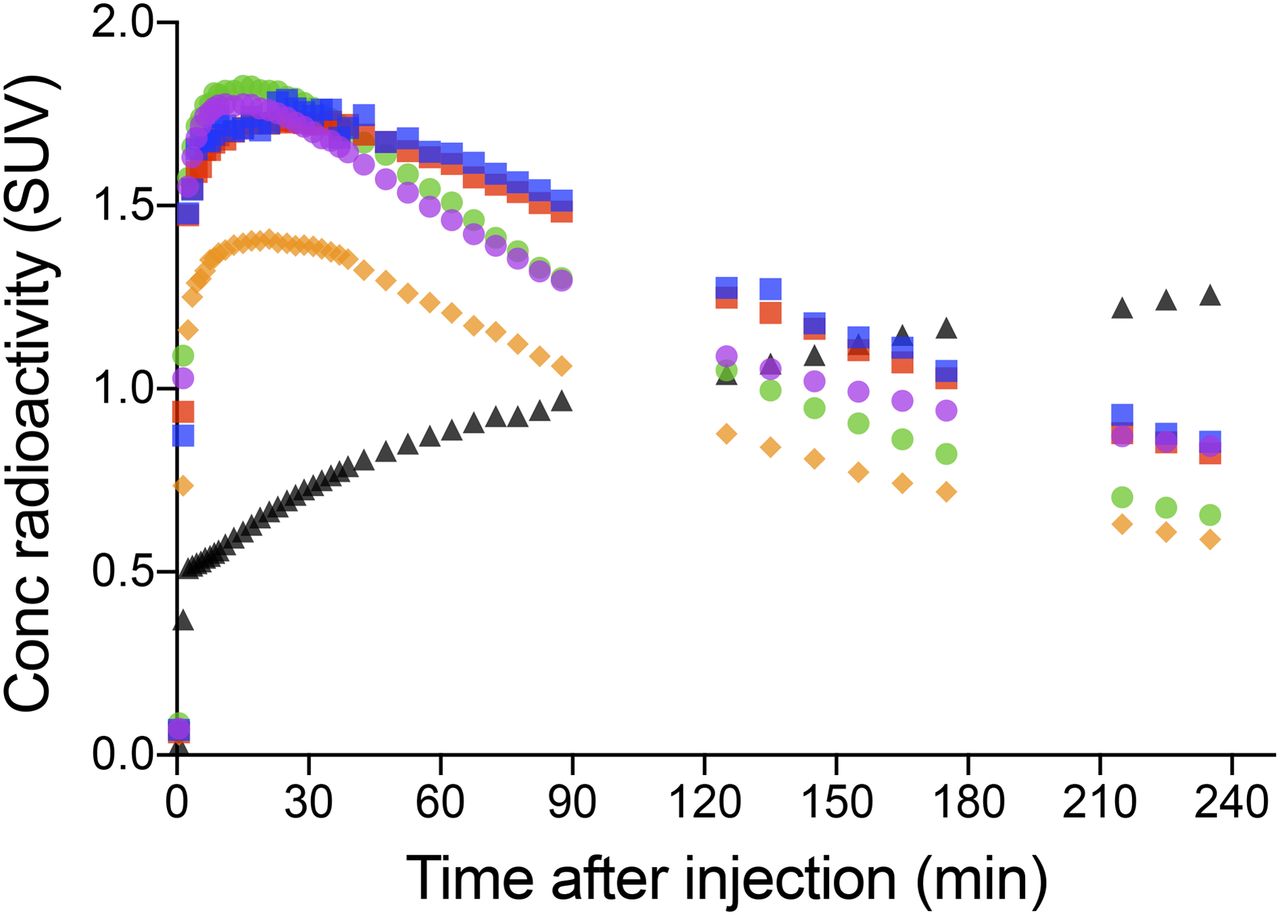
Average time–activity curves of radioactivity in midbrain (blue squares), thalamus (red squares), insular cortex (green circles), frontal cortex (purple circles), caudate (orange diamonds), and skull (black triangles) after injection of (S,S)-18F-FMeNER-D2. Data represent mean concentration radioactivity from 10 subjects. Skull activity (black triangles) slowly but progressively accumulates with time. Brain activities show a peak uptake and washout thereafter where washout for frontal cortex (purple circles) adjacent to skull is much slower than other deep brain regions.

VT as function of scan duration. VT values were estimated in midbrain (blue squares), thalamus (red squares), insular cortex (green circles), frontal cortex (purple circles), and caudate (orange diamonds) with 2TCM from data with scan durations truncated from 240 to 40 min. Data represent mean VT values from 10 subjects. Frontal cortex VT (purple circles) is seen increasing compared with other deep brain regions in which VT is relatively stable over time.
Validation of Quantification with 90-Minute Scan Data
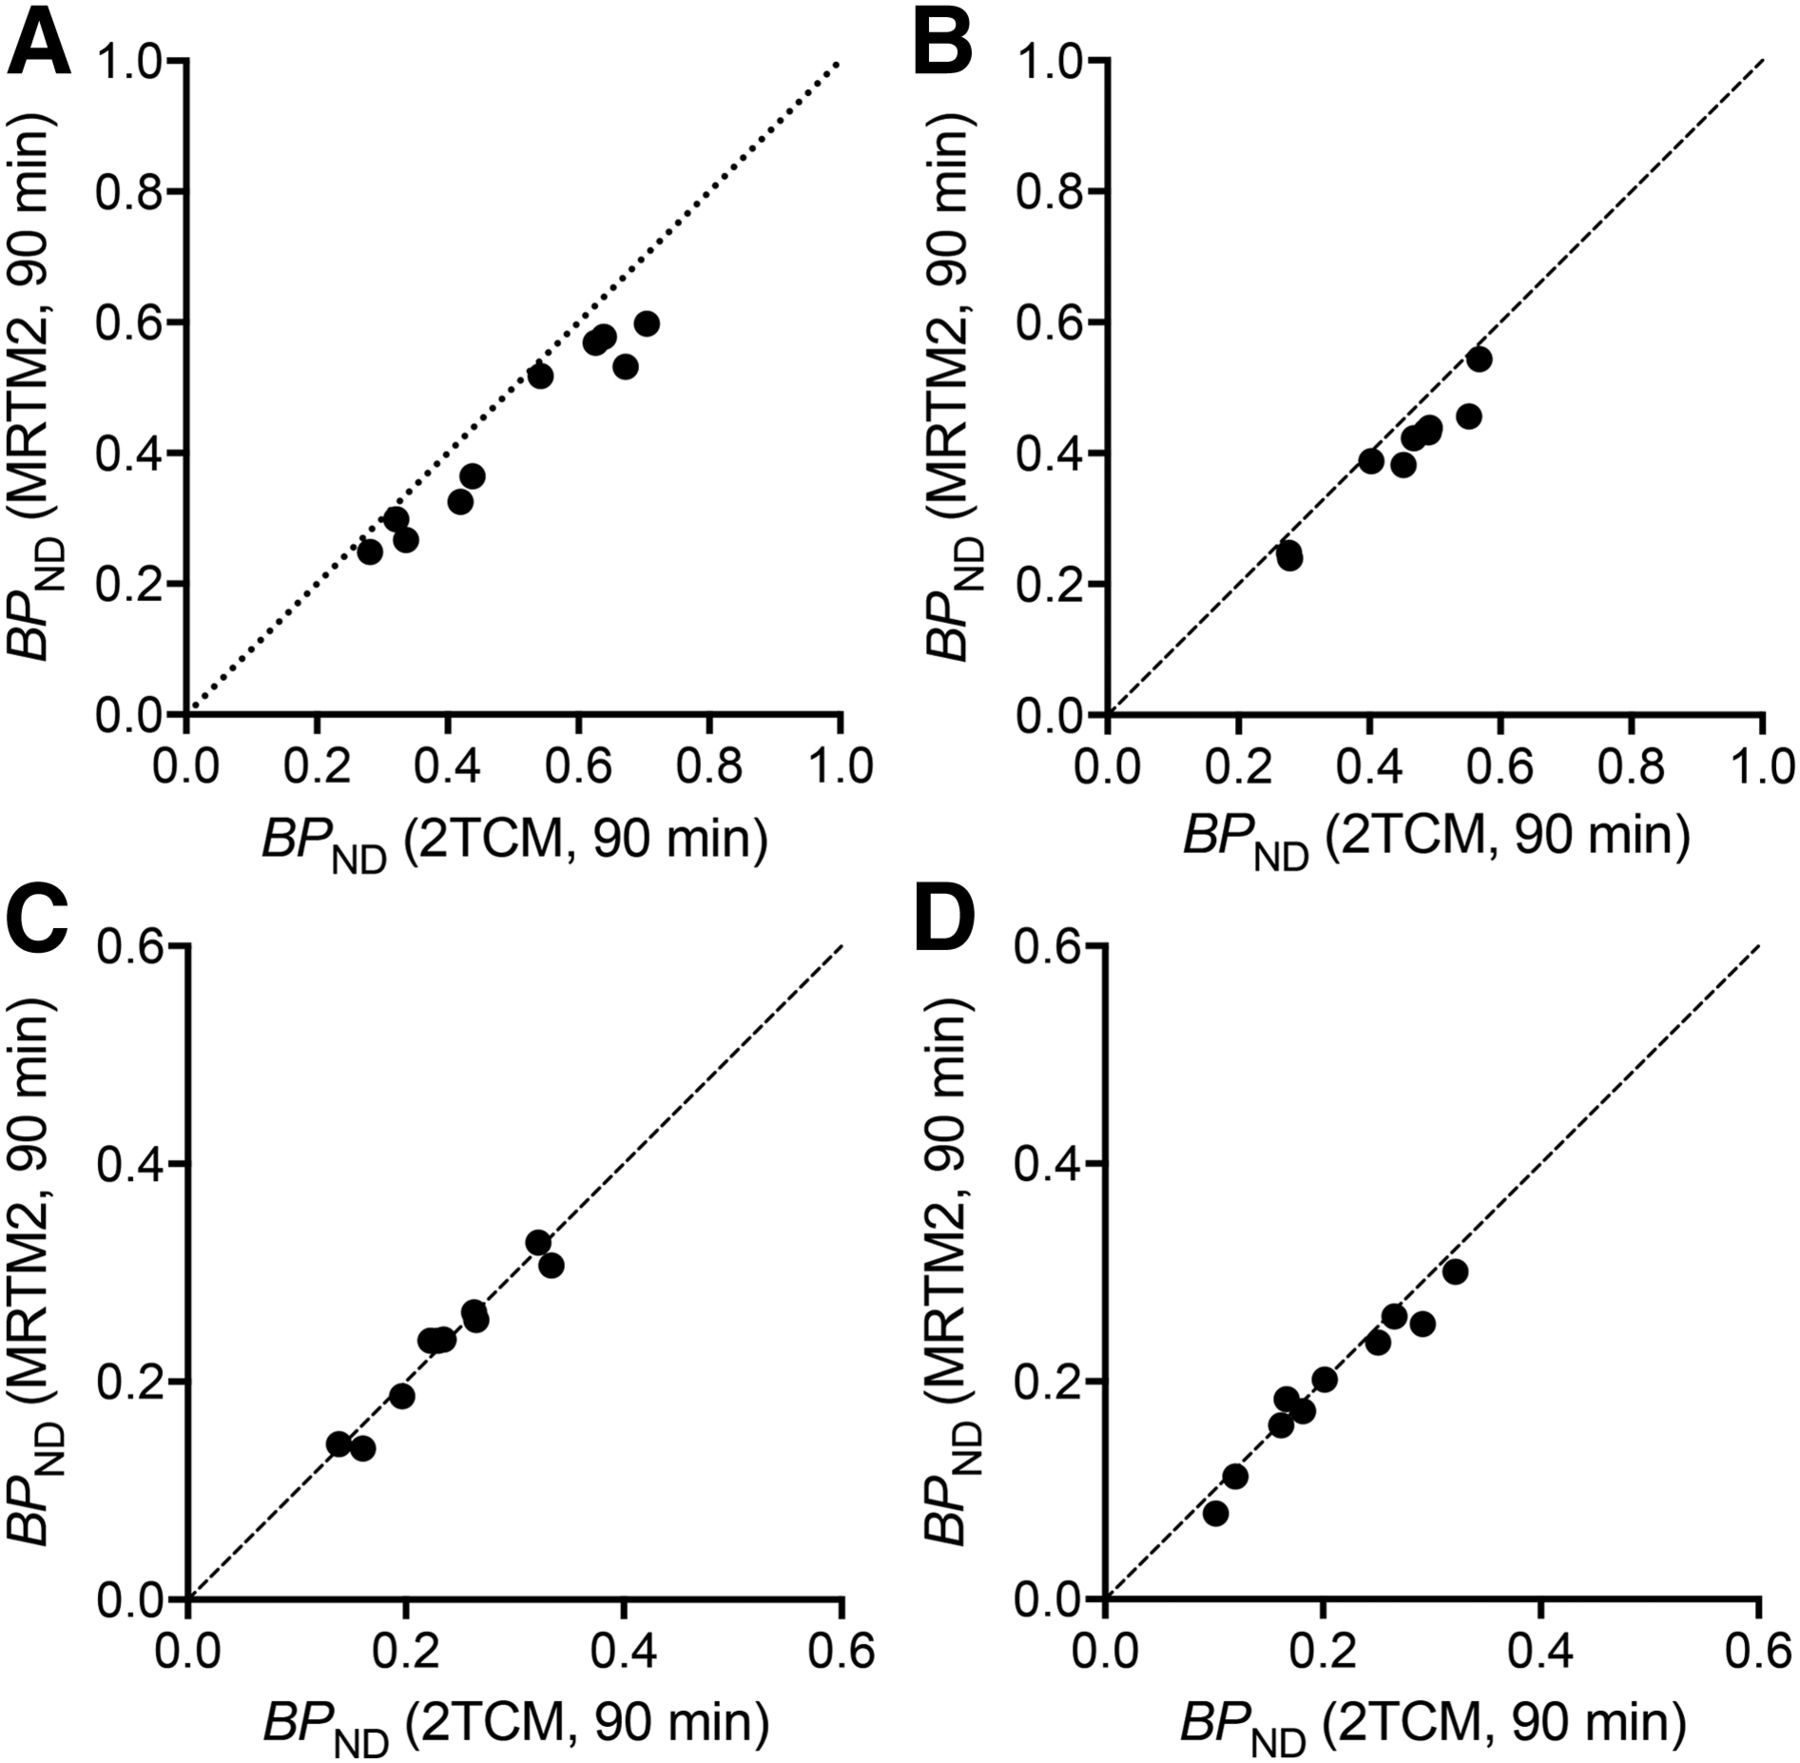
BPND values from 90-min scan data estimated with 2TCM matched well with those values from 240-min scan data in the midbrain, thalamus, and insular cortex (r2 = 0.91, 0.95, and 0.93, respectively; Figs. 4A–4C). These results indicated that 90-min scan data were sufficient for the quantification in those regions. However, in the cerebral cortical regions adjacent to the skull, BPND values of 240-min scans overestimated those values of 90-min scans by approximately 54% (r2 = 0.46; Fig. 4D), indirectly confirming the effect of skull activity spillover onto the superficial cerebral cortex. The rank order of the regional BPND values estimated with 90-min scans showed a good agreement with that of a postmortem study (Table 1). Therefore, together with the results of the scan-time VT stability analysis (above), we considered BPND values of 90-min scans but not 240-min scans for superficial cerebral cortices as correct values in the subsequent analyses.
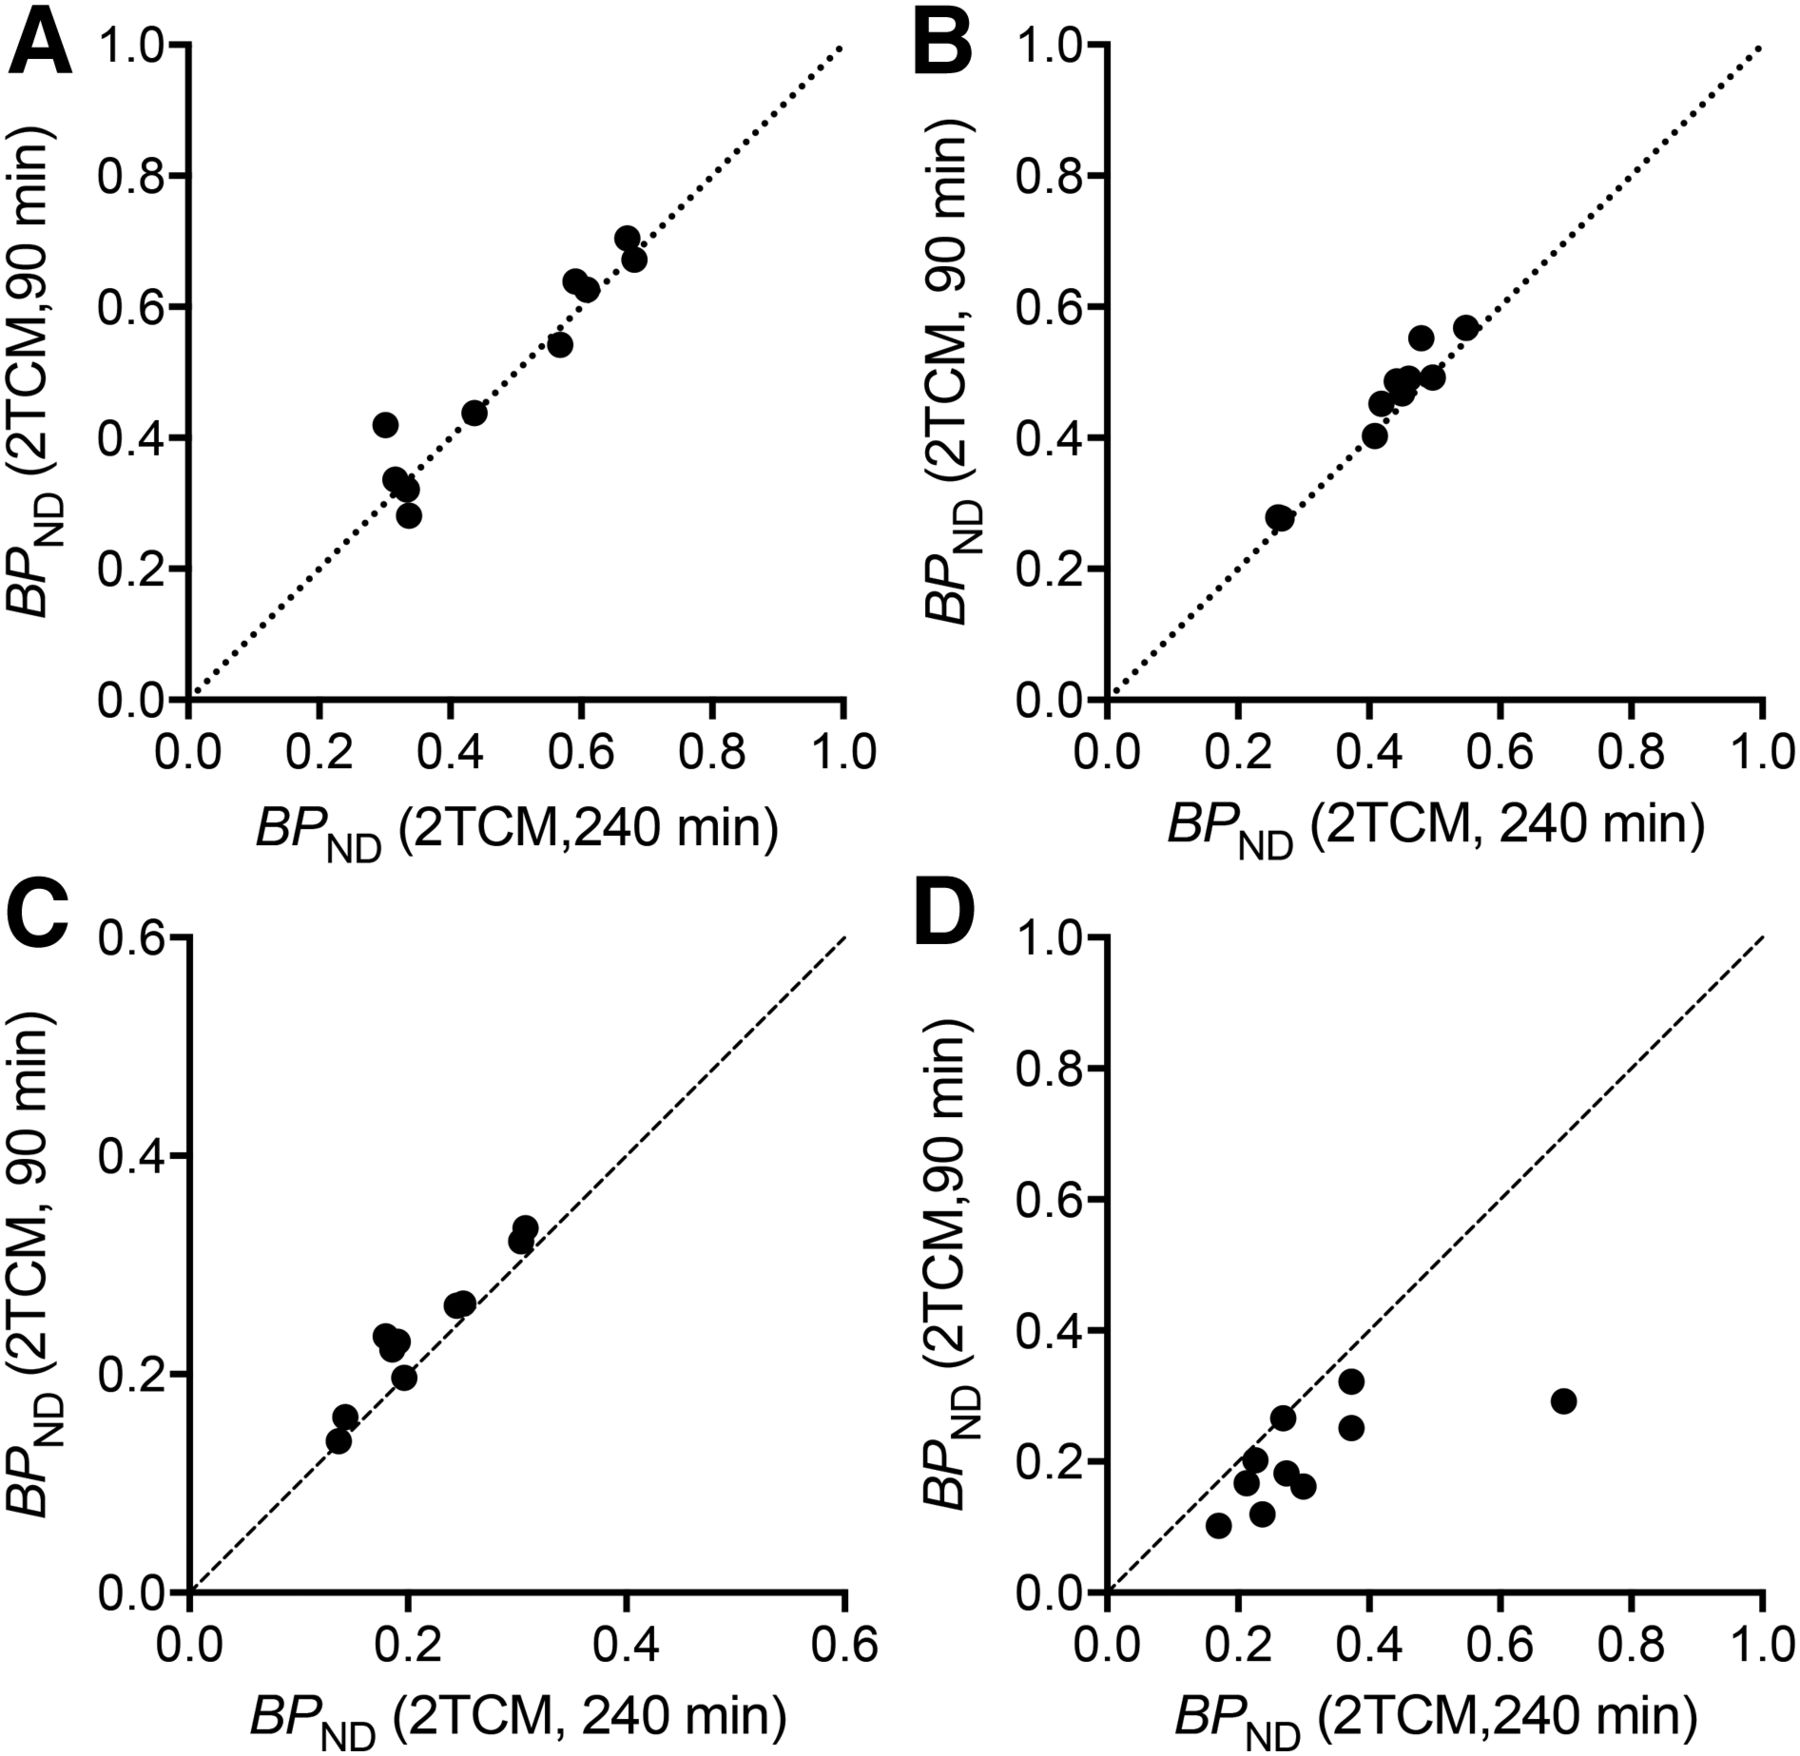
Correlations between BPND values estimated with 2TCM from 90- and 240-min scan data in midbrain (A), thalamus (B), insular cortex (C), and frontal cortex (D).
BPND Estimated with 2TCM and MRTM2 and AUC Ratio Data for 70–90 and 120–180 Minutes
Reference Tissue Model
Reference tissue model BPND values from 90-min data matched well with those values estimated from the same 90-min data with 2TCM in all regions (r2 = 0.95–0.96; Fig. 5). BPND values estimated using a population mean value of  (0.022 ± 0.0029 min−1) also matched well with those values estimated with 2TCM (data not shown). BPND values from scan data shorter than 90 min underestimated the value, particularly in the midbrain and thalamus (i.e., ∼20% underestimation with 60-min scan data but within 10% difference with 90-min data from those values estimated with 2TCM).

Correlations between BPND values estimated with 2TCM and MRTM2 from 90-min scan data in midbrain (A), thalamus (B), insular cortex (C), and frontal cortex (D).
AUC Ratio Method
For the midbrain and thalamus, the (AUC ratio − 1) of 120- to 180-min data correlated well to the BPND values estimated with 2TCM with the 90-min data (r2 = 0.82–0.86; Supplemental Fig. 1 [supplemental materials are available at http://jnm.snmjournals.org]). On the other hand, the (AUC ratio − 1) of 70- to 90-min data underestimated by 16%–18% those BPND values estimated with 2TCM from the 90-min data (r2 = 0.92–0.95; Figs. 2A and 2B). The (AUC ratio − 1) of earlier time points provided more underestimation of BPND values in the midbrain and thalamus. For example, (AUC ratio − 1) of 50- to 70-min data showed approximately 27% underestimation in those areas. For the insular and superficial cortical regions, the (AUC ratio − 1) of 70- to 90-min data were similar to and correlated well with the BPND values estimated with 2TCM from the 90-min data (r2 = 0.93–0.97; Supplemental Figs. 2C and 2D). The (AUC ratio − 1) of shorter scan lengths also provided values and intersubject variations similar to the value of 70- to 90-min data (i.e., 0.23 ± 0.07 from 85- to 90-min data and 0.23 ± 0.06 from 70- to 90-min data in the insula). The (AUC ratio − 1) of earlier time points as early as 60 min after injection provided values within a 10% difference from the value of 70- to 90-min data (i.e., ∼9% overestimation with the values from the 55- to 60-min data in the insula).
DISCUSSION
We have established and validated analysis methods of (S,S)-18F-FMeNER-D2 PET quantification of NET density in the brain including the cerebral cortex in which defluorination could potentially affect quantification results. First, we found that the radioactivity in the skull before 90 min after injection was not significantly high and did not significantly affect the quantification. Second, we verified that 90-min dynamic scans could provide a sufficient amount of data for the quantification of NET density in both the high- and the moderate-density regions. Finally, we have shown that 90-min dynamic scans or 70- to 90-min static scans without arterial blood sampling allowed for the accurate quantification of NET density in the cortical regions adjacent to the skull despite of potential effects of defluorination.
18F-labeled radioligands can defluorinate and liberate 18F ion, which accumulates in the skull, often hampering quantification in the cortical regions adjacent to the skull due to the spillover of the skull radioactivity. Defluorination processes are usually a slow event. Therefore, if the kinetics of the parent radioligand in the brain are much faster than the accumulation of the defluorination radioactivity, such defluorination will cause little effect on the quantification. However, in the case of (S,S)-18F-FMeNER-D2, the kinetics of the radioligand in the brain are relatively slow and the quantification of the NET density in the superficial cortical regions can be affected by the contamination of PET signal because of the limited spatial resolution of PET.
Effect of Defluorination
In this study, we carefully investigated the potential effects of defluorination on the quantification in different ways including scan-time stability analysis. We found stable estimations of VT with scans ranging from 60 to 240 min in duration for deep brain regions, whereas we found VT values increased with the scan duration beyond 90 min for superficial cortical regions, although VT values were stable, with scans ranging from 60 to 90 min (Fig. 3). We interpreted that increases of VT with scan durations longer than 90 min can be attributable to the effects of the contamination of PET signal due to the accumulation of 18F ion in the skull liberated from (S,S)-18F-FMeNER-D2 by its defluorination, and the quantification with shorter than 90-min scan length was not affected by the defluorination. The reason for our interpretation is that the VT increase was seen only in the superficial cortical regions and not in the deep brain regions. Radiometabolites entering the brain can also affect the quantification results. However, scan time unstable VT estimations would be similar in degree across brain regions (18,19). We also confirmed that the effects of spillover are limited in the superficial cortices by generating parametric images (Supplemental Fig. 3).
Reference Tissue Model
We chose MRTM2 as a reference tissue model for a less-invasive way of quantification. In our previous study, quantification of (S,S)-18F-FMeNER-D2 PET with reference tissue models including the simplified reference tissue model and MRTM was unstable to estimate BPND values in the regions except the thalamus (14). However, in this study, we found that the quantification with 90-min scans and MRTM2 was feasible in all brain regions when we used individual  values calculated by applying MRTM to the 240-min scan data in the thalamus. We also found equally good quantification results with 90-min scans using a population mean value of
  . With the population mean value of
  , the quantification can be achieved with as short a scan as 90 min. Because
  is an efflux rate constant from the reference tissue, its interindividual difference is expected to be small.
AUC Ratio Method
Another quantification without arterial blood sampling is the AUC ratio method. The AUC ratios were dependent on time periods for their calculation, and the optimal time periods differed among regions. For high-density regions such as the midbrain and thalamus, tissue ratios became stable after 120 min. The (AUC ratio − 1) of 120- to 180-min data matched well with the BPND values estimated with 2TCM with the 90-min data (Supplemental Fig. 1), whereas the (AUC ratio − 1) of scan data of 70–90 min and earlier showed underestimation (Supplemental Figs. 2A and 2B). Thus, the (AUC ratio − 1) of 120- to 180-min data is optimal. On the other hand, in moderate to low binding regions such as cortical regions, irrespective of these regions being in the deep brain or close to skull, the (AUC ratio − 1) of 70- to 90-min data matched well with the BPND values estimated with 2TCM with the 90-min data (Supplemental Figs. 2C and 2D). Although the (AUC ratio − 1) of short scan lengths (5–10 min) and early time points (up to 60 min) provided similar results for those regions, we believe the (AUC ratio − 1) of 70- to 90-min data is optimal, because the (AUC ratio − 1) of 70- to 90-min data can also be used for the quantification in the high-density regions with minimal underestimation, and the 20-min scan length, which is feasible for most patients, can theoretically provide better statistics possibly with a better test–retest variation than the shorter scan lengths can provide.
The (AUC ratio − 1) can be measured less invasively with a shorter scan length and showed slightly better intersubject variability than BPND values by MRTM2 (Table 1). However, (AUC ratio − 1) values are not independent of cerebral blood flow or the systemic clearance of the radioligand (20). Thus, the AUC ratio method is more suited for the patients who cannot endure the long scans, and estimating BPND values by MRTM2 should be more suited for long-term longitudinal studies.
Comparison with Other Ligand: (S,S)-11C-MRB
For the quantification of NET density in the cerebral cortex, (S,S)-18F-FMeNER-D2 with the current methods provides more precise outcome measures than (S,S)-11C-MRB does. Intersubject variability of BPND values of (S,S)-11C-MRB estimated from Figure 3 in Logan et al. (21) reported as (DVR − 1) was more than 100% coefficient of variance in the frontal cortex, which was approximately 30% with (S,S)-18F-FMeNER-D2 using the current methods, MRTM2 or AUC ratio. Therefore, (S,S)-18F-FMeNER-D2 is clearly a better estimator of NET density in the cerebral cortex than (S,S)-11C-MRB.
CONCLUSION
We have established a method of quantification to estimate NET density in the cerebral cortex using (S,S)-18F-FMeNER-D2. With a 90-min dynamic scan, the NET density in the cerebral cortex and thalamus can be precisely estimated using MRTM2. With a short static scan for 70–90 min, NET density can alternatively be estimated as AUC ratios in the cerebral cortex but with a slight underestimation in the midbrain and thalamus. For the midbrain and thalamus, AUC ratios with a static scan for 120–180 min provided a good estimation of NET density. These methods should be useful for investigating NET density in the variety of brain regions in clinical research of neuropsychiatric disorders using (S,S)-18F-FMeNER-D2.
DISCLOSURE
This study was partially supported by the Strategic Research Program for Brain Sciences from Japan Agency for Medical Research and Development, AMED. No other potential conflict of interest relevant to this article was reported.
Acknowledgments
We thank Takashi Horiguchi for his assistance as the research manager and Masayo Kurokawa, Yuko Toyoda, and Yuko Iwasawa for their assistance as secretaries.
Footnotes
Published online Dec. 15, 2016.
- © 2017 by the Society of Nuclear Medicine and Molecular Imaging.
REFERENCES
- Received for publication June 21, 2016.
- Accepted for publication December 5, 2016.


Jump to section
Related Articles
Cited By...
- No citing articles found.