


Abstract
Brown adipose tissue (BAT) provides a means of nonshivering thermogenesis. In humans, active BAT can be visualized by 18F-FDG uptake as detected by PET combined with CT. The retrospective analysis of clinical scans is a valuable source to identify anthropometric parameters that influence BAT mass and activity and thus the potential efficacy of envisioned drugs targeting this tissue to treat metabolic disease. Methods: We analyzed 2,854 18F-FDG PET/CT scans from 1,644 patients and identified 98 scans from 81 patients with active BAT. We quantified the volume of active BAT depots (mean values in mL ± SD: total BAT, 162 ± 183 [n = 98]; cervical, 40 ± 37 [n = 53]; supraclavicular, 66 ± 68 [n = 71]; paravertebral, 51 ± 53 [n = 69]; mediastinal, 43 ± 40 [n = 51]; subphrenic, 21 ± 21 [n = 29]). Because only active BAT is detectable by 18F-FDG uptake, these numbers underestimate the total amount of BAT. Considering only 32 scans of the highest activity as categorized by a visual scoring strategy, we determined a mean total BAT volume of 308 ± 208 mL. In 30 BAT-positive patients with 3 or more repeated scans, we calculated a much higher mean probability to redetect active BAT (52% ± 25%) as compared with the overall prevalence of 4.9%. We calculated a BAT activity index (BFI) based on volume and intensity of individual BAT depots. Results: We detected higher total BFI in younger patients (P = 0.009), whereas sex, body mass index, height, mass, outdoor temperature, and blood parameters did not affect total or depot-specific BAT activity. Surprisingly, renal creatinine clearance as estimated from mass, age, and plasma creatinine was a significant predictor of BFI on the total (P = 0.005) as well as on the level of several individual depots. In summary, we detected a high amount of more than 300 mL of BAT tissue. Conclusion: BAT-positive patients represent a group with a higher than usual probability to activate BAT during a scan. Estimated renal creatinine clearance correlated with the extent of activated BAT in a given scan. These data imply an efficacy of drugs targeting BAT to treat metabolic disease that is at the same time higher and subject to a larger individual variation than previously assumed.
Brown adipose tissue (BAT) is a thermogenic organ well studied in small rodent species that is able to dissipate nutrient energy in the form of heat. Before the advent of PET combined with CT as a diagnostic tool to detect 18F-FDG uptake, active BAT in adult humans was considered nonexistent or negligible. In 2002, Hany et al. for the first time reported an increased uptake of labeled glucose (18F-FDG) into adipose tissue depots using a combined 18F-FDG PET/CT (1). The most intensive tracer uptake was identified in cervical, supraclavicular, paravertebral, mediastinal, and rarely subphrenic locations. Because of the strong symmetry of increased tracer uptake, these findings were not compatible with a malignant tissue, other nonspecific changes (e.g., inflammation), or muscular activity (2). In 2009, 3 independent studies finally reported the unequivocal interpretation of said signals as metabolically active BAT (3–5). In clinical practice, activated BAT disturbs diagnosis (6). Particularly in the context of tumor diagnosis, this is a not-to-be-underestimated problem (7–10). Knowledge about the causes of BAT activation and its suppression are therefore of interest in the context of clinical 18F-FDG PET/CT examinations (11,12).
The prevalence of 18F-FDG PET/CT–detected, active BAT in retrospective studies varies between 1% and 10% in adult patients (13–17). However, in a study analyzing biopsies, a much higher BAT prevalence of 84% was found (18). Obviously, the detection of human BAT is often prevented by inactive tissue without glucose uptake. Known factors that promote the incidence of active BAT are age, sex, body mass, plasma glucose, time of season, outdoor temperature, and certain drugs taken by the patient (8,14,19–23).
By its glucose uptake, activated BAT may lower glucose and insulin levels in patients with extended areas of active BAT. It has been discussed whether a high BAT activity may positively affect glucose metabolism (24,25). The main energy source of thermogenic BAT, however, is fat, some of which is imported from the blood (26). It is thus assumed that brown fat lowers blood lipids, which may result in a positive effect on the development of atherosclerotic vascular changes (27,28). Thus, the quantitative measurement of active BAT is of great interest because of its potential role as a pharmacologic target organ to treat widespread metabolic disease including obesity, diabetes, and dyslipidemia (24–28).
In this study, we analyzed archived clinical 18F-FDG PET/CT scans. BAT-positive subjects formed a distinct subgroup of patients that was extensively characterized. We determined total and regional brown fat mass and activity as a basis for efficacy projections of putative BAT-activating drugs and uncovered correlating clinical parameters possibly able to serve as novel BAT activity indicators or predictors.
MATERIALS AND METHODS
Data Acquisition
We analyzed all 18F-FDG PET/CT (Biograph mCT; Siemens Healthcare) examinations acquired between September 2011 and August 2012 at the Department of Nuclear Medicine, Technical University of Munich, Germany. BAT-positive scans were defined as showing symmetric tracer retention in projection on CT morphologic adipose tissue (−250 to −50 Hounsfield units). All patients fasted for about 4 h before the examination. Injected activities for 18F-FDG ranged from 148 to 493 MBq, with a mean of 357 MBq. About 88 ± 15 min after tracer injection, the examination was performed. The CT scan protocol included a low-dose CT (26 mAs, 120 kV, 5-mm slice thickness) from the base of the skull to the mid thigh for attenuation correction followed by the PET scan and in most cases a contrast-enhanced CT (240 mAS, 120 kV, 5-mm slice thickness) in the portal venous phase approximately 70–80 s after contrast fluid injection. PET scans were obtained with 5–7 bed positions of 2–3 min each. PET data were reconstructed as 128 × 128 pixel images. Images were reconstructed by an attenuation-weighted ordered-subsets expectation maximization algorithm (4 iterations, 8 subsets) followed by a postreconstruction smoothing gaussian filter (5 mm in full width at half maximum). A total of 2,854 PET examinations were evaluated in 1,644 patients. The institutional review board (or equivalent) approved this study, and all subjects signed a written informed consent form.
Image Analysis
Visual evaluation of PET images was assisted by software (Osirix, 64-bit version; Aycan Digital Systems) running on a Macintosh/OS X, version 10.10.3 platform (Apple Inc.). A semiquantitative measurement of SUVs and activated BAT volume were evaluated on a SYNGO workstation (Siemens). Depots showing a high metabolic activity with at least 2.0 g per milliliter of 18F-FDG uptake in projection of fatty tissue (−250 to −50 Hounsfield units) in the typical localizations of CT correlation were defined as BAT-positive. For semiquantitative SUVmean evaluation, we used a 3-dimensional volume of interest with a growing seeded method.
Statistical Analysis
We compared BAT-positive and BAT-negative patient groups with 2-sided t tests when normally distributed (Table 1) or with a nonparametric Mann–Whitney test if not normally distributed (Supplemental Figs. 1C and 3 [supplemental materials are available at http://jnm.snmjournals.org]). Sex distribution within groups was compared by the Fisher exact test. The relationship between age/body mass index (BMI) and number of active BAT depots was analyzed both by linear regression using depot number as a numeric value and by 1-way ANOVA using depot number as categoric values (Supplemental Figs. 1A and 1B). Correlation between BAT activity index (BFI) and BMI, age, or renal creatinine clearance was analyzed by nonparametric Spearman correlation analyses (Supplemental Figs. 4 and 5). Alternatively, we analyzed log-transformed BFI data with linear regression analyses and identified the same groups to be significantly correlated as those by the Spearman method. Analyses were performed using software (GraphPad Prism 6 [GraphPad Software] and SPSS [IBM]).
Age, Sex, and BMI in Case Group, Control Group, and Total Study Population
RESULTS
Detection of High Amount of BAT
We found 98 scans (81 patients) with activated BAT among 2,854 evaluated 18F-FDG PET/CT scans. These 98 scans strongly varied in the extent of BAT and thus in the severity of putative interference with tumor diagnosis. To classify 18F-FDG uptake into clinically relevant categories, we proposed a visual scoring system of 4 scores: 1, lower than liver; 2, comparable to liver; 3, higher than liver; and 4, comparable to brain (Figs. 1A and 1B).
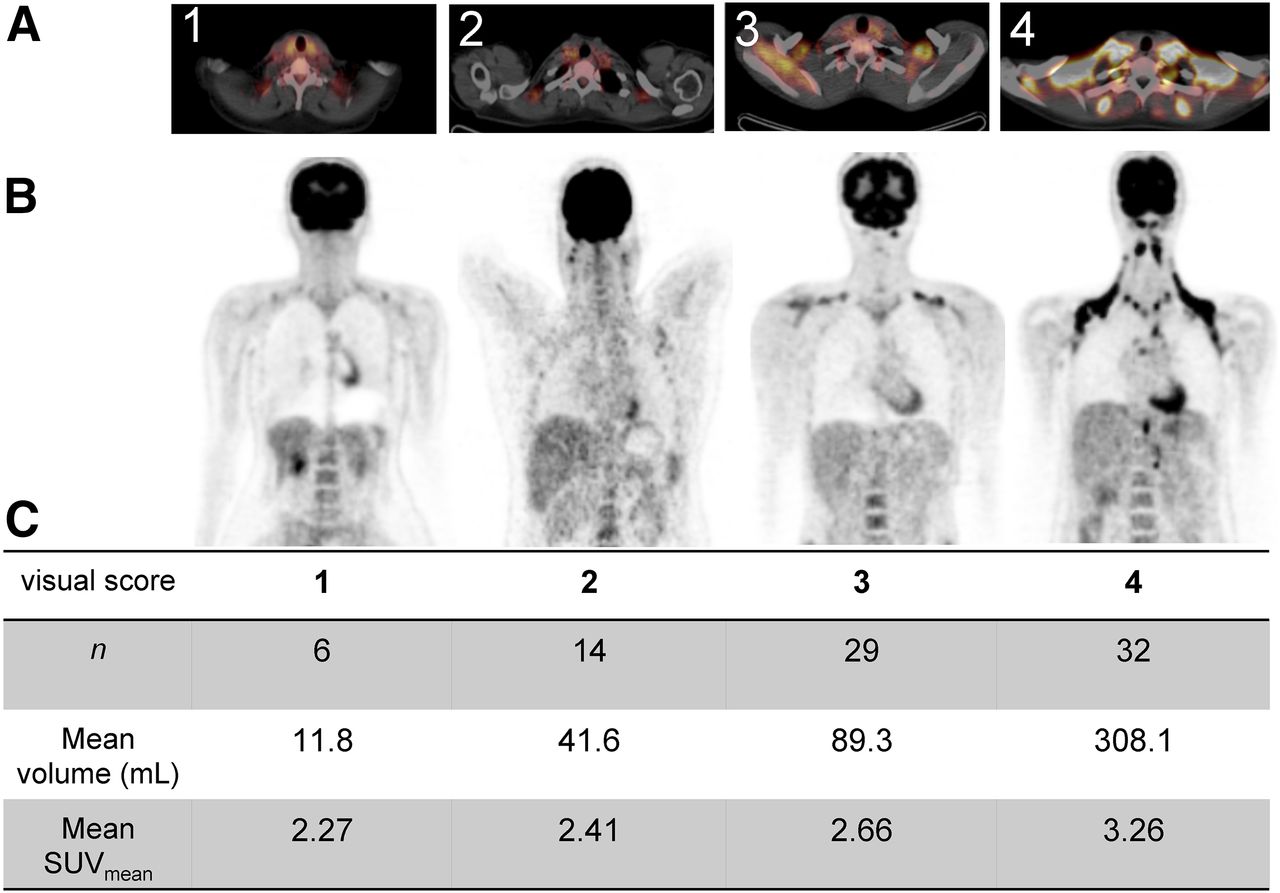
Illustration of visual score 1–4 in axial images of fused PET/CT (A) and coronal (B) slices of PET of supraclavicular region. Table in C denotes number of BAT-positive patients in given score category (n), mean volume of total BAT (mL), and SUVmean of respective score.
Taking into account only the scan with the most intense BAT activity for patients with multiple positive scans, this procedure resulted in 6 patients with score 1, 14 with score 2, 29 with score 3, and 32 with score 4 (Fig. 1C). The mean SUVmean ranged from 2.27 in score 1 to 3.26 in score 4. Mean total volume of active BAT ranged from 11.8 mL in score 1 to 308.1 mL in patients of score 4. This volume was determined by a cutoff value, and therefore an underestimation due to low spatial resolution of the PET technique is low. However, by overlooking small nests of active brown fat cells, the true volume may be even higher.
We defined 5 different anatomic BAT locations: subphrenic, paravertebral, mediastinal, cervical, and supraclavicular. With increasing overall BAT activity, the number of active depots increased from cranial to caudal. Young patients tended to activate more depots whereas BMI and sex did not play a role (Supplemental Fig. 1). Of 98 BAT-positive scans, all 5 depots were active in only 26 scans, all of them score 4. We thus assumed that score 4 does not describe patients with unusually high amounts of BAT, but rather patients who have fully activated all BAT present during the respective scan. Along this line, the 308.1-mL mean BAT volume of 32 BAT-positive score 4 scans may be regarded as reflecting the true total BAT volume better than the mean volume of 162 ± 183 mL of all 98 scans.
In summary, the visual score we proposed correlates well with volume and SUV. Patients with fully active BAT (score 4) display a surprisingly high amount of BAT.
Positive Patients Form Subgroup More Likely to Activate Brown Fat During Scanning
The prevalence of patients with at least 1 positive scan was 4.9% (81/1,644). Age and sex displayed a striking impact on the probability to detect active BAT as quantified in a comparison of BAT-positive patients (n = 81) with the remaining BAT-negative patient population (n = 1,563). The mean age of BAT-negative patients in the overall cohort was much higher than in BAT-positive patients (60 ± 15 vs. 38 ± 17 y; P < 0.001) (Fig. 2A). Prevalence in women (7.1%; 54/761) differed from men (3.1%; 27/883), resulting in a different ratio of male to female patients in the BAT-negative as compared with the BAT-positive group (P < 0.001) (Fig. 2B). Thus, the typical BAT-positive patient is more often female and by far younger than a random patient of the total cohort.
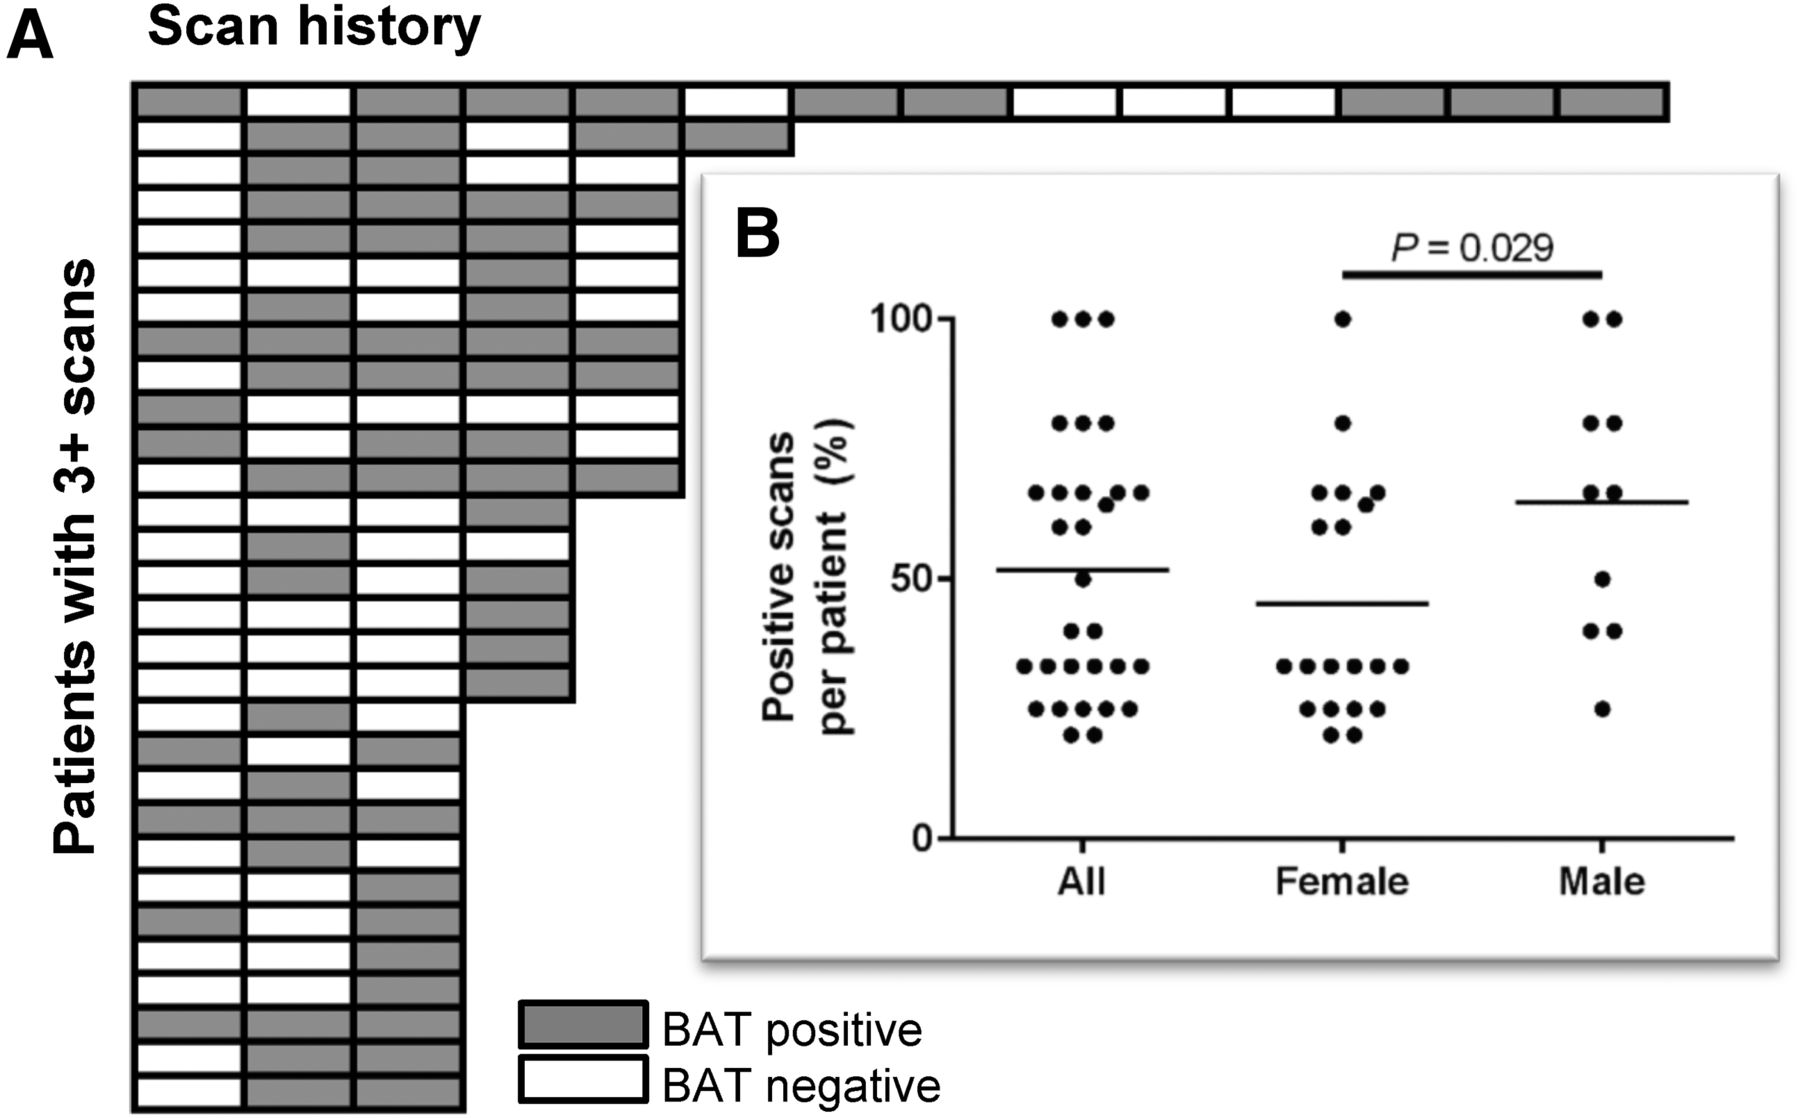
From the literature, it is clear that many more human subjects feature activatable BAT than detected during routine clinical 18F-FDG PET/CT scans. In fact, virtually all young subjects display BAT activity when challenged by cold exposure (5,29). The different age and sex composition of BAT-positive and BAT-negative patients in our study does therefore not imply a higher BAT incidence in young females but a higher probability to activate BAT during a clinical scan. To quantify this increased probability, we identified 30 of the 81 BAT-positive patients with 3 or more repeated scans in our archive (including scans outside the initially selected period of 1 y). In these 30 patients, we indeed calculated a much higher mean probability to redetect active BAT (52% ± 25%) as compared with the overall prevalence of 4.9% (Fig. 3). Interestingly, the percentage of positive scans was higher in male than in female patients (P = 0.029). Although women were more likely to be BAT-positive (Fig. 2B), those men who were BAT-positive were more consistently so (Fig. 3, inset).

(A) Age distribution in BAT-positive and BAT-negative patients. Data are represented as histogram with bin width of 10 y. Mean age differed between groups (P > 0.0001, 2-sided t test). (B) Sex distribution in BAT-positive and BAT-negative patient groups is different (P = 0.0002, Fisher exact test).

(A) Graphical representation of scan history of 30 patients with 3 or more repeated scans. Each row of boxes represents single patient, with gray boxes indicating BAT-positive scans and white boxes BAT-negative scans. (B) Inset displays a quantification of positive scans per patient (%) of data visualized in A, including horizontal mean value bars. Probability of redetecting BAT is higher in male than in female patients (P = 0.0286, nonparametric Mann–Whitney test).
In summary, BAT-positive patients clearly represented a group with higher than usual probability to activate BAT during a clinical scan.
Case-Control Design Reveals Effect of Temperature and Season on Probability to Activate Brown Fat
Patients with active BAT differed markedly from the total study population in age and sex (Fig. 2). We created a control group that matched the BAT-positive (case) group in these 2 parameters to possibly uncover parameters correlating to BAT activation with lower effect size. The case group was formed by the 81 patients with 98 BAT-positive scans during the investigation period. Each patient of this case group was assigned a random patient with the same age and sex, but without BAT activity. These 81 patients underwent 97 BAT-negative scans during the investigation period.
The stratified data were designed to display no difference in age and sex distribution and, in addition, did not reveal a difference in BMI between case and control group (Table 1). We cannot decide whether a BMI difference was removed by the stratification or whether it never existed in the first place, because for practical reasons we were unable to extract BMI data for the entire collective of 1,644 patients. In any case, a possible BMI difference between the BAT-positive group and the total collective would have been secondary to differences in age and sex, because no difference persisted in the case-control design (Table 1). Further parameters tested without a significant difference between BAT-positive case and BAT-negative control group patients included body mass and height; waiting time between tracer injection and scanning; administered amount of activity; and the blood parameters glucose, creatinine, and thyroid-stimulating hormone (not shown). Taken together, no anthropometric or procedural parameter influenced the probability to active BAT when effects of age and sex were removed. The same is true for disease states: a connective, pathophysiologic element could not be identified and thus disease state did not influence BAT activity in our dataset, with the possible exception of thyroid carcinoma, an association to be corroborated by future studies (Supplemental Fig. 2).
The influence of climatic factors on the probability to activate thermogenic BAT was assessed by researching average and minimal daily outdoor temperature at the time of each individual scan obtained from a weather station of the German weather service (Deutscher Wetterdienst) at Munich Airport. Both average and minimal temperatures were drastically lower in the case group (average, 11.8°C vs. 14.7°C, P = 0.024; minimal, 1.6°C vs. 6.7°C, P < 0.0001) (Figs. 4A and 4B). This finding led us to sort case and control group scans into an annual distribution to dissect temperature from possibly primary photoperiod effects (30). The number of BAT-positive scans followed a seasonal/photoperiodic profile, with a lower incidence during the summer months (Fig. 4C). This pattern was absent in the control group. To statistically distinguish influences of temperature from those of photoperiod, we tested for differences in daily minimal temperature within the summer months June, July, and August and within the rest of the year, respectively. In both timespans, minimal daily temperature remained different between case and control group (summer, P = 0.040; rest of the year, P = 0.001; data not shown) and is thus a predictor of BAT activation independent of photoperiodic effects.

(A) Average daily outdoor temperature during 18F-FDG PET/CT scan is different between BAT-positive case and BAT-negative control group (P = 0.024, 2-sided t test). (B) Minimal daily outdoor temperature during 18F-FDG PET/CT scan is different between BAT-positive case and BAT-negative control group (P < 0.0001, 2-sided t test). (C) Annual distribution of scans in BAT-positive case and BAT-negative control group differs in pattern.
Taken together, we corroborated outdoor temperature as a strong predictor of BAT activation independent of photoperiod. Contrary to multiple earlier reports (4,5,14,23,29,31,32), we did not detect a primary effect of BMI on the probability of BAT activation in this case-control study.
Depot-Resolved Analysis Reveals Effects of Renal Creatinine Clearance on Brown Fat Activity
We determined volume and SUVmean for every BAT depot location as defined above and calculated a depot-specific brown fat activity index by multiplying volume by intensity (Table 2). By BFI, individual depots contributed to total BAT activity in the following ascending order: subphrenic, paravertebral, mediastinal, cervical, and most prominently supraclavicular BAT. Use of the BFI allowed the search for correlating anthropometric and clinical parameters on the total as well on the depot level.
Depot-Resolved Brown Fat Activity
Total BFI varied across a large range of more than 3 orders of magnitude (3 to 3,990). We observed no sex difference in mean BFI, neither on the total, nor on the depot level (Supplemental Fig. 3). The same was true for body mass; height; outdoor temperature; the plasma parameters glucose, creatinine, or thyroid-stimulating hormone; and the procedural parameters waiting time between tracer injection and scan or injected activity (not shown). The BMI of patients did not predict BFI on the total level nor in any individual depot (Supplemental Fig. 4). Age was significantly correlated to total and supraclavicular BFI, but not in smaller depots (Supplemental Fig. 5). We calculated an estimate for renal creatinine clearance from plasma creatinine, body mass, and age of patients (33). Surprisingly, clearance proved the strongest predictor of BFI identified in our study (r = 0.344, P = 0.007, Fig. 5), although neither body mass nor creatinine alone displayed any correlation with BFI (not shown). All individual BAT depots contributed to this effect in a seemingly similar fashion, although correlation reached statistical significance in supraclavicular and mediastinal depots only. Hence, of patients activating BAT during a clinical 18F-FDG PET/CT scan, patients with a high estimated renal creatinine clearance displayed more BAT activity across all depots.
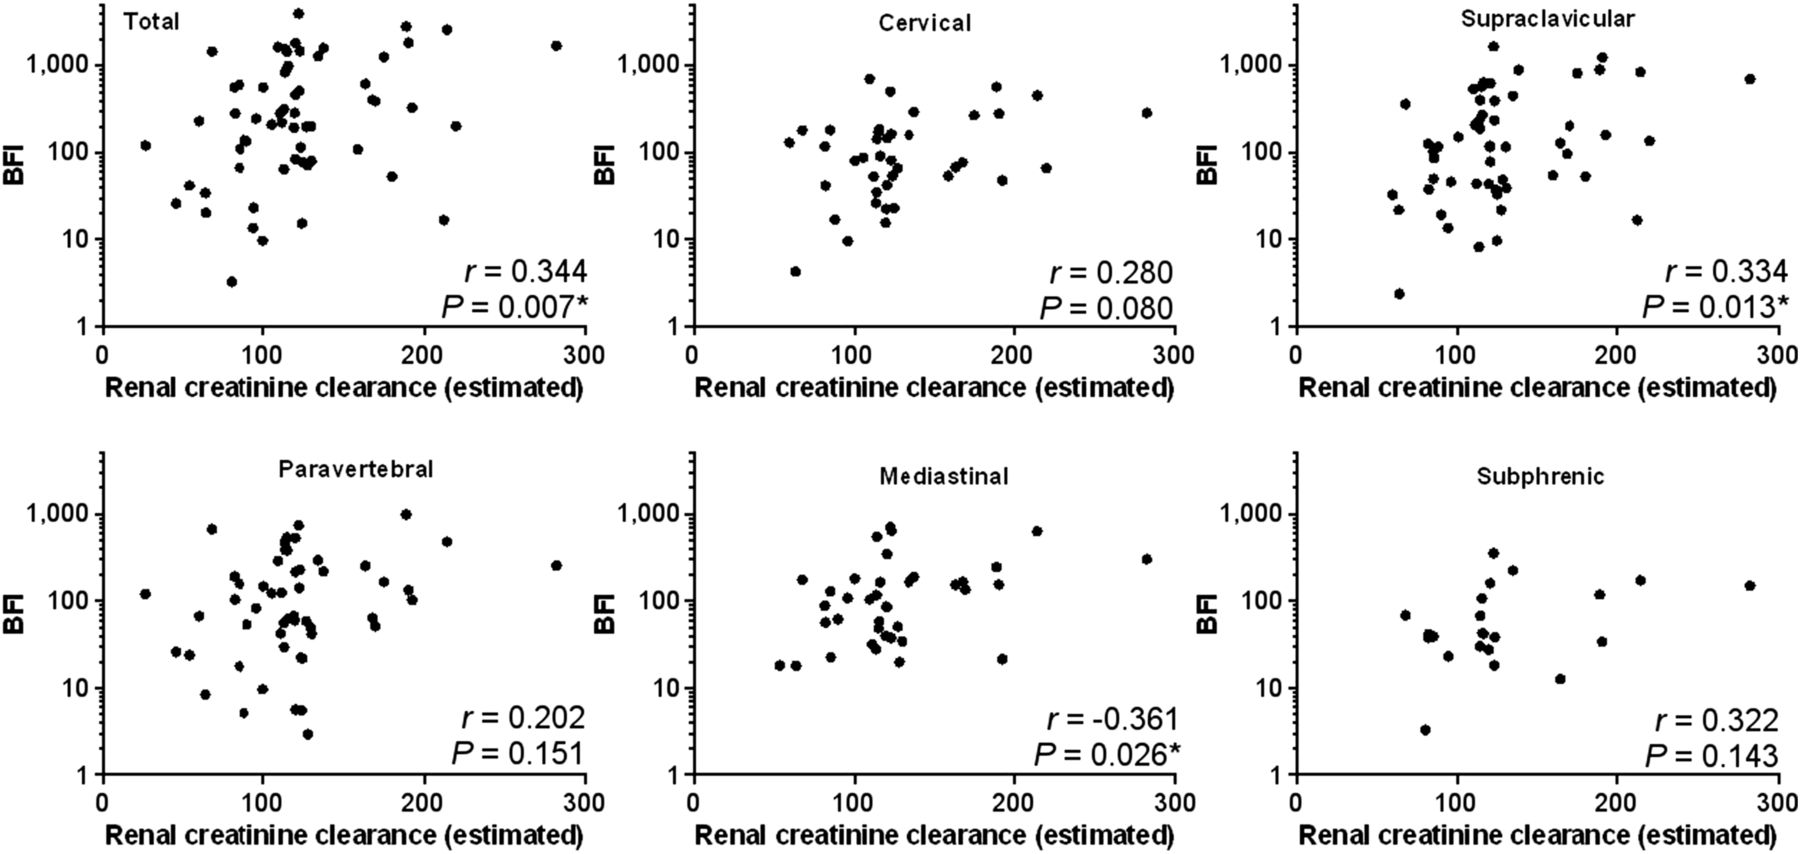
Correlation of estimated renal clearance with total BFI (n = 61) and BFI in cervical (n = 53), supraclavicular (n = 71), paravertebral (n = 69), mediastinal (n = 51), or subphrenic (n = 29) BAT depot. Every dot represents 1 18F-FDG PET/CT scan. y-axes are scaled logarithmically to accommodate BFI values varying across 3 orders of magnitude. Correlation coefficients r and significance P are results of nonparametric Spearman correlation analyses.
DISCUSSION
BAT is a mammalian organ providing a means of nonshivering thermogenesis to defend body temperature in a cold environment. A high glucose uptake of active BAT allows its detection in human patients undergoing 18F-FDG PET/CT imaging and may at the same time interfere with diagnostic tumor detection (6,9,10,12).
In this study, we retrospectively analyzed 2,854 archived 18F-FDG PET/CT scans and identified 98 BAT-positive scans. We proposed a visual score system to rapidly classify the extent of active BAT detected in a given scan by comparison with other tissues, that is, the liver and brain. The 4 categories provide a fast and easy classification for the description of BAT in 18F-FDG PET/CT imaging, thus enabling a homogeneous description of BAT in clinical situations. Visual scoring is a quick, quantitative measure of BAT activity that can be assessed with minimal training and technologic investment.
In scans of visual score 4, we observed a distinctly higher BAT mass than the approximately 0.1% of body mass previously described (mean volume, 308.1 mL) (3). Even if we mimicked the procedure of earlier examinations and calculated the mean of all positive patients (thereby including most scans containing invisible, inactive BAT), we still obtained a higher volume of BAT than reported previously (3,4,22). Our data thus imply a higher mean BAT mass in humans than previously described, with considerable consequences on the possibility to target human BAT in patients with metabolic disease as proposed previously.
Earlier estimates calculated a body mass loss by fully activating 70 g of human BAT to be in the range of 4 kg fat per year (3). On the basis of the more than 4-fold-higher BAT mass detected in this study, this estimate may rather be a striking 18 kg. Approved obesity medication typically leads to an additional weight loss of 2.9 to maximally 8.6 kg per year (34). Thus, a body mass loss provoked by continuous BAT activation would exceed this effect size severalfold.
Similarly, 70 g of active BAT are expected to remove about 2 g of glucose per day from the bloodstream (assumptions, 50 mg of BAT and 10% glucose utilization). This may be compared with other new pharmacologic interventions to reduce hyperglycemia such as SGLT2 inhibitors that typically achieve 50–80 g of glucose clearance per day (35). A BAT volume of 308 mL as measured in this study already disposes of 9 g of glucose per day, and the assumed power of 50 mW/g BAT may still prove a too conservative estimate. In summary, the larger than expected amount of detected BAT highlights the role of this thermogenic tissue as a plausible target structure to treat metabolic disease.
Only active BAT can be visualized by its glucose uptake. When this phenomenon was corrected for based on the probability to detect active BAT in repeated scans, the actual prevalence of BAT was estimated to be much higher (64%) (14). Challenged by cold exposure, nearly all young subjects display active BAT (5,29). In our study, subjects with detectable BAT thus represent a subgroup of patients with a higher than usual probability to activate BAT during a clinical 18F-FDG PET/CT scan. Indeed, we quantified this increased probability to be 10 times higher than in the overall patient cohort (5% vs. 52%). We can only speculate on the nature of the underlying, causative mechanism. An obvious candidate seems to be an increased sympathetic tone or at least a tendency to increase sympathetic tone to a greater extent than usual in response to a stress situation.
We introduced a case-control design to remove the differences of age and sex between BAT-positive and -negative patients. Surprisingly, we did not observe any effects of BMI on the stratified data, although BMI has repeatedly been described to be negatively associated with BAT detection both in retrospective and in prospective studies (4,5,14,23,29,31,32). Our finding suggests the effect of BMI on BAT incidence to be secondary to age and sex, at least in our dataset. The same seems to be true for most of the other parameters we studied, including several that have been reported to be associated with BAT activity previously, for example, thyroid-stimulating hormone (36–39) and glucose (40,41). We also did not detect an obvious effect of disease. Conversely, we corroborated earlier observations of seasonal variations in BAT detection in 18F-FDG PET/CT scans (22,30). This pattern has been suggested to be connected rather to annual changes in day length and therefore daylight exposure than to temperature (30). In our data, a clear effect of daily minimum temperature persists even at comparable day length during the summer season, suggesting a direct, thermogenic response.
Beyond the probability to activate BAT, we studied factors that influence the amount of BAT activated in positive scans. We assessed overall BAT metabolic activity by calculation of a brown fat activity index from the SUVmean of all detected BAT multiplied by its volume. Surprisingly, this quantitative BFI did not correlate with established predictors of BAT detection and activity, that is, BMI and sex (4,5,23,31,32). In none of the studied 5 depots nor on the total organismic level did these parameters influence BFI. In contrast, BAT activity was inversely correlated with patient age, similar to previous reports (14,23).
The strongest correlation with BFI displayed renal creatinine clearance derived from plasma creatinine, body mass, and age of the patients by means of an estimation formula (33). The complete lack of correlation between BFI and body mass or creatinine alone argues against a mathematic artifact. Creatinine is a breakdown product of creatine phosphate, a short-term energy buffer usually associated with muscle adenosine triphosphate regeneration. Interestingly, a creatine-driven substrate cycle has been reported to enhance energy expenditure in rodent beige/brite adipocytes (42). Human brown adipocytes are more similar to these brownlike adipocytes found in white fat than to classic rodent brown fat (43). Indeed, the existence of a creatine-driven substrate cycle in human BAT is corroborated by a proteomic analysis demonstrating exclusive expression of mitochondrial creatine kinases in BAT as compared with white fat (44). Conceivably, an increased creatine phosphate turnover in active BAT can be detected in the form of increased renal creatinine clearance, a phenomenon also reported to follow muscular exercise (45–47). If verified, this finding may provide a novel, noninvasive means to monitor human brown fat thermogenic activity.
Alternatively or additionally, a common cause may have increased activity of both organs, BAT and kidney. A high sympathetic tone, however, rather lowers glomerular filtration rate and renal blood flow and is thus not a plausible, connecting mechanism (48). Endocrine agents that influence both BAT and kidney activity are therefore more fitting candidates. This condition applies to atrial natriuretic peptide as well as glucocorticoids that induce the activity of human brown adipocytes (49,50). Future studies will have to clarify whether plasma atrial natriuretic peptide or glucocorticoids constitute robust, causative predictors of human BAT activity.
We hypothesized both major parameters studied here—probability to activate brown fat during a clinical 18F-FDG PET/CT scan and brown fat activity as measured by depot-resolved BFI—to be subject to the same causative, physiologic mechanism, for example, sympathetic tone atrial natriuretic peptide or glucocorticoid levels. In that case, the probability of BAT redetection in a patient would be governed by the same underlying cause as the amount of BAT activated and renal creatinine clearance, as outlined above. We identified 19 patients with an overlap in all 3 relevant datasets (i.e., redetection probability from 3 or more repeated scans, total BFI, renal creatinine clearance). Strikingly, redetection probability highly correlated with both total BFI (r = 0.48, P = 0.038, Spearman correlation) and renal creatinine clearance (r = 0.51, P = 0.026), clearly supporting a common cause (not shown).
CONCLUSION
Taken together, we determined measures of BAT activity in archived 18F-FDG PET/CT scans. For clinical application, we recommend a categoric visual score 1–4 while a precise quantitative assessment is possible by the proposed BFI method. Scans with score 4 displayed activity in all 5 BAT depots that together form a mean volume of more than 300 mL and thus exceeded the amount reported in earlier studies, with significant consequences on the feasibility to target BAT activity for the treatment of metabolic diseases. We corroborated earlier findings of a high association of age, sex, and season/temperature on the probability to detect active BAT. Subjects with active BAT form a subgroup of patients with an increased probability of BAT redetection during clinical 18F-FDG PET/CT scans. The amount of active BAT measured as depot-resolved BFI was influenced by age (dominated by supraclavicular BAT) and correlated with renal creatinine clearance. We hypothesized the latter to be a consequence of a creatine-driven substrate cycle in active human BAT or subject to regulation by atrial natriuretic peptide, a possible common cause of both detection probability and BAT activity. Importantly, this concept implies that a definable subgroup of the general population will benefit from drug treatment targeting BAT to a much greater extent than the average. This may represent both a complication for future clinical trials of said drugs and at the same time a great chance for a personalized medicine approach in the treatment of metabolic disease.
DISCLOSURE
No potential conflict of interest relevant to this article was reported.
Footnotes
Published online Jan. 19, 2017.
- © 2017 by the Society of Nuclear Medicine and Molecular Imaging.
REFERENCES
- Received for publication September 12, 2016.
- Accepted for publication December 7, 2016.


