


Abstract
Optoacoustic tomography (OT) is now widely used in preclinical imaging; however, the precision (repeatability and reproducibility) of OT has yet to be determined. Methods: We used a commercial small-animal OT system. Measurements in stable phantoms were used to independently assess the impact of system variables on precision (using coefficient of variation, COV), including acquisition wavelength, rotational position, and frame averaging. Variables due to animal handling and physiology, such as anatomic placement and anesthesia conditions, were then assessed in healthy nude mice using the left kidney and spleen as reference organs. Temporal variation was assessed by repeated measurements over hours and days both in phantoms and in vivo. Sensitivity to small-molecule dyes was determined in phantoms and in vivo; precision was assessed in vivo using IRDye800CW. Results: OT COV in a stable phantom was less than 2.8% across all wavelengths over 30 d. The factors with the greatest impact on signal repeatability in phantoms were rotational position and user experience, both of which still resulted in a COV of less than 4% at 700 nm. Anatomic region-of-interest size showed the highest variation, at 12% and 18% COV in the kidney and spleen, respectively; however, functional SO2 measurements based on a standard operating procedure showed an exceptional reproducibility of less than 4% COV. COV for repeated injections of IRDye800CW was 6.6%. Sources of variability for in vivo data included respiration rate, degree of user experience, and animal placement. Conclusion: Data acquired with our small-animal OT system were highly repeatable and reproducible across subjects and over time. Therefore, longitudinal OT studies may be performed with high confidence when our standard operating procedure is followed.
Optoacoustic tomography (OT) is a quickly developing imaging modality combining the high resolution and penetration depth of ultrasound detection with the high contrast available from optical absorption in tissue (1). Endogenous optical absorption provides structural and functional imaging information (2,3), whereas the introduction of exogenous contrast agents in vivo enables molecular imaging (4,5), by targeting specific cell receptors (6) or enzymatic processes (7). Given that OT is finding widespread application in preclinical imaging (8) and has potential for rapid clinical translation (1), technical validation assessing both accuracy and precision (9,10) is now vital.
To date, technical validation of OT has focused on accuracy, using light fluence models to enable quantitative determination of absorption coefficients (11). There is a paucity of data on precision, which can be considered as measurement repeatability with the same subject or user and reproducibility with independent subjects or users. Precision is often characterized by the coefficient of variation (COV), which has been assessed to a limited extent for OT in phantoms (12) but not in vivo, for which animal handling and physiology significantly affect results (8). High intrasubject COV limits the applicability of a modality for longitudinal imaging studies, whereas high intersubject COV would modify study design (e.g., requiring that each animal serve as its own control). Here, we developed and applied a framework for evaluating the precision of OT systems in phantoms and living subjects. Our results showed that precision of the tested OT system compared favorably with existing preclinical imaging modalities and hence could be reliably applied in biomedical research.
MATERIALS AND METHODS
OT System
Several commercial small-animal optoacoustic systems are now available (13). In this study, we used a multispectral OT (MSOT) system (inVision256-TF; iThera Medical) described in detail elsewhere (14,15). Briefly, a tunable (660–1,300 nm) optical parametric oscillator pumped by a neodymium-doped yttrium aluminium garnet laser provides 9-ns excitation pulses at a 10-Hz repetition rate. Ten arms of a fiber bundle illuminate a ring approximately 8 mm in width at the sample, with fluence below the maximum permissible exposure according to the safety guidelines of the Laser Institute of America (ANSI Z136.1) over the wavelength range investigated (Supplemental Fig. 1; supplemental materials are available at http://jnm.snmjournals.org). Laser energy is recorded for each pulse, and the acoustic signal is divided by this value before saving. The sample is mounted in a motorized holder for linear translation in the z-direction over a range of up to 150 mm (Fig. 1A). The sample is coupled to the transducers using a bath of degassed, deionized water. For ultrasound detection, 256 toroidally focused ultrasound transducers at a 5-MHz center frequency and 60% bandwidth are organized in a concave array with 270° angular coverage and a 4-cm radius of curvature.
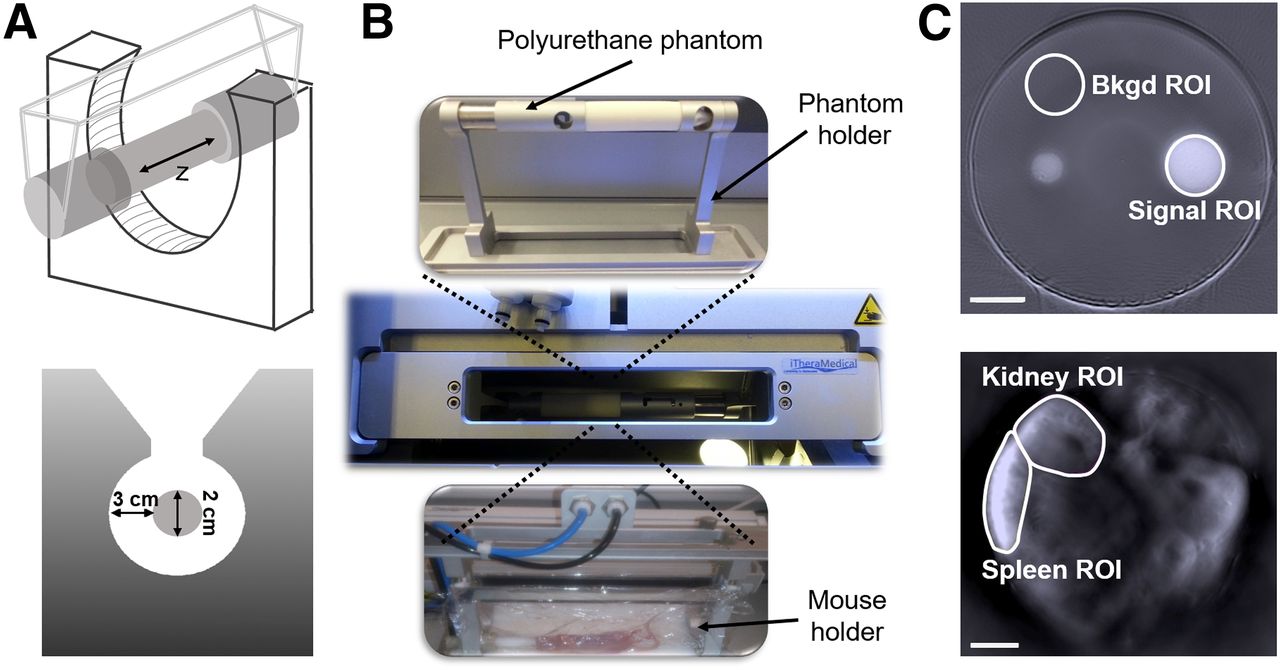
System geometry and sample preparation. Sample is placed within imaging chamber using specialized phantom or mouse holders. (A) Schematic of sample holder geometry within ultrasound transducer ring. (B) Photographs of 2 holders and their placement in system. (C) The resulting images of stable polyurethane phantom (top) and mouse cross section (bottom) are illustrated with ROIs used for signal (including kidney and spleen in vivo) and background (bkgd) in analysis outlined. Scale bar = 4 mm.
Framework for Evaluating Precision of Preclinical OT
For preclinical imaging in small animals, precision should be evaluated separately across anatomic (e.g., tumor volume), functional (e.g., oxygenation), and molecular (e.g., tracer uptake) parameters. First, to account for system variation, the precision of the imaging data in phantoms should be assessed across all acquisition variables (e.g., wavelengths, rotational positions, averaging, and time). Second, the precision across living subjects should be assessed using a standard operating procedure. Measurements should be taken by different users to evaluate the impact of user experience and animal handling. Finally, for contrast agent studies, sensitivity to the contrast agent of interest should be determined in addition to precision, to ensure accurate decisions on the dose of agent to be used in vivo. Details of the standard operating procedures for all experiments presented are given in the supplemental materials.
Precision Evaluation in Phantoms and In Vivo
A commercial stable polyurethane phantom (fabricated by Computerized Imaging Reference Systems Inc. and supplied by iThera Medical) with a diameter of 2 cm and a sound speed of 1,430 ms−1 was used for phantom studies of repeatability. The acoustic attenuation of the phantom is given as 0.5 dB/cm/MHz. Use of a commercial stable phantom avoids drift in measurements due to matrix degradation and enables users of other systems to replicate our study. The phantom bulk is composed of a purely scattering matrix, within which are contained absorbing calibration targets. The phantom was clamped into the supplied rigid phantom holder, which ensures repeatable positioning, and placed into the imaging chamber of the MSOT system (Fig. 1B). After equilibration of phantom temperature with the 36°C water bath for 10 min, imaging was performed over 5 scanning positions covering the calibration targets in 1-mm steps. Images were acquired at 660 nm and from 700 to 1,100 nm in 50-nm steps. The repeatability in longitudinal studies was measured over the course of 6 h, 1 d, and 1 mo. Data are shown at 700 nm in all cases, with other wavelengths detailed in Supplemental Table 1.
We used the same phantom to investigate the effects of sample rotation and frame averaging. Sample rotation was assessed because of the incomplete acoustic sampling of the system geometry. We acquired data as above with the phantom rotated by 0°, 90°, 180°, and 270° with respect to its long axis between measurements. To test the impact of frame averaging, we recorded up to 100 frames and averaged either the reconstructed image frames (sequential) or the raw acoustic signals (continuous), available as options within the acquisition software. Given the use of a rigid holder for phantom imaging, the effect of different operators on phantom data acquisition was not explored.
Procedures on small animals were performed under the authority of project and personal licenses issued by the Home Office, U.K., and were approved by local animal welfare and ethical review bodies. Healthy BALB/c nude mice (Charles River) aged between 8 and 12 wk were housed in Tecniplast Green Line individually ventilated cages with APB6 bedding on a 12-h on/off light/dark cycle (7 am to 7 pm) with 5R58 diet (PicoLab).
The mice were anesthetized using inhaled isoflurane mixed with 100% oxygen and placed supine into the animal holder (Fig. 1B). A flexible polyethylene membrane surrounded the mouse, forming a watertight seal, with anesthesia supplied via a gas inlet. A thin layer of clear ultrasound gel (Aquasonics; Parker) applied with a spatula was used to couple the skin of the mouse to the membrane. Mouse preparation took about 15 min. The ultrasound gel was centrifuged to remove air bubbles and warmed before application. After equilibration of mouse temperature with the 36°C water bath for 12 min (previously determined by rectal probe), imaging was performed in a single slice centered on the kidneys and spleen. Images were acquired between 690 nm and 880 nm in 10-nm steps, with 10 averages (continuous averaging).
The influence of inhaled isoflurane concentration (1.2%–3%) on respiration rate (40–140 breaths per minute) and the resulting SO2MSOT measurements was first determined in a subset of 3 animals, after which respiration was maintained at 60–70 breaths per minute with 1.75% ± 0.25% isoflurane for the remainder of the studies. For full COV calculations, we then examined 4 variables: performing continuous imaging over 90 min; leaving the mouse in place while acquiring 6 image frames (7 mice); removing and immediately replacing the mouse before each acquisition (4 mice); and repeating the imaging over 3 d (with the mouse removed and replaced). Given that variability is expected in the handling and placement of the mice, data acquired by 2 independent users were also analyzed.
Sensitivity and Precision for Detecting Small-Molecule Dyes in Phantoms and In Vivo
To assess the detection sensitivity for small-molecule dyes, phantoms with defined optical properties that closely mimic biologic tissue were fabricated. Phantom absorption and reduced scattering coefficients followed the generic tissue definition given by Jacques (16) and are shown in Supplemental Figure 2. All chemicals were purchased from Sigma-Aldrich unless otherwise stated. Prewarmed intralipid was added to liquid agar to provide scattering, and nigrosin dye was added to provide absorption. The solution was poured into a 20-mL syringe (2-cm diameter) containing a 3-dimensional printed plastic mold to create a cylindric hole of 3-mm diameter at the phantom center, into which a sealed thin-walled plastic straw containing a solution of dye was inserted. Commercially available small-molecule dyes (relevant to clinical use) were used: IRDye 800CW (IR800; LI-COR), indocyanine green (ICG), and methylene blue (MB). IR800 and MB were dissolved in phosphate-buffered saline, whereas ICG was dissolved in water because of the poor solubility in phosphate-buffered saline. The tissue-mimicking phantom was placed into the MSOT system using the procedure described for small-animal imaging. The water bath temperature was set to 34°C to prevent loss of structural integrity of the agar. Images were acquired at multiple wavelengths at 5 scan positions with a 1-mm step size.
To assess in vivo detection sensitivity and precision, we prepared 3 mice for imaging as above but also inserted a tail vein catheter with a dead volume of 35 μL. Under terminal anesthesia (2 mice), we performed a dose escalation study, injecting 135 μL of 2, 4, 8, 20, and 50 μM IR800 dissolved in phosphate-buffered saline at 11-min intervals. Using a separate animal, we then repeatedly injected 135 μL of 8 μM IR800 at 16-min intervals. The narrow time intervals between injections mean that the dye will not have fully cleared from the bloodstream; we therefore calculated the intensity difference before and after injection rather than comparing absolute intensities. Images were acquired continuously (at the dye-specific excitation wavelengths) to observe dynamics in vivo.
Image and Statistical Analysis
Images were reconstructed offline and analyzed using the ViewMSOT software package (version 3.6; iThera Medical). We used the linear reconstruction and linear regression multispectral processing tools available within ViewMSOT (17,18). The reconstruction algorithm includes by default an electrical impulse response correction, which accounts for the gaussian response of the ultrasound transducers by deconvolving a reference impulse response from the measured acoustic signals. The reference impulse response is based on the vendor specifications for transducer performance, the key parameters of which (5-MHz center frequency, 60% bandwidth) were verified by the manufacturer of the supplied transducer array using pulse-echo ultrasound. For the phantom rotation studies, images were reconstructed with and without the impulse response. The same speed of sound (adjusted manually) was used for all image reconstructions within a given dataset.
Mean pixel intensity and SD were extracted from regions of interest (ROIs). For stable phantom studies, the ROI size (12.3 mm2) and position were identical across all datasets (Fig. 1C), and single wavelength images were used for analysis. For tissue-mimicking phantoms, the ROI size (6.15 mm2) was identical across all datasets but the position was optimized between images; both single-wavelength and multispectral images were used. For small-animal studies, ROIs were drawn around the left kidney and the spleen (Fig. 1C) of each mouse. When IR800 was injected, ROIs were drawn around the right kidney to avoid any confounding influence of light attenuation by the spleen.
Linear regression with published spectra for oxyhemoglobin (HbO2) and deoxyhemoglobin (Hb), as well as IR800 (19,20), was used to produce images in arbitrary units that indicate the relative weight that each spectrum contributes to a given image pixel. Oxygen saturation was extracted as the ratio of ROI data from the HbO2- and Hb-weighted images and calculated as HbO2/(Hb + HbO2). OT is able to accurately resolve absolute SO2 only if the recorded signal can be related to the absorbed optical energy distribution, which requires knowledge of the light fluence distribution, system response, and Grueneisen parameter (11); as we do not have this information, our image intensities are given in arbitrary units and we denote the oxygenation metric derived in this study as SO2MSOT. Total hemoglobin (THb) was extracted as (Hb + HbO2) and hence is given in arbitrary units.
COVs were calculated from raw data extracted from ROIs as the ratio of the SD to the mean, expressed as a percentage. Signal-to-noise ratio (SNR) was calculated as the ratio of the signal ROI mean to the background ROI SD. Signal-to-background ratio was calculated as the ratio of the signal ROI mean to the background ROI mean. Uncertainty on mean values is represented by the SE unless otherwise stated. Statistical analysis was performed in Origin (OriginLab Corp.).
RESULTS
Precision Evaluation in Phantoms
The temporal repeatability of the OT system across all wavelengths assessed with a commercial stable polyurethane phantom was excellent (Supplemental Table 1). No significant drift was seen in the mean pixel intensity during continued acquisition over 160 min (Fig. 2A) or over the course of 6 h (Fig. 2B). The COV at 700 nm over 6 h was 0.5% without removal of the phantom (phantom remaining in the system for the full 6 h), rising to 1.2% with removal (phantom removed between data acquisitions). Over 30 d (with removal, Fig. 2C) we found a COV of just 1.9%, with a minor system drift of less than 0.2%. The laser energy for all short-term repeatability studies was stable (Supplemental Figs. 3A–3C). A decrease in energy was observed over 30 d (Supplemental Fig. 3D), as would be expected from gradual contamination of the optics—in particular, the optical parametric oscillator. When a user with no ROI drawing experience was asked to conduct the task (compared with 2 y of experience for the main user), the COV for 6 h rose to 1.3% and 3.8% without and with removal, respectively, and the COV over 30 d rose to 3.1%.
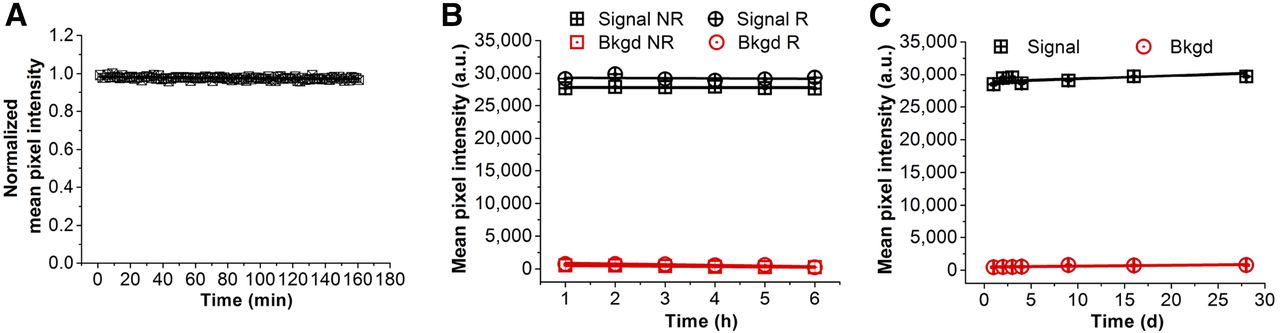
Optoacoustic precision as function of time in stable polyurethane phantom at 700 nm. (A) Normalized mean pixel intensity over 160 min (NR) with slope of (−6.34 ± 1.62) × 10−5 a.u. (B) Mean pixel intensity (arbitrary units, a.u.) over 6 h in single day with removal (R) and without removal (NR) of phantom between data acquisitions; slopes are −30.7 ± 28.2 a.u. and −4.9 ± 29.2 a.u., respectively. (C) Mean pixel intensity over 30 d (R) with slope of 50.4 ± 4.0 a.u., equating to 0.17% drift. Data were extracted from signal ROI and represent average of 5 scan positions per time point. Average SNR for removal data was 239 ± 24 and 234 ± 12 for 6 h and 30 d, respectively. Error bars are within symbols. a.u. = arbitrary units; Bkgd = background.
We also established the influence of sample rotational position and image averaging. The 0° and 180° rotations are within similar view fields of the transducer array, whereas the 90° rotation is likely to be less well captured than the 270° rotation because of the limited bandwidth and field of view of the ultrasound transducers, as confirmed by images reconstructed without the correction (Fig. 3A). The electrical impulse response correction of the raw data reduced the COV due to rotation from 13.4% (Fig. 3B) to 3.6% (Fig. 3C) and almost doubled the image SNR (from 46.1 to 91.5). Although our transducer array is within the tolerance of the design specifications, the transducers that capture the left-hand side of the image have a tendency toward a higher center frequency and bandwidth (manufacturer certificate of conformance). This results in an overamplification of the 0° rotation compared with 180° after correction (Fig. 3C). The improved representation of low frequencies after correction (for which the field of view of the individual transducers is much wider) results in an overall increase in the mean pixel intensity and more comparable data at the 90° and 270° rotations.
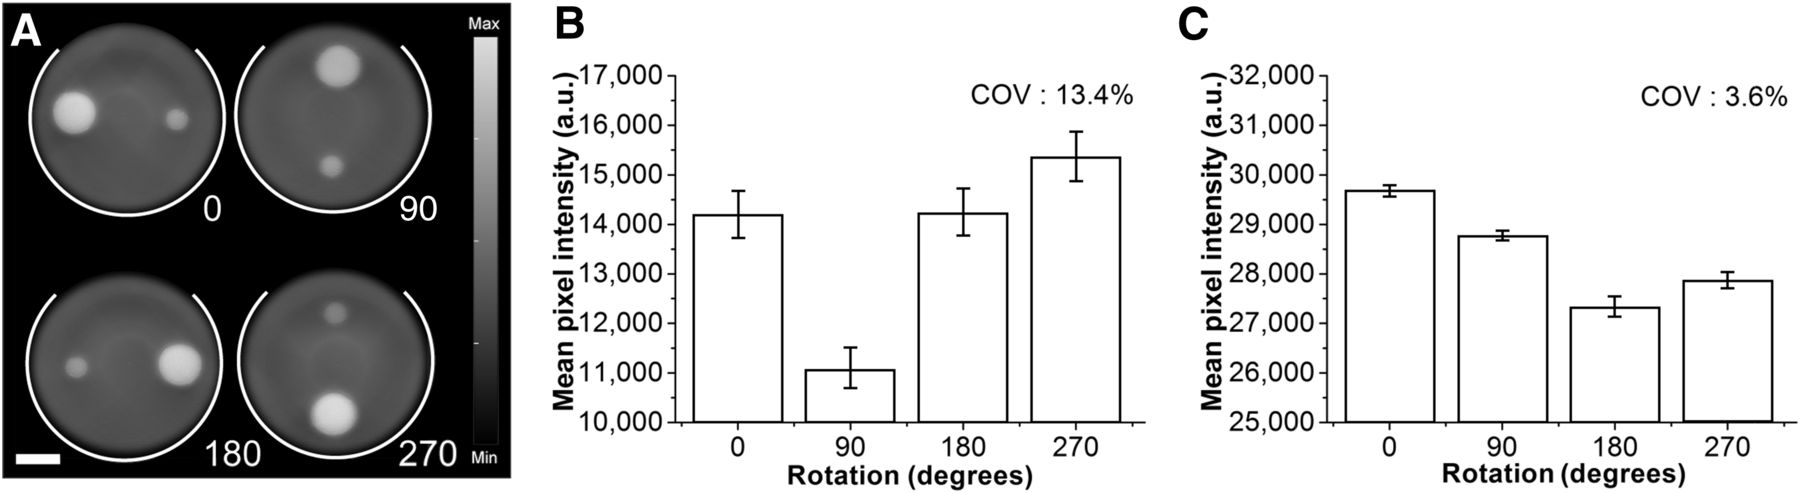
Impact of sample orientation within imaging chamber. (A) Reconstructed images of stable polyurethane phantom in 4 different rotations (0°, 90°, 180°, 270°) reconstructed without impulse response correction. White lines indicate location of ultrasound transducer array. (B and C) Mean pixel intensities from ROI placed over larger calibration target (signal ROI in Fig. 1C) were extracted without (B) and with (C) impulse response correction; data represent average of 5 scan positions, with error bars showing SE on mean. SNR (measured across all positions with background ROI placed at phantom center) increased after impulse response correction, rising from 46.1 to 91.5. Scale bar = 4 mm. a.u. = arbitrary units.
For image averaging, the sequential method (averaging of multiple reconstructed image frames; Supplemental Fig. 4A) increased the SNR, but the continuous method (direct averaging of the acoustic signals; Supplemental Fig. 4B) did not. This is likely due to the fact that the acoustic signal averaging smooths the raw pressure signals and so does not account for all factors that influence noise in the final reconstructed image. These data illustrate the trade-off between SNR, which was optimal with more than 25 averages (Supplemental Fig. 4A), and acquisition time, which was more than 25 s per dataset with this number of averages.
As a preliminary assessment of the generalizability of these precision measurements, we also acquired images of the commercial phantom using a nontomographic optoacoustic system, which uses a light-emitting diode array for signal excitation and a linear ultrasound transducer array for detection (Supplemental Fig. 5A). The acquired data indicated that the same commercial phantom could be successfully used in a different geometry. Measured COVs were 13.9% and 6.1% over 160 min and 6 h, respectively (Supplemental Figs. 5B and 5C); these higher values relative to the OT system could be due to heating of the excitation light source and water-coupling medium over time.
Precision Evaluation In Vivo
Given the impact of animal handling and physiology on in vivo imaging data, we established the precision of our OT system in living subjects using the left kidney and spleen as reference organs. All ROIs were drawn by an experienced (>1 y) user unless otherwise stated. Considering anatomic size data first, the left kidney and spleen had average ROI areas of 21.0 ± 0.7 mm2 (COV, 12%) and 19.2 ± 1.0 mm2 (COV, 18%), respectively, over all mice (n = 13). When ROIs were independently drawn on repeated frames of individual mice, the average COVs were (4.4 ± 1.2)% and (7.3 ± 0.7)% for the kidney and spleen (n = 8), increasing to (6.1 ± 1.1)% and (10.4 ± 1.5)%, respectively, with removal between acquisitions (n = 7). For the following studies, we used a fixed ROI size and shape for each mouse, copying onto repeated image frames and allowing adjustments in orientation in order to position the ROI on the organ.
Having established the precision of anatomic size data, we then moved on to functional data. Example images of Hb and HbO2 are shown in Supplemental Figure 6. We noted that ROI data extracted from the Hb and HbO2 images directly, as well as their sum (THb), showed a high COV (<18.5%) between mice (reproducibility); the ratiometric readout SO2MSOT showed a much lower COV (<4% variation) (Table 1). We attributed the high variation in Hb, HbO2, and THb metrics to inherent biologic variation between mice, which appears to be minimized by taking the ratio. Hence, we used SO2MSOT as our OT biomarker for temporal COV calculations. We also noted that changing the isoflurane anesthetic concentration in the range 1.2%–3% over 10 min (associated respiration rate range, 40–140 breaths per minute) resulted in more than a 30% decrease in spleen SO2MSOT and more than a 9% decrease in the kidney (P = 0.047 and 0.043, respectively, by paired 2-tailed t test; n = 3). For the temporal studies, we therefore maintained all mice using an isoflurane anesthetic concentration of 1.75% ± 0.25% (respiration rate range, 60–70 breaths per minute) during imaging to minimize variation.
Assessing Reproducibility Between Mice: HbO2 and Hb COV Compared with THb and SO2MSOT COV
Temporal repeatability in vivo was assessed over 90 min (1 continuous acquisition) and then during 6 consecutive acquisitions in 1 d (with and without removal) and over 3 d. COVs are calculated for the ratiometric SO2MSOT measurement; THb is shown for comparison. We observed a drift in SO2MSOT and THb over 90 min (Fig. 4A), but for repeated measurements, we found excellent longitudinal repeatability over 6 acquisitions within the same day (Fig. 4B). Although this remained true for SO2MSOT over 3 d, it was not the case for THb (Fig. 4C). Since the animal holder is not rigid, we examined the impact of mouse removal and also of different users. Removal of the mouse between sequential acquisitions led to a COV of less than 1.4%, compared with less than 0.6% without removal (Table 2). A less experienced user (acquisition and ROI drawing performed on fewer than 10 mice) resulted in only a marginally higher COV (<0.8%). One-way repeated measures ANOVA indicated that removal had no significant influence on the variation for the left kidney and spleen (SO2MSOT and THb, P > 0.27) but users were significantly different (P < 0.0001). Over 3 d, neither removals (P > 0.09) nor users (P > 0.47) were significant. Overall COV in SO2MSOT was less than 1% for repeatability and less than 4% for reproducibility.
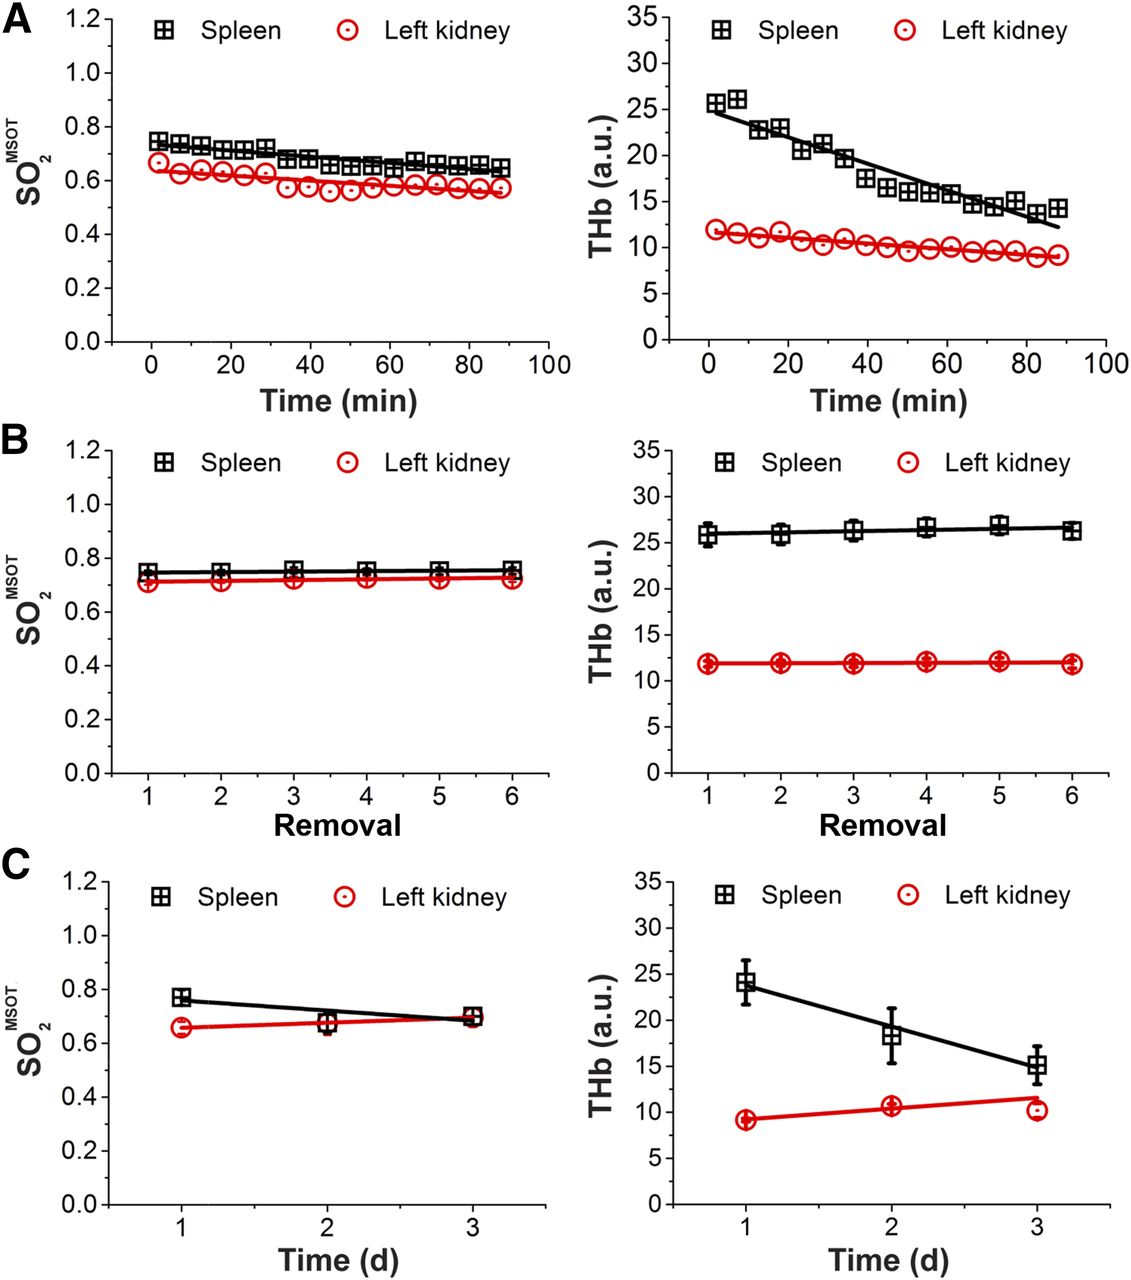
Optoacoustic precision as function of time in vivo. Repeatability for in vivo studies was assessed over 90 min (as representative single scan time), over 6 consecutive removals (to assess influence of positioning), and over 3 d (mimicking longitudinal study). (A) SO2MSOT and THb measured over 90 min [3 mice; SO2MSOT slope = −(9.5 ± 1.9) × 10−4% min−1 for left kidney and −(12 ± 1) × 10−4% min−1 for spleen; THb slope = −(30.8 ± 3.1) × 10−4 a.u. min−1 for left kidney and −(143.8 ± 11.8) × 10−3 a.u. min−1 for spleen]. (B) Over 6 removals, little variation was seen [7 mice; SO2MSOT slope = (30.4 ± 10.0) × 10−4% for left kidney and (17.3 ± 6.1) × 10−4% for spleen; THb slope = (0.02 ± 0.03) a.u. for left kidney and (0.13 ± 0.08) a.u. for spleen]. (C) SO2MSOT was also relatively stable over 3 d, but greater variation was seen in THb [3 mice; SO2MSOT slope = (18.9 ± 1.2) × 10−3% day−1 for left kidney and (37.6 ± 27.5) × 10−3% day−1 for spleen; THb slope = (1.2 ± 0.5) a.u. day−1 for left kidney and (−4.5 ± 0.6) a.u. day−1 for spleen]. According to regression analysis, linear fits in B (SO2MSOT and THb) and C (SO2MSOT only) are not significantly nonzero, indicating that no systematic variation can be observed in these data. Error bars are within symbols unless visible within graph. a.u. = arbitrary units.
Assessing Influence of Animal Preparation and Stability in Chamber on SO2MSOT COV
Sensitivity for Small-Molecule Dyes in Phantoms and In Vivo
Detection limits were determined to be 100 nM for IR800 (Supplemental Fig. 7A) and ICG (Supplemental Fig. 7B) and 5 μM for MB (Supplemental Fig. 7C); equivalent optical densities were 0.10 (IR800, 777 nm), 0.084 (ICG, 778 nm), and 0.17 (MB, 664 nm), respectively. Considering the volume of dye present within an image slice (determined by the transducer focus as approximately 6.16 μL), this is equivalent to about 0.62 pmol for IR800 and ICG and about 30.8 pmol for MB. The higher threshold for MB may be explained by the smaller extinction coefficient and higher background absorption at its peak wavelength. The absorption spectra (Supplemental Fig. 7) recovered from the multiwavelength optoacoustic data generally follow those acquired independently on an ultraviolet–visual plate reader, although some discrepancies are observed for IR800 and ICG at shorter wavelengths.
We tested in vivo sensitivity and precision for IR800 (Fig. 5). We first performed 2 dose escalation studies. We started injections from 2 μM based on the detection limits derived above and assuming an approximately 1:25 dilution of the injected contrast agent in the bloodstream of the mouse (∼100-μL injection in ∼2.5-mL blood pool). As expected, there was no enhancement at 2 μM, only at 4 μM. A clear kinetic curve was apparent for 8 μM (Fig. 5A), which also gave the best reproducibility in this limited study (Fig. 5B). For repeated 8 μM injections in 1 mouse, a COV of 6.6% was derived for the rise above baseline after each injection.

Sensitivity and precision for in vivo imaging of IR800CW. Dose escalation study of injection of 100 μL of IR800 at concentrations of 4, 8, 20, and 50 μM using ROI drawn on right kidney of two separate mice (A). Injections were made sequentially at 11-min intervals, and data are time- and intensity-shifted to show point of injection at 0 min. Concentration of 8 μM was identified as ideal for in vivo visualization (B), as only small enhancement was seen at 4 μM. Images in B are before injection (left) and at 1 min after injection (right). Arrows indicate contrast agent inflow within kidneys; scale bar is 3 mm. Mean pixel intensity for 3 repeated injections at 16-min intervals of same concentration and volume are also shown. a.u. = arbitrary units.
DISCUSSION
Here, we developed and applied a framework that can be used for evaluating the precision of OT in phantoms and in vivo (21,22). Data acquired in a stable phantom showed exceptional repeatability for the OT system tested, with a COV of less than 2% across all wavelengths over 30 d. Across all parameters tested, the factors that made the greatest impact on signal repeatability were rotational position and ROI drawing by an inexperienced user, which nonetheless produced a COV of less than 4%.
We explored both repeatability (same subject) and reproducibility (between subjects) in vivo. For anatomic data, CT and MRI typically show less than a 5% COV for measurements of ROI size both within and between animals (23–25). We found relatively high COVs of 12% and 18% in the kidney and spleen ROI sizes, respectively, when compared across all subjects. However, when data were extracted from repeated ROI drawing within the same mouse (with removal), the values fell to 6% and 10%, respectively. Our findings indicate that the primary source of variation in size is anatomic positioning within the nonrigid animal holder. In addition, as contrast is defined by the concentration of blood vasculature rather than a clear organ boundary, ROI drawing for OT is likely to be more subjective than with a modality such as CT.
We observed a significant drift in the functional parameters SO2MSOT and THb over 90 min. It has been previously documented that anesthesia induces up to a 20% change in the mean hemoglobin concentration in the blood (26) and that isoflurane can also suppress the erythropoietin hypoxia response and cause vasodilation (27,28), which may in part account for the observed drift. The larger effect observed in the spleen may be due to the increased hemoglobin concentration of splenic blood, which would accentuate these effects (29). The use of water submersion for acoustic coupling may also influence our results, although to the best of our knowledge, the influence of external hydrodynamic pressure in mouse hemodynamics has not been quantified. These factors may also play in to the longer-term drift observed in THb over 3 d; further work is necessary to understand the source of this variation. Nonetheless, in our standard operating procedure we controlled as far as possible for short-term temporal drift by imaging at a fixed time point, and we controlled for the impact of isoflurane concentration (and associated respiration rate) by maintaining consistent values across imaging sessions. Using OT to derive SO2MSOT with our standard operating procedure, we found that the COV was always less than 4% between mice and less than 2% within the same mouse. For functional oxygenation data extracted from blood oxygen level–dependent MRI or arterial spin-labeling measurements, COVs in the range of 10%–15% are often reported (30,31). The relatively low COVs measured in our OT system indicate that it could be a competitive approach for preclinical functional imaging.
Finally, we examined dye sensitivity and precision in tissue-mimicking phantoms and in vivo. For IR800, the detection sensitivity limit in phantoms of 100 nM translated directly into limiting in vivo dose of 4 μM based on the expected dilution of the injected volume in the bloodstream. Performing dye-sensitivity studies in tissue-mimicking phantoms can therefore assist selection of an appropriate dose for in vivo studies for untargeted contrast agents. The COV of the signal rise within the kidney over repeated injections was 6.6%. For dynamic contrast-enhanced MRI, which uses injected gadolinium to assess perfusion and permeability, COV in the derived metric volume transfer constant, Ktrans, is typically greater than 10% (24,32). Again, our OT system therefore appears competitive for preclinical functional imaging.
There remain some limitations to this study, which was conducted in a single center using equipment from a single vendor. In future, multicenter studies across multiple vendors would be needed to assess the overall precision of OT. It would also be prudent to perform tests over a range of common mouse strains with independent physiologic measurement, since hemodynamics and skin pigmentation vary significantly between strains. For the dye studies, we used a limited number of mice and an untargeted contrast agent, which cannot provide insight into the dose required for molecular imaging studies, in which circulatory and cellular barriers must be overcome. Such studies should be expanded in future to test targeted contrast agents assessing molecular imaging precision compared with other modalities, such as PET (33) and hyperpolarized 13C MRI (34). Future comparison of anatomic, functional, and molecular imaging measurements made with OT to established preclinical imaging approaches will help to establish acceptable performance criteria for OT metrics.
Nevertheless, we are able to make several recommendations based on our findings for future studies in vivo using the OT system tested. First, the influence of anatomic variation, including biologic differences and physical (rotational/organ) position on functional metrics, should be minimized by extracting the ratiometric parameter SO2MSOT. Second, both data acquisition and ROI analysis for a single study should be performed by users with the same level of experience. Finally, a standard operating procedure with consistent animal handling and physiology, including a fixed duration and concentration range of anesthesia (resulting in a stable respiration rate), should be used to minimize variation between mice. If these recommendations are followed, the OT system tested provides a high-precision readout for preclinical imaging.
CONCLUSION
We investigated OT precision across key variables, including time and user experience, in phantoms and in vivo. We found that the tested OT system performed consistently with or better than other reported preclinical imaging modalities, highlighting the potential for the system to soon become a widely accepted routine tool in preclinical biomedical research.
DISCLOSURE
This work was funded by the EPSRC-CRUK Cancer Imaging Centre in Cambridge and Manchester (C197/A16465); CRUK (C14303/A17197, C47594/A16267); EU-FP7 agreement FP7-PEOPLE-2013-CIG-630729; and the University of Cambridge EPSRC Impact Acceleration Account. James Joseph and Michal R. Tomaszewski received conference travel funding from iThera Medical. No other potential conflict of interest relevant to this article was reported.
Acknowledgments
We thank all at iThera Medical (especially Stefan Morscher) for helpful discussions and provision of ultrasound transducer data sheets. We are especially grateful to Drs. Naoto Sato and Toshitaka Agano, along with all at PreXion, for the loan of their light-emitting diode–based optoacoustic imaging system. We also thank the CRUK CI BRU and Dr. James Mason of the MRC BSU for their technical assistance in the completion of this study.
Footnotes
Published online Jan. 26, 2017.
- © 2017 by the Society of Nuclear Medicine and Molecular Imaging.
REFERENCES
- Received for publication August 8, 2016.
- Accepted for publication December 15, 2016.


Jump to section
Related Articles
Cited By...
- Correlation of Preclinical In Vivo Imaging Modalities and Immunohistochemistry for Tumor Hypoxia and Vasculature
- Unsupervised segmentation of 3D microvascular photoacoustic images using deep generative learning
- Ultrasound-guided Photoacoustic image Annotation Toolkit in MATLAB (PHANTOM) for preclinical applications
- The effects of skin tone on photoacoustic imaging and oximetry
- Segmentation of 3D blood vessel networks using unsupervised deep learning
- Performance evaluation of mesoscopic photoacoustic imaging
- Quantification of vascular networks in photoacoustic mesoscopy
- Murine models of renal ischaemia reperfusion injury: An opportunity for refinement using non-invasive monitoring methods
- DNA-based nanocarriers to enhance the optoacoustic contrast of tumors in vivo
- Photoacoustic imaging resolves species-specific differences in haemoglobin concentration and oxygenation
- Photoacoustic imaging as a tool to probe the tumour microenvironment
- Co-Registration of Optoacoustic Tomography and Magnetic Resonance Imaging Data from Murine Tumour Models
- Quantitative photoacoustic imaging study of tumours in vivo: baseline variations in quantitative measurements
- Photoacoustic imaging for the prediction and assessment of response to radiotherapy in vivo
- Oxygen-Enhanced and Dynamic Contrast-Enhanced Optoacoustic Tomography Provide Surrogate Biomarkers of Tumor Vascular Function, Hypoxia, and Necrosis