


Abstract
Molecular imaging of cell death may provide a detailed readout of the cellular response to novel therapies and prognostic information on tumor treatment efficacy, assisting in the design of individualized therapy. We compared the predictive power of cell death imaging using 99mTc-duramycin with the current gold standard 18F-FDG for treatment response evaluation after targeted therapy. Methods: Early therapy response evaluation was assessed by 99mTc-duramycin SPECT and 18F-FDG PET imaging in treatment-sensitive COLO205 and treatment-resistant HT29 human colorectal cancer xenografts 24 h after a single dose of conatumumab or IgG1 control. The specificity of 99mTc-duramycin for apoptosis was assessed using 99mTc-linear duramycin control radiotracer. Radiotracer uptake was validated ex vivo by γ-counting and autoradiography and compared with cleaved caspase-3 (CC3) activation and DNA fragmentation (TdT-mediated dUTP nick-end labeling [TUNEL]). Data were analyzed with the Student t test and Pearson correlation. All statistical tests were 2-sided. Results: COLO205 tumor uptake of 99mTc-duramycin was increased 7-fold from baseline in conatumumab- versus IgG1-treated control mice (P < 0.001), in good correlation with histologic analysis of apoptosis (CC3, r = 0.842, and TUNEL, r = 0.894; P < 0.001). No response was detected in HT29 tumors. No change in 99mTc-linear duramycin uptake could be detected in COLO205 tumors after treatment, indicating specificity of the 99mTc-duramycin tumor signal. 18F-FDG uptake was not significantly increased from baseline in conatumumab- versus IgG1-treated COLO205 and HT29 tumor–bearing mice (P = 0.104 and 0.779, respectively) and did not correlate with immunohistochemical evidence of apoptosis. Conclusion: We have demonstrated that 99mTc-duramycin specifically accumulates in apoptotic tumors in which 18F-FDG was not able to differentiate responding from nonresponding tumors early after treatment. 99mTc-duramycin holds promise as a noninvasive imaging radiotracer for early treatment evaluation in the clinic.
The assessment of tumor response to anticancer therapy is important to distinguish early responders from patients resistant to the treatment plan, enabling the so-called tailor-made therapeutic intervention. An early evaluation of therapeutic success of a given anticancer therapy could be of key importance to identify therapeutic failure and might prevent needless exposure of patients to treatment-associated side effects. Conventional anatomic imaging techniques, such as CT and MRI, are insufficient to assess early treatment responses (1). Molecular imaging techniques, such as PET and SPECT, offer a much more sensitive and specific tool for the noninvasive assessment of tumor physiology and metabolism, allowing an earlier assessment of therapy response and reducing treatment-related toxicity. 18F-FDG is the most commonly used PET tracer in routine clinical practice for monitoring response to therapy in oncology (2,3). However, 18F-FDG is not a cancer-specific probe, and significant uptake can occur in activated inflammatory cells (macrophages, neutrophils, and fibroblasts) after therapy in both tumor and surrounding tissue (4).
The mechanisms of action of most anticancer drugs include the induction of cell death through multiple processes including apoptosis, necrosis, and other modalities of cell death (5). For example, targeted therapy using conatumumab, a fully human monoclonal agonist antibody (IgG1) directed against the death receptor (DR) 5, has been shown to induce apoptosis in several in vivo models of human cancer, including colorectal cancer (6,7). An advantage of using targeted therapies is their ability to selectively induce apoptosis in tumors and metastases (8), potentially reducing the treatment-related toxicity to the patient. Molecular imaging using cell death–specific radiotracers offers a noninvasive, longitudinal, quantitative, and sensitive approach to predict early responses in patients. In this context, clinically relevant imaging biomarkers of cell death have been identified (9–11). A well-studied one is aminophospholipid exposure (phosphatidylserine and phosphatidylethanolamine) in the cell membrane early in the course of apoptosis or during necrosis (12,13).
In the current study, we used 99mTc-duramycin, exploiting its high affinity and selectivity for phosphatidylethanolamine and optimal biodistribution profile (14,15), for in vivo SPECT imaging of cell death. Using small-animal SPECT and PET imaging of treatment-resistant and treatment-sensitive models of human colorectal cancer, we aimed at directly comparing the performance of 99mTc-duramycin with the current clinical gold standard 18F-FDG for early therapy response evaluation using targeted therapy.
MATERIALS AND METHODS
Animal Model
All the experimental procedures involving animals were approved by the local ethical committee (2015-14, University of Antwerp, Belgium). The xenograft models were generated by subcutaneous injection of COLO205 (2 × 10⁶ in 100 μL of Dulbecco phosphate-buffered saline, n = 20) or HT29 (10 × 106 in 100 μL of Dulbecco phosphate-buffered saline, n = 17) tumor cells into the hind flank of 6- to 8-wk-old female CD1−/− nude mice (body weight, 20–25 g; Charles River Laboratories). When xenografts reached approximately 300 mm3, mice were treated with a single dose of conatumumab (1.5 mg/kg intraperitoneally; Amgen, Inc.; n = 18) or with the corresponding IgG1 isotype control (1.5 mg/kg intraperitoneally; Amgen, Inc.; n = 19). More information is provided in the supplemental materials (available at http://jnm.snmjournals.org).
Radiotracer Preparation
Clinical-grade 18F-FDG was prepared using a Fastlab cassette-based system (GE Healthcare). Radiosynthesis of 99mTc-duramycin and 99mTc-linear duramycin (Supplemental Fig. 1) was performed as previously described (14). More information is provided in the supplemental materials.
Imaging Studies
Treatment-induced changes in the tumors were assessed with 99mTc-duramycin SPECT and 18F-FDG PET imaging. For longitudinal response assessment studies, small-animal SPECT/CT and small-animal PET/CT imaging were performed just before treatment (baseline) and 24 h after therapy (Supplemental Fig. 2). Static whole-body SPECT imaging was performed 4 h after radiotracer injection, because this imaging time point results in optimal tumor-to-background ratios as a result of the optimal blood clearance and rapid renal elimination that results in low background, as we previously demonstrated (14). Further details are provided in the supplemental materials.
Ex Vivo Validation
After image acquisition mice were sacrificed by cervical dislocation. Tumor, blood, and main organs were harvested immediately after sacrifice and weighed, and the radioactivity in the samples was subsequently measured in an automated γ-counter (Wizard2 2480; Perkin Elmer) using a 99mTc and 18F energy window of 121–159 and 450–650 keV, respectively. Data were expressed as percentage injected dose per gram of tissue (%ID/g). After γ-counting, one half of the tumor was rapidly snap-frozen in tissue-Tek (OCT compound; VWR), sectioned (100 μm), and exposed overnight to phosphor screen plates (Fujifilm). Exposed plates were imaged in a Phosphor Imager system (FLA7000; GE Healthcare) for visualization of regional tracer distribution.
Immunohistochemistry
Adjacent tumor paraffin sections (5 μm) were taken at regular intervals across the entire tumor volume and used for histologic analysis of apoptosis. Immunohistochemistry for cleaved caspase-3 (CC3) and TdT-mediated dUTP nick-end labeling (TUNEL) assay were performed. More information is provided in the supplemental materials.
Statistical Analysis
Data were expressed as mean ± SEM. Statistical analysis was performed using Prism (version 6.01; GraphPad Software). Statistical significance between 2 datasets was evaluated by the unpaired 2-tailed Student t test. Differences between groups were considered statistically significant if the P value was less than 0.05. For correlation analysis, the Pearson correlation coefficient was computed with a P value of less than 0.05, which was considered statistically significant.
RESULTS
Monitoring Drug-Induced Tumor Apoptosis
From the apoptosis-inducing effect of conatumumab established by others in colorectal cancer xenografts (6), 24 h after single conatumumab or IgG1 treatment was selected as the optimal imaging time point for response assessment (Figs. 1 and 2). Uptake of 99mTc-duramycin in conatumumab-sensitive COLO205 tumors is shown in Figure 1A. The tracer uptake in these tumors was remarkably low at baseline (0.60 ± 0.05 and 0.64 ± 0.03 %ID/mL, for IgG1- and conatumumab-treated groups, respectively) and significantly increased by 7-fold 24 h after conatumumab treatment (5.21 ± 0.76 %ID/mL; P < 0.001; Fig. 1A, left and right top). IgG1 treatment did not result in an increased accumulation of 99mTc-duramycin in COLO205 xenografts (0.76 ± 0.07 %ID/mL; P > 0.999; Fig. 1A, right). In contrast, 18F-FDG uptake in COLO205 tumors (Fig. 1B) was high at baseline (4.74 ± 0.75 and 4.88 ± 0.19 %ID/mL, for IgG1 and conatumumab groups, respectively) and did not significantly change at 24 h after treatment (4.52 ± 0.12 and 5.76 ± 0.40 %ID/mL; P = 0.777 and 0.082, for IgG1 and conatumumab groups, respectively). Blood glucose was not different between IgG1 and conatumumab treatment groups nor did it change significantly after treatment (Supplemental Table 1). Imaging with 99mTc-linear duramycin (Fig. 1C) showed a rapid tracer washout, as evidenced by the low absolute uptake values at baseline and 24 h after treatment (IgG1, 0.07 ± 0.01 vs. 0.07 ± 0.01 %ID/mL, and conatumumab, 0.08 ± 0.01 vs. 0.09 ± 0.01 %ID/mL, respectively), consistent with the compromised phosphatidylethanolamine binding of linear duramycin. Also, no significant increase from baseline was observed after either IgG1 (P > 0.999) or conatumumab (P > 0.999) treatment in COLO205 tumors with 99mTc-linear duramycin. Changes in 99mTc-duramycin uptake after treatment were not accompanied by a reduction in tumor volume relative to pretreatment in COLO205 xenografts (Supplemental Fig. 3), indicating that 99mTc-duramycin uptake in treatment-responding tumors preceded changes in tumor volumes as assessed by caliper measurements.
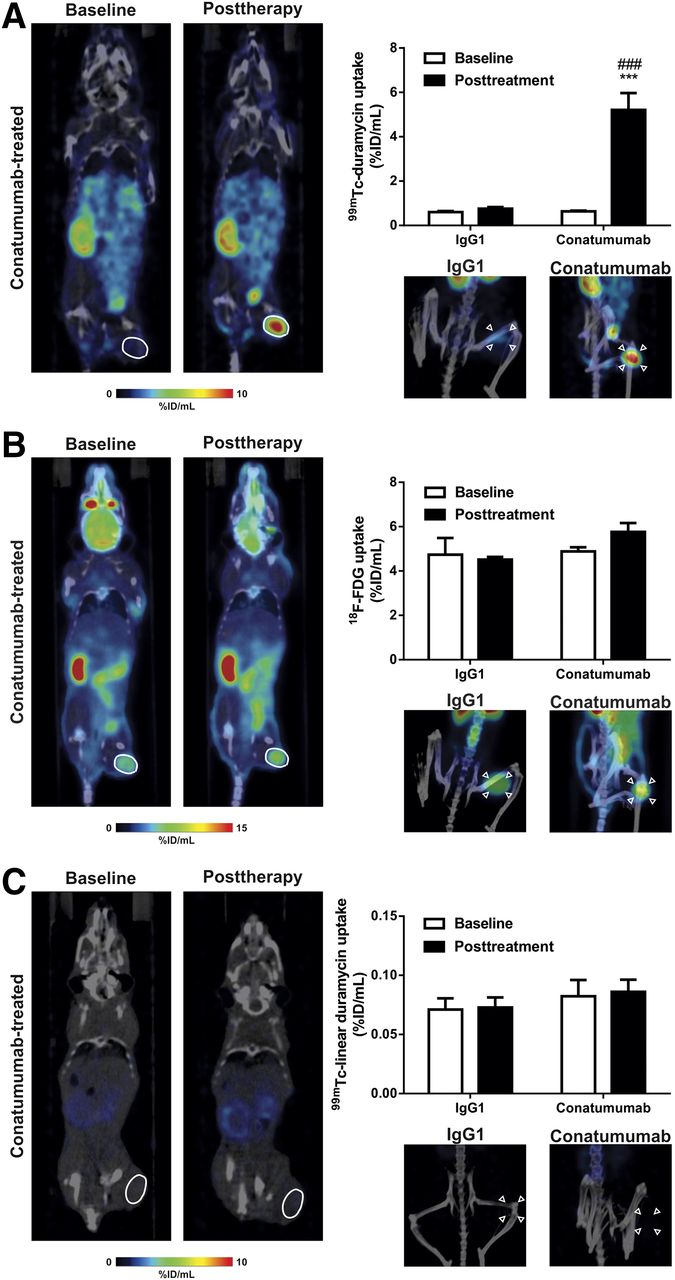
In vivo evaluation of 99mTc-duramycin (A), 18F-FDG (B), and 99mTc-linear duramycin (C) uptake in IgG1- or conatumumab-treated COLO205 xenografts. (Left) Representative coronal small-animal SPECT/CT or PET/CT images of COLO205 tumor–bearing animal at baseline and 24 h after conatumumab treatment. Tumors are encircled. (Right, top) Quantification of radiotracer uptake in COLO205 tumor xenografts (***P < 0.001, significantly different from baseline; ###P < 0.001, significantly different from IgG1 after treatment). (Right, bottom) Maximum-intensity projections showing radiotracer accumulation in COLO205 tumors 24 h after IgG1 or conatumumab treatment. Arrowheads point to COLO205 tumors.
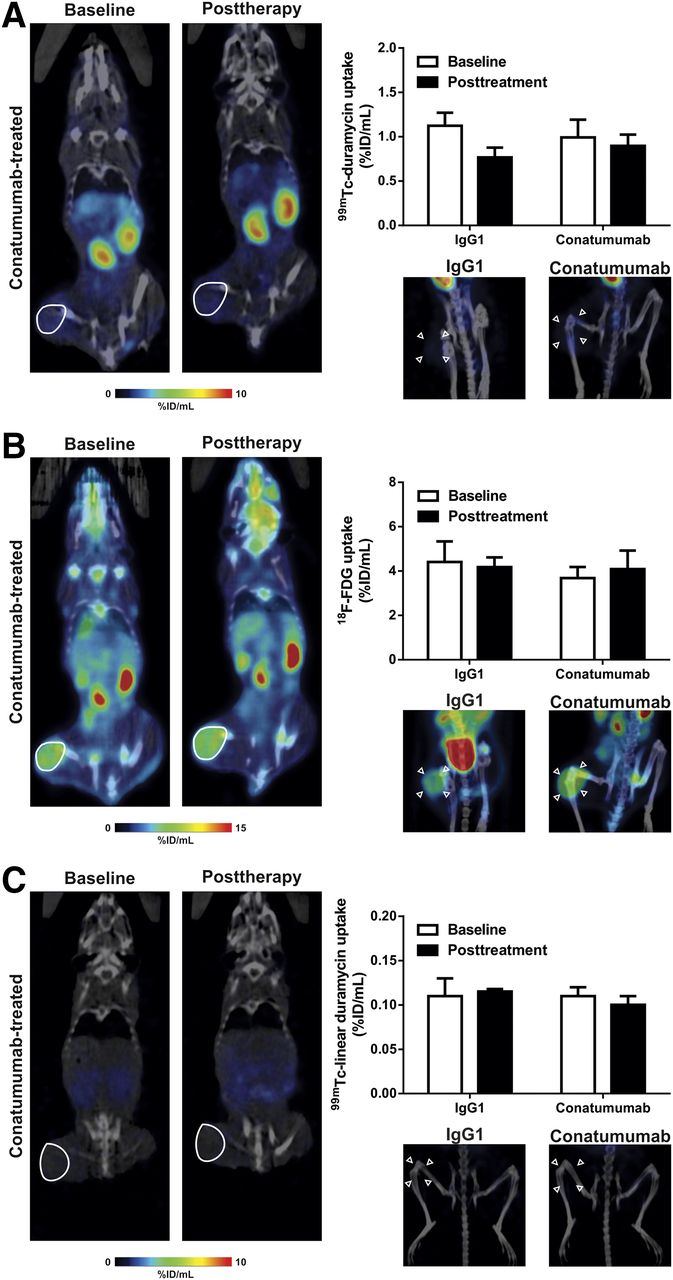
In vivo evaluation of 99mTc-duramycin (A), 18F-FDG (B), and 99mTc-linear duramycin (C) uptake in IgG1- or conatumumab-treated HT29 xenografts. (Left) Representative coronal small-animal SPECT/CT or PET/CT images of HT29 tumor–bearing animal at baseline and 24 h after conatumumab treatment. Tumors are encircled. (Right, top) Quantification of radiotracer uptake in HT29 tumor xenografts. (Right, bottom) Maximum-intensity projections showing radiotracer accumulation in HT29 tumors 24 h after IgG1 or conatumumab treatment. Arrowheads point to HT29 tumors.
To explore whether 99mTc-duramycin uptake in COLO205 tumors is specifically induced by the therapeutic apoptotic response to conatumumab, we additionally assessed radiotracer uptake in either IgG1- or conatumumab-treated human HT29 tumor xenografts, a tumor type well known for its weak expression of DR5 on the cell membrane (16) and resistance to conatumumab-induced cytotoxicity (6). In contrast to what was observed in COLO205 tumors, no significant difference in tumor-associated 99mTc-duramycin uptake between treatment groups was measured by small-animal SPECT. Twenty-four-hour treatment with either IgG1 (0.77 ± 0.11 %ID/mL; P = 0.081) or conatumumab (0.90 ± 0.13 %ID/mL; P = 0.695) showed no increase in uptake of 99mTc-duramycin in HT29 xenografts, with tracer uptake remaining at baseline levels in both groups (Fig. 2A). Similarly, for 18F-FDG no significant change in both IgG1 and conatumumab treatment groups, in comparison to baseline (P > 0.999), or significant differences between both treatment groups (P > 0.999; Fig. 2B) were observed. The uptake of 99mTc-linear duramycin in conatumumab-treated HT29 tumor xenografts (Fig. 2C) remained at baseline levels, in agreement with data obtained for COLO205 tumors. In HT29 xenografts, both conatumumab and IgG1 antibody treatment did not result in a reduction in tumor volume after 24 h relative to pretreatment (Supplemental Fig. 3).
Ex Vivo Validation
Tumor Uptake and Radiotracer Biodistribution
To validate the obtained imaging results, tumor xenografts were harvested, the radioactivity was measured in a γ-counter, and the regional distribution of 99mTc-duramycin (Fig. 3) and 99mTc-linear duramycin (Supplemental Fig. 4) was assessed by autoradiography, immediately after imaging. As assessed by ex vivo γ-counting, the uptake of 99mTc-duramycin in COLO205 tumor tissue 24 h after conatumumab treatment was 4.92 ± 0.66 %ID/g (Fig. 3A) and it was significantly higher than in the IgG1 group (0.60 ± 0.08 %ID/g; P = 0.003). The uptake of 18F-FDG in conatumumab-treated COLO205 tumors was high (2.71 ± 0.34 %ID/g) but not significantly different from the IgG1 control (P = 0.197). The uptake of 99mTc-duramycin and 18F-FDG in HT29 xenografts (1.43 ± 0.29 and 2.10 ± 0.30 %ID/g, respectively; Fig. 3B) did not differ from the IgG1 control group (P = 0.526 and 0.327, respectively). Gamma-counting did not show any significant change in 99mTc-linear duramycin tumor uptake after conatumumab treatment when compared with the IgG1 group for both COLO205 and HT29 tumors (Figs. 3A and 3B). After intravenous injection, 99mTc-duramycin had favorable biodistribution, clearance, and pharmacokinetic profiles. Previously, we and others showed that 99mTc-duramycin quickly cleared from circulation via the renal system, with low hepatic and gastrointestinal uptake (13–15). Radiotracer uptake in blood, muscle, liver, spleen, and kidneys was not significantly changed by conatumumab treatment (P > 0.999), when compared with the IgG1-treated group (Table 1; Supplemental Tables 2 and 3; Supplemental Fig. 5). The tumor-to-blood and tumor-to-muscle ratios of 99mTc-duramycin in COLO205 conatumumab-treated xenografts were 14.93 ± 1.32 (P = 0.003) and 30.80 ± 1.89 (P < 0.001), respectively, and were significantly higher than those in the IgG1 group (Table 1). No statistically significant difference in the tumor-to-background ratios was found between conatumumab- and IgG1-treated HT29 xenografts for all radiotracers. In spite of the known membrane disruptive effects of duramycin (17), the tracer concentrations of duramycin that are used for imaging did not result in any pharmacologic or toxic effect (data not shown).
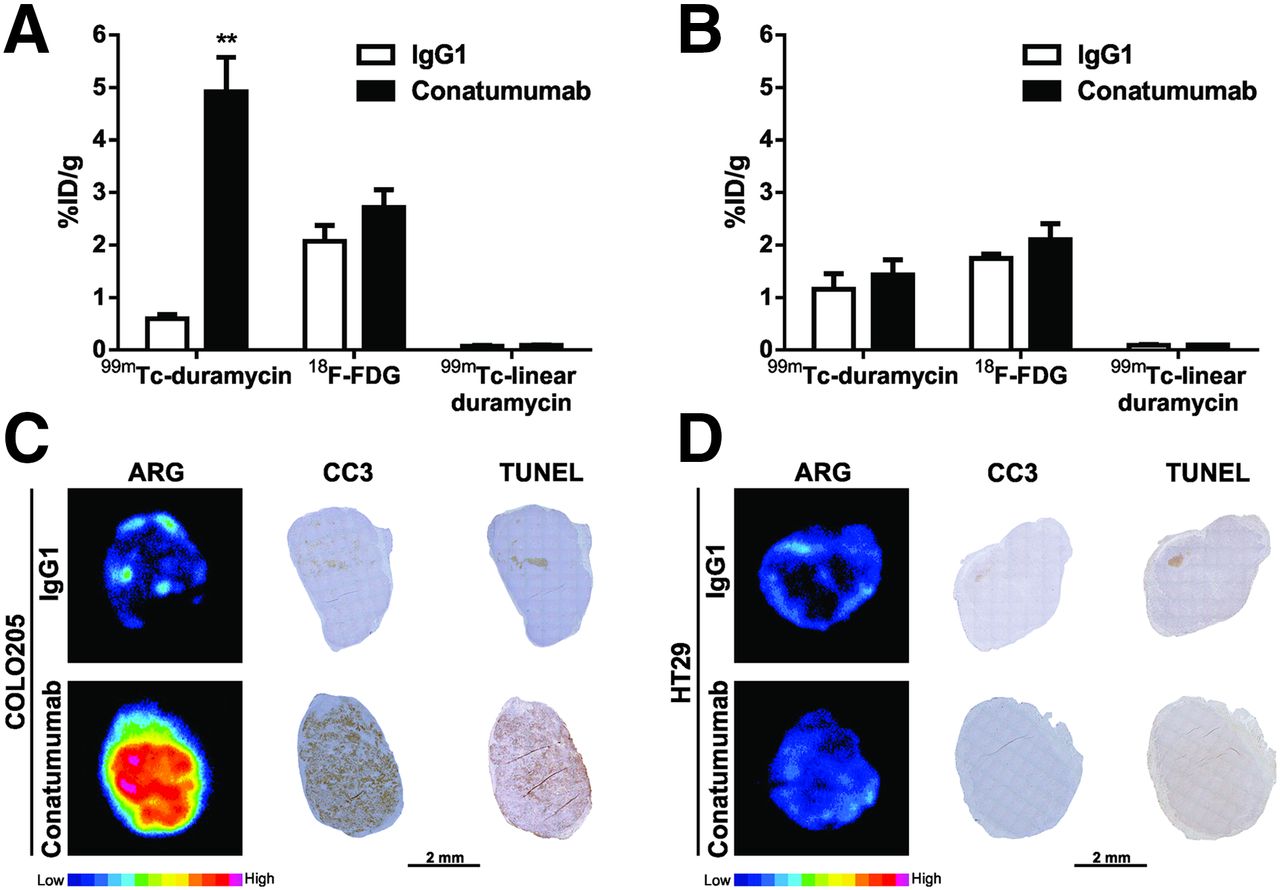
Ex vivo evaluation of radiotracer uptake and tumor apoptosis. Quantification of radiotracer uptake by γ-counting of excised COLO205 (A) and HT29 (B) tumors. **P = 0.003, significantly different from IgG1. Representative pseudocolor autoradiography (ARG) and microscopy images of adjacent COLO205 (C) and HT29 (D) whole-tumor slices stained for CC3 and TUNEL from mice injected with 99mTc-duramycin.
Uptake of 99mTc-Duramycin in COLO205 and HT29 Xenografts 24 Hours After Treatment and Tumor-to-Background Ratios
The higher uptake of 99mTc-duramycin in conatumumab-treated COLO205 tumors was further illustrated by the ex vivo autoradiography of tumor slices (Figs. 3C and 3D). Autoradiographs showed a regional accumulation of 99mTc-duramycin in the tumors and colocalization of increased radioactivity uptake within tumor areas in which there was an elevated rate of apoptotic response, as demonstrated by increased levels of active caspase-3 immunoreactivity and TUNEL staining (Figs. 3C and 3D). In agreement with 99mTc-duramycin autoradiographs, CC3 immunoreactivity and TUNEL levels were modest in IgG1-treated COLO205 and in both conatumumab- and IgG1-treated HT29 xenografts. In contrast, 99mTc-linear duramycin did not accumulate in the tumors with high apoptotic levels (Supplemental Fig. 4).
Relationship Between Radiotracer Uptake and Histology
To determine how well radiotracer uptake predicts response to therapy, quantification of caspase-3 activation and TUNEL staining was performed on whole tumor sections (Figs. 3C, 3D, and 4; Supplemental Fig. 6). In agreement with 99mTc-duramycin uptake, 24 h after conatumumab treatment, COLO205 tumors were characterized by an elevation of caspase-3 activation (9.6% ± 0.7% vs. 1.5% ± 0.5% in the IgG1 group; P < 0.001; Supplemental Fig. 6) and an increased number of DNA strand breaks (9.5% ± 1.9% vs. 0.9% ± 0.4% in the IgG1 group; P < 0.001; Supplemental Fig. 6), as assessed by TUNEL staining. These tumors also showed the presence of small clusters of cells, due to cell shrinkage, and dense nuclear chromatin fragments, characteristic of apoptotic cells, as seen by histologic examination with hematoxylin and eosin stain (Supplemental Fig. 6). Figure 4 shows the scatterplots that demonstrate how well tumor response to therapy (cell death) can be predicted by radiotracer uptake (%ID/g) in the tumors. Animals injected with 99mTc-duramycin showed a good correlation (CC3: r = 0.842, P < 0.001 and TUNEL: r = 0.894, P < 0.001) between whole-tumor mean radioactivity and cell death in histologic sections stained with CC3 and TUNEL (Figs. 4A and 4B), whereas no correlation was found either for 18F-FDG (CC3: r = 0.280, P = 0.333 and TUNEL: r = 0.132, P = 0.653; Figs. 4C and 4D) or for 99mTc-linear duramycin (CC3: r = 0.170, P = 0.617 and TUNEL: r = 0.156, P = 0.628; Supplemental Fig. 7).
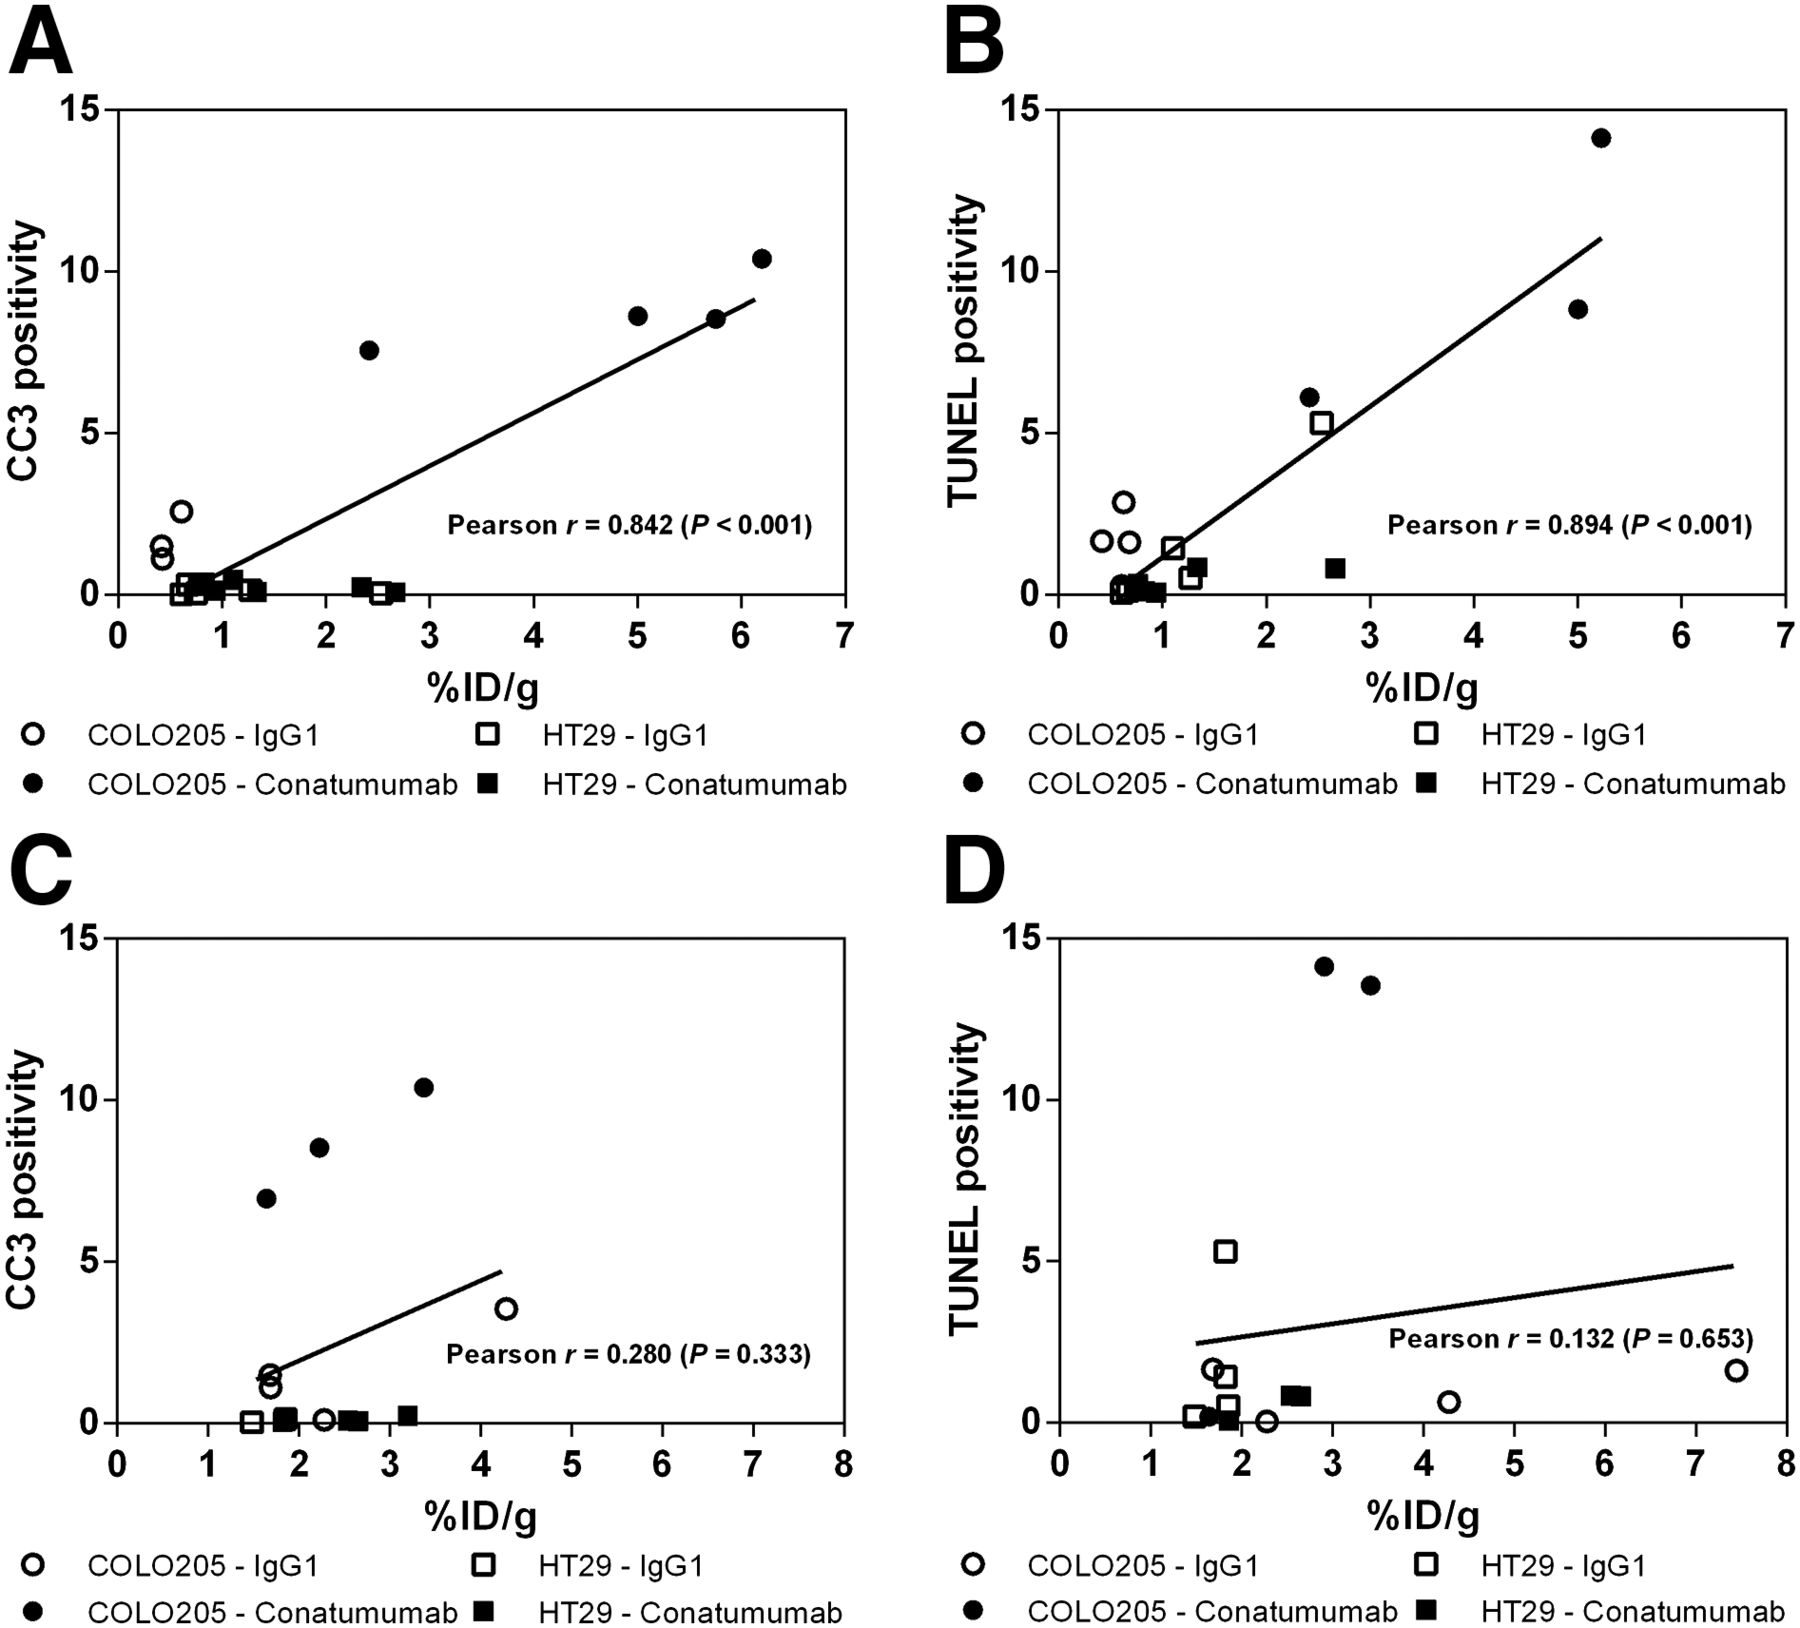
Correlation analysis of radiotracer uptake to histologic measurement of tumor cell death. CC3 and TUNEL staining (cell death) were compared with tumor-associated 99mTc-duramycin (A and B, respectively) and 18F-FDG (C and D, respectively) radioactivity measured ex vivo in the tumors (%ID/g).
DISCUSSION
In the clinic, the assessment of anticancer therapy response represents a major hurdle for therapy management of cancer patients. Resistance to chemotherapy and molecularly targeted therapy is often associated with dysregulation and suppression of cell death mechanisms in tumors (18). Because induction of cell death is a desired effect of most anticancer therapies, the early detection of the levels of cell death after therapy can be used as a surrogate endpoint for tumor response evaluation and assist in the design of appropriate individualized and optimized therapies. Noninvasive molecular imaging strategies to detect apoptosis represent an attractive alternative to histologic assessment of apoptosis routinely performed in the clinic through invasive tumor biopsies. The latter may fail to predict therapeutic response due to underlying genetic and phenotypic heterogeneity of tumors (19). Here, we compared the performance of a novel apoptosis imaging agent, 99mTc-duramycin, to the most widely used PET radiotracer in clinic, 18F-FDG, in treatment-resistant (HT29) and treatment-sensitive (COLO205) human colorectal cancer xenografts for assessment of response to targeted therapy using conatumumab. This anti-DR5 monoclonal antibody is capable of inducing apoptosis in human colon, lung, and pancreas cancer cell lines (6). The known expression of DR5 in tumors of the colorectum (16) was accurately reflected by extensive apoptotic cell death and elevated caspase-3 activity induced by conatumumab in COLO205 xenografts as observed here and elsewhere (6,7,20).
Because in patients only a small increase in the levels of tumor apoptosis (2- to 6-fold) is to be expected after anticancer therapy (10), cell death–targeting radiotracers should be sensitive enough to allow imaging of therapy-induced apoptosis. Among the different tracers, radiolabeled annexin V, which binds to phosphatidylserine, has been widely used to image drug-induced cell death. Labeling with both SPECT (99mTc) and PET (18F, 68Ga) radioisotopes and successful imaging of treatment-induced cell death in human lymphoma and lung and breast cancer (21) have been reported. Previously, our group has demonstrated the potential of 99mTc-duramycin to visualize radiotherapy- (15) and chemotherapy-induced (14,15) apoptosis. The sensitivity for apoptosis imaging was demonstrated by a 3-fold increase in 99mTc-duramycin uptake (2 %ID/g) in colorectal cancer xenografts treated with irinotecan in combination with oxaliplatin versus vehicle-treated tumors, in good correlation with the tumor apoptotic response (4- to 7-fold increase). In the current study, the high apoptotic response induced by conatumumab was followed by a remarkable 7-fold increase in 99mTc-duramycin accumulation (5 %ID/g) in COLO205 tumors, in very good correlation with histologic evidence of apoptosis in tumors. Conatumumab-resistant HT29 tumors showed low levels of 99mTc-duramycin uptake after treatment, which corresponded to a lack of cell death induction, thus showing the high sensitivity of 99mTc-duramycin for predicting early response to therapy. Less encouraging results have been obtained when using the small-molecule caspase-3–targeting tracer 18F-ICMT-11, which has previously shown potential to image apoptosis and is currently in clinical trials (22). 18F-ICMT-11 was unable to detect a 5-fold increase in apoptosis induced by carboplatin treatment in human non–small cell lung carcinoma xenografts (23), and only a disappointingly low 18F-ICMT-11 uptake (0.5-fold increase from baseline) was found in highly apoptotic tumors, with low tumor-to-background ratios (24), after etoposide–cyclophosphamide combination treatment of lymphoma tumor–bearing mice. Additionally, in clear contrast to 99mTc-duramycin, 18F-ICMT-11 showed a suboptimal pharmacokinetic profile, with a high retention of radioactivity in the liver and intestines (25), which may limit its value for imaging the abdominal region. Given the limitations of the existing radiotracers, a novel strategy using a caspase-3–sensitive nanoaggregation PET tracer, 18F-C-SNAT, was developed to overcome the low tumor accumulation in vivo (26). Despite early promise, a recent study demonstrated that although high levels of tumor apoptosis were present after etoposide treatment in lymphoma tumor–bearing mice, only moderate accumulation of 18F-C-SNAT (<3 %ID/g) was found in the tumors (27). Another potential advantage of 99mTc-duramycin over its caspase-3–targeting counterparts is the fact that it can detect therapy-induced necrosis. Because anticancer therapy may have an apoptosis- and necrosis-inducing effect in tumors (28), 99mTc-duramycin can theoretically bind both apoptotic and necrotic tumor cells, potentially leading to an enhanced SPECT signal in responding tumors. The presence of necrosis in some tumors, evidenced here by hematoxylin and eosin staining, may have contributed to the higher baseline uptake of 99mTc-duramycin in HT29 versus COLO205 tumors.
Specificity of 99mTc-duramycin for detecting phosphatidylethanolamine in apoptotic cells was demonstrated by using a 99mTc-labeled linearized duramycin molecule (99mTc-linear duramycin) that lacks affinity for phosphatidylethanolamine. This control peptide is an inactive form of duramycin that does not bind to phosphatidylethanolamine and has a minimally altered structure and the molecular weight of duramycin, as previously described by others (29,30). 99mTc-linear duramycin exhibited a rapid blood clearance, and the biodistribution was prominent in the kidneys and liver similarly to 99mTc-duramycin. On conatumumab treatment, the uptake of 99mTc-linear duramycin in both colorectal cancer xenografts stayed at baseline with no correlation with the levels of apoptosis in the tumors. 99mTc-linear duramycin showed little nonspecific uptake and supports specific phosphatidylethanolamine targeting of 99mTc-duramycin in the tumors.
Furthermore, in HT29 xenografts, 99mTc-duramycin uptake remained at baseline levels after drug treatment. Immunohistochemical and histologic analysis of the tumors was in agreement with these findings, showing little or no evidence of drug activity. Thus, 99mTc-duramycin SPECT imaging reflected the lack of drug efficacy in this tumor, demonstrating that it can differentiate responders from nonresponders already early in the course of therapy, aiding clinicians in their decision to stop or prolong the therapy regimen.
18F-FDG PET is an important clinical standard used for evaluation of cancer treatment response in lymphoma (31) and in breast (32), lung (33), and colorectal carcinoma (34). The uptake of this radiopharmaceutical is tied to the glycolytic metabolic rate of viable tumor cells (Warburg effect). Therefore, changes in 18F-FDG uptake do not provide direct information on cell death, but act only as an indirect measure of tumor response. Importantly, response to treatment as evidenced by increased 99mTc-duramycin tumor uptake was seen as early as 24 h after therapy, whereas only a small but nonstatistically significant increase could be observed in 18F-FDG uptake in treatment-sensitive tumors. Because apoptosis is an energy-dependent process and drug treatment increased apoptosis in these tumors, it may be hypothesized that this limited positive response on 18F-FDG PET was the result of a subsequent increase in glucose (or 18F-FDG) uptake by the therapy-responding tumors—the so-called metabolic flare phenomenon (35). Moreover, it is well known that activated granulocytes and mononuclear cells use glucose as an energy source (36,37). It is therefore not surprising that 18F-FDG accumulates in a variety of inflammatory processes, which are often present after drug or radiation therapy (38) and can give rise to false-positive results. In summary, we show here that 99mTc-duramycin allows specific longitudinal imaging of drug-induced apoptosis in tumors with high sensitivity. In comparison, 18F-FDG was not able to distinguish responding from nonresponding tumors, thus performing poorly in assessing tumor response in the first 24 h after initiation of conatumumab therapy.
CONCLUSION
These findings indicate the potential usefulness of 99mTc-duramycin SPECT imaging for early therapy response assessment after targeted therapy. Along with our previous reports showing fast blood and renal clearance, low accumulation in nontargeted organs, favorable dosimetry, and metabolic stability, this study further supports clinical translation of 99mTc-duramycin for therapy response in cancer patients.
DISCLOSURE
Financial support was provided by GOA (G.0135.13). Brian Gray and Koon Pak are employees of Molecular Targeting Technologies, Inc. No other potential conflict of interest relevant to this article was reported.
Acknowledgments
We gratefully acknowledge Philippe Joye, Caroline Berghmans, and Steven Deleye for their assistance with small-animal imaging. Conatumumab (AMG 655) and IgG1 isotype control antibodies were kindly supplied by Amgen, Inc.
Footnotes
Published online Nov. 22, 2016.
- © 2017 by the Society of Nuclear Medicine and Molecular Imaging.
REFERENCES
- Received for publication August 1, 2016.
- Accepted for publication November 9, 2016.


