


Abstract
The antileukemic drug asparaginase, a key component in the treatment of acute lymphoblastic leukemia, acts by depleting asparagine from the blood. However, little is known about its pharmacokinetics, and mechanisms of therapy resistance are poorly understood. Here, we explored the in vivo biodistribution of radiolabeled asparaginase, using a combination of imaging and biochemical techniques, and provide evidence for tissue-specific clearance mechanisms, which could reduce the effectiveness of the drug at these specific sites. Methods: In vivo localization of 111In-labeled Escherichia coli asparaginase was performed in C57BL/6 mice by both small-animal SPECT/CT and ex vivo biodistribution studies. Mice were treated with liposomal clodronate to investigate the effect of macrophage depletion on tracer localization and drug clearance in vivo. Moreover, macrophage cell line models RAW264.7 and THP-1, as well as knockout mice, were used to identify the cellular and molecular components controlling asparaginase pharmacokinetics. Results: In vivo imaging and biodistribution studies showed a rapid accumulation of asparaginase in macrophage-rich tissues such as the liver, spleen, and in particular bone marrow. Clodronate-mediated depletion of phagocytic cells markedly prolonged the serum half-life of asparaginase in vivo and decreased drug uptake in these macrophage-rich organs. Immunohistochemistry and in vitro binding assays confirmed the involvement of macrophagelike cells in the uptake of asparaginase. We identified the activity of the lysosomal protease cathepsin B in macrophages as a rate-limiting factor in degrading asparaginase both in vitro and in vivo. Conclusion: We showed that asparaginase is rapidly cleared from the serum by liver-, spleen-, and bone marrow–resident phagocytic cells. As a consequence of this efficient uptake and protease-mediated degradation, particularly bone marrow–resident macrophages may provide a protective niche to leukemic cells.
The therapeutic enzyme asparaginase is an essential component of the multidrug regimen used in the treatment of children and adults with acute lymphoblastic leukemia. Upon administration, this drug converts serum asparagine into aspartate, thereby effectively depleting the blood from this amino acid. Unlike most other cells in the body, lymphocytes, including leukemic blasts, are fully dependent on uptake of asparagine from the blood and die as a result of nutrient stress (1).
The effectiveness of asparaginase treatment relies on the complete depletion of asparagine from the leukemic cell niche. It has been suggested that during asparaginase treatment, leukemic cell survival is supported by asparagine released by surrounding mesenchymal cells (2,3). Although asparagine levels are significantly higher in bone marrow aspirates than in matched blood samples, these levels drop after treatment with asparaginase (4,5). However, analyses of aspirates may not accurately reflect asparagine concentrations in situ.
Despite the fact that asparaginase has been a cornerstone of acute lymphoblastic leukemia treatment protocols since its introduction in the 1970s, little is known about the fate of the infused asparaginase and the mechanisms that determine the pharmacodynamics of this drug. With a molecular weight of 170 kDa that greatly exceeds the limits for renal filtration (∼60 kDa), mononuclear phagocyte system (or reticuloendothelial)–based clearance is the suggested mode of degradation (6).
Furthermore, the intracellular and molecular mechanisms that influence asparaginase pharmacokinetics remain poorly understood. One study showed that the lysosomal cysteine proteases legumain (or asparagine endopeptidase) and cathepsin B efficiently degrade asparaginase in vitro (7). Consistent with these observations, we recently identified a patient carrying a germline mutation in cathepsin B who showed strongly delayed asparaginase degradation (8). However, further validation of these findings and their clinical implications is needed.
In the present study, we used small-animal SPECT/CT imaging to visualize the in vivo distribution of 111In-labeled asparaginase in a mouse model and identified both cellular and molecular components that determine asparaginase pharmacokinetics.
MATERIALS AND METHODS
Radiolabeling of Asparaginase
Asparaginase (4 mg, Prospec) was conjugated under strict metal-free conditions with isothiocyanatobenzyl–diethylenetriaminepentaacetic acid (ITC-DTPA; Macrocyclics) in 0.1 M NaHCO3, pH 9.5, using a 10-fold molar excess of ITC-DTPA. After 1-h incubation at room temperature, the conjugation mixture was dialyzed in a dialysis cassette with a molecular cut-off value of 20 kDa (Slide-A-Lyzer 20K; Thermo Scientific) against 0.25 M ammonium acetate, pH 5.5, to remove the unconjugated ITC-DTPA. The substitution ratio, as determined by labeling of the conjugation mixture with 111InCl3 (600–800 MBq; Mallinckrodt), was 0.8 DTPA–asparaginase molecule. 111InCl3 was added to DTPA–asparaginase (50–65 μg) for 1 h at room temperature in 0.1 M 2-(N-morpholino)ethanesulfonic acid buffer, pH 5.4. Free 111In was complexed by adding 50 mM ethylenediaminetetraacetic acid (final concentration of 5 mM). Quality control was performed using instant thin-layer chromatography. To obtain a radiochemical purity 95% or greater, 111In-labeled protein was purified by gel filtration on a disposable PD10 column (GE Healthcare Life Sciences), eluted with phosphate-buffered saline containing 0.5% bovine serum albumin. The specific activity of the radiolabeled asparaginase preparations used in the experiments was 5–12 MBq/μg. The labeling procedure did not affect asparaginase activity, as determined by a Nessler assay (Supplemental Fig. 1A; supplemental materials are available at http://jnm.snmjournals.org).
Mouse Models
All animal experiments were approved by the Animal Experimental Committee of the Radboud University Medical Center and performed in accordance with institutional and national guidelines. Wildtype C57BL/6J mice were obtained from Charles River. Cathepsin B knockout mice were described previously (9) and have been backcrossed to C57BL/6J for 10 generations. All mice were housed in individually ventilated filter-top cages, and a standard diet and water were provided ad libitum. The mice were used between ages 8 and 10 wk.
Small-Animal SPECT/CT Imaging
Mice were injected intravenously with 3 IU of 111In-DTPA–asparaginase (21–24 MBq/mouse in 200 μL) per g of body weight and scanned under anesthesia (isoflurane/O2) at indicated time points after injection using the U-SPECT-II/CT (MILabs (10)). CT scans (spatial resolution, 160 μm; 65 kV; 615 μA) were acquired for anatomic reference. SPECT scans (3 frames of 17 min) were reconstructed using an ordered-subset expectation maximization algorithm, with a voxel size of 0.4 mm. SPECT images were analyzed quantitatively as described previously (11).
Biodistribution Experiments
Mice were injected intravenously with 3 IU of 111In-DTPA–asparaginase per g of body weight. Mice were euthanized by CO2/O2 asphyxiation at the indicated times after injection. Blood and major organs and tissues were dissected, weighed, and counted in a γ-counter. In addition, organs were used for autoradiography and immunohistochemical analysis.
Pharmacokinetics Experiments
Mice were injected intravenously with 3 IU of asparaginase per g of body weight (Takeda). At the indicated times after injection, mice were euthanized by CO2/O2 asphyxiation, a blood sample was drawn, and tissues of interest were dissected. When indicated, mice were pretreated with 150 μL (1 mg/mL clodronate) of liposomes or control liposomes (12) via tail vein injection 24 h before administration of 111In-labeled asparginase. Residual asparaginase activity in serum was determined by photometric detection of the ammonia release after reaction with Nessler reagent (Sigma-Aldrich). In brief, 15 μL of serum were diluted with 60 μL of 44 mM l-asparagine (Sigma-Aldrich) dissolved in 15 mM Tris-HCl buffer, pH 7.3, supplemented with 0.015% (w/v) bovine serum albumin and incubated at 37°C for 30–45 min. The reaction was stopped by the addition of 50 μL of trichloroacetic acid (24.5% [w/v]; Sigma-Aldrich). After centrifugation, 15 μL of the supernatant was added to 120 μL of Nessler solution diluted with deionized water (1:8). The optical density of the solution was measured at 450 nm using the Multiskan Ascent plate reader (MTX Lab Systems).
Autoradiography
Formalin-fixed, paraffin-embedded tissue sections (4 μm) from mice injected intravenously with 111In-asparaginase were dewaxed, rehydrated, and exposed to a phosphor imaging screen for up to 7 d. The screen was scanned in a phosphor imager system (Bioimaging Analyzer System 1800-II; Fujifilm) at a pixel size of 50 × 50 μm.
Asparaginase Binding Assay
Human peripheral blood mononuclear cells (PBMCs) were isolated from blood obtained from healthy volunteers upon informed written consent, using density gradient centrifugation (Lymphoprep; Axis-Shield). Asparaginase (Takeda) was conjugated with fluorescein isothiocyanate (FITC) according to the manufacturer’s instructions (Pierce / Life Technologies). PBMCs or THP-1 cells were incubated with FITC-labeled asparaginase in culture medium for 1 h at the indicated temperatures. After incubation, PBMCs were stained for expression of lineage markers with anti-CD14, -CD45, -CD3, and -CD19 antibodies purchased form BD Biosciences and analyzed using a LSRII flow cytometer (BD Biosciences). The data were collected and analyzed by FlowJo software (version 8.8.7; FlowJo).
Immunohistochemistry
For histological analysis, tissues and organs, including the spleen, lymph nodes, thymus, liver, and femur/tibia, were fixed in 4% formalin during 24 h. Bone-containing tissues were decalcified using Osteosoft (Merck Laboratories). Specimens were embedded in paraffin, and 4-μM serial sections were cut and stained with hematoxylin and eosin following standard procedures. After dewaxing, rehydration, and antigen retrieval using sodium citrate, slides were blocked with 2% normal goat serum (Vector Laboratories) and 2% bovine serum albumin in 0.05% phosphate-buffered saline, Tween20 prior to overnight staining with F4/80 (MCA497GA; AbD Serotec), and asparaginase (ab21013; Abcam) antibodies. Appropriate biotinylated antibodies (Vector Laboratories) were used as secondary antibody, and staining was revealed by incubation with metal-enhanced diaminobenzidine in stable peroxide substrate buffer (Thermo Fisher Scientific Inc.). After being counterstained with hematoxylin (1:3), slides were dehydrated and coverslipped using entellan (Merck Laboratories). Images were captured using a VisionTek digital microscope (Sakura Finetek).
Cell Culture
The human acute monocytic leukemia cell line THP-1 was obtained from the American Type Culture Collection (#TIB-202) cultured in RPMI 1640 containing L-glutamine (Invitrogen /Life Technologies), supplemented with 10% heat-inactivated fetal bovine serum (Greiner Bio-One), and penicillin/streptomycin (100 units/mL; Invitrogen). The mouse leukemic monocyte macrophage cell line RAW264.7 (#TIB-71; American Type Culture Collection) and HEK293 FT (Invitrogen) cells were cultured in Dulbecco modified Eagle medium containing L-glutamine (Invitrogen), supplemented with 10% heat-inactivated fetal bovine serum, penicillin/streptomycin (100 units/mL), and 1% nonessential amino acids (Invitrogen). All cells were incubated at 37°C in a 5% CO2 humidified atmosphere. All cell lines were used within 3 mo of culture. THP-1 differentiation was induced by culturing 5–8 × 10⁶ cells in the presence of 100 nM phorbol myristate acetate (PMA; Sigma-Aldrich) for 3 d. After 3 d, the medium was refreshed by medium without PMA, and terminal differentiation was continued for an additional 3 d.
Real-Time Quantitative Polymerase Chain Reaction
Total RNA was extracted using the RNeasy mini-kit (Qiagen) according to the manufacturer’s instructions. Subsequently, complementary DNA was synthesized with 500 ng of RNA template using the iScriptTM complementary DNA synthesis kit (Bio-Rad). Messenger RNA expression levels were determined using the Power SYBR Green PCR master mix using gene-specific primers (sequences are listed in Supplemental Table 2) and the CFX96 Touch Real-Time PCR detection system (Bio-Rad). TBP messenger RNA expression was used as a reference to obtain the relative fold expression of target genes using the comparative cycle threshold 2(-ΔΔCt) method. Prism software (GraphPad) was used to plot the data and for statistical analysis. A P value of less than 0.05 was considered a significant difference.
Immunoblotting
Whole cell extracts were prepared in NP-40 lysis buffer (200 mM NaCl, 0.5% NP-40, 20 mM Tris-HCl, pH 8.0, 5 mM ethylenediaminetetraacetic acid) and cleared by centrifugation. Protein lysates were resolved by sodium dodecyl sulfate polyacrylamide gel electrophoresis and transferred to a polyvinylidene difluoride membrane. The membranes were probed with primary antibodies against cathepsin B (sc-13985; Santa Cruz Biotechonology) or β-tubulin (#2128; Cell Signalling Technology), followed by horseradish peroxidase–conjugated secondary antibody (DAKO). Proteins were visualized with ECL reagent (GE Healthcare), and expression was detected with Fluorchem (Protein Simple).
Cathepsin B Activity Assay
Cathepsin B activity was measured using the fluorescent substrate Ac-RR-AFC according to the manufacturer’s instructions (BioVision). Prism software was used to plot the data and for statistical analysis. A P value of less than 0.05 was considered a significant difference.
Asparaginase Degradation Assay
THP-1 and RAW264.7 cells were lysed by freeze-thawing in degradation buffer (50 mM trisodium citrate buffer, pH 4.5, 5 mM dithiotreitol), cleared by centrifugation. For each time point, asparaginase (5 IU/mL) was incubated in lysate containing 20 μg of protein. Where indicated, 1 μM Ca-074 (Sigma-Aldrich) was added to inhibit cathepsin B activity. After incubation, asparaginase activity was determined by photometric detection of the ammonia release after reaction with Nessler reagent using the Multiskan Ascent plate reader as described above. Prism software was used to plot the data and for statistical analysis. ANOVA was used to test for significance; a P value of less than 0.05 was considered a significant difference.
Short-Hairpin (shRNA)–Mediated Knockdown
For lentiviral transduction, HEK293FT cells were transfected with 1 lentiviral pLKO.1-puro vector (Dharmacon/GE Healthcare) (Supplemental Table 1 provides shRNA sequences) together with pVSV-G and psPAX2 using Lipofectamine 2000 (Invitrogen). THP-1 cells were transduced in the presence of polybrene (8 μg/mL) and 24 h after transduction selected with puromycin (1 μg/mL) (Sigma-Aldrich).
RESULTS
Small-Animal SPECT/CT and Biodistribution of Asparaginase
To gain more insight into the in vivo distribution of asparaginase and its degradation, we injected mice with 111In-labeled asparaginase and monitored its biodistribution (Fig. 1; Supplemental Video 1). Imaging (Fig. 1A) and ex vivo biodistribution (Fig. 1B) data showed similar trends. Two hours after injection, asparaginase was mainly present in the circulation (15.8 ± 1.4 percentage injected dose per gram [%ID/g]). However, already at this time point we observed accumulation in the liver (8.5 ± 0.4 %ID/g) and spleen (21.1 ± 3.6 %ID/g), the organs in which a large part of the phagocytic cells reside that make up the mononuclear phagocyte system (Fig. 1B). Additionally, we observed that a significant part of radiolabeled asparaginase label rapidly localized to the skeleton (femur at 2 h after injection: 13.0 ± 4.0 %ID/g), suggesting active uptake by bone marrow–resident cells. Over time, the radiolabeled drug levels decreased in the blood pool, but drug uptake in the femur remained stable (at 19 h after injection: 14.6 ± 1.7 %ID/g) and increased in the spleen (42.1 ± 15.9 %ID/g) and liver (10.5 ± 1.5 %ID/g) (Fig. 1B).
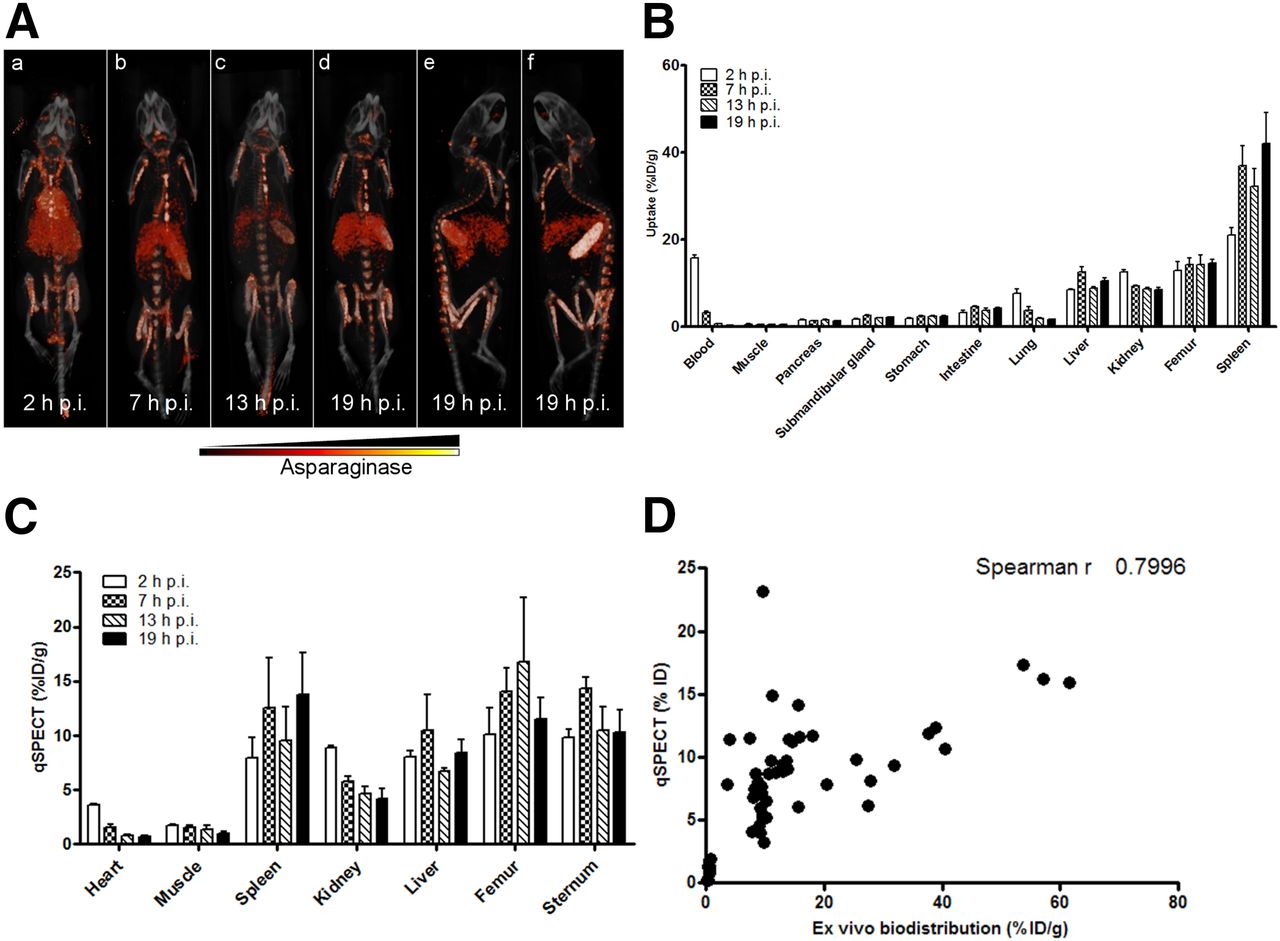
Asparaginase rapidly accumulates in spleen, liver, and bone marrow. (A) Ventral (a–d) and lateral (e and f) 3-dimensional volume projections of fused SPECT/CT scans of mice injected with 111In-labeled asparaginase at indicated hours after injection (h p.i.). (B) Ex vivo quantification of 111In-labeled asparaginase uptake in various organs at indicated hours after injection. Data represent mean ± SEM of n = 5 mice per time point. (C) Biodistribution of asparaginase as quantified from SPECT images. n = 3 per time point. (D) Uptake of 111In-labeled asparaginase as quantified from small-animal SPECT images plotted against values derived from ex vivo biodistribution studies.
Quantitative SPECT analysis revealed an almost identical in vivo distribution as determined by ex vivo biodistribution (Fig. 1C; Supplemental Fig. 1B). For instance, radiolabeled asparaginase cleared rapidly from the blood and increased in the spleen over time (7.9 ± 1.9 %ID/g and 13.8 ± 3.8 %ID/g at 2 and 19 h after injection, respectively). Uptake of 111In-asparaginase in the femur and sternum remained unaltered at 2 (10.1 ± 2.4 %ID/g) and 19 h (11.5 ± 2.0 %ID/g) after injection. Quantitative SPECT data and biodistribution data correlated well as shown in Figure 1D (Spearman r at 0.7996).
Autoradiography (Supplemental Fig. 2A) and immunohistochemical analysis using antiasparaginase antibodies (Supplemental Fig. 2B) were used to study asparaginase localization in more detail. This analysis revealed accumulation of asparaginase in the bone marrow in the spinal cord and hind legs. Uptake in the spleen was restricted to the macrophage-rich structure known as red pulp. The accumulation of asparaginase in the kidney was limited to the cortex of this organ, consistent with glomerular entrapment. The asparaginase immune stainings showed a pattern similar to that of the macrophage marker F4/80, suggesting that macrophagelike cells are responsible for the uptake. Together these results point toward a crucial role for phagocytic cells in the liver, spleen, and bone marrow in the clearance of asparaginase, which is in line with a previous study that showed that asparaginase kinetics are affected by virus-mediated inhibition of macrophage function (13).
Macrophage Depletion by Clodronate Liposomes Disrupts Asparaginase Biodistribution
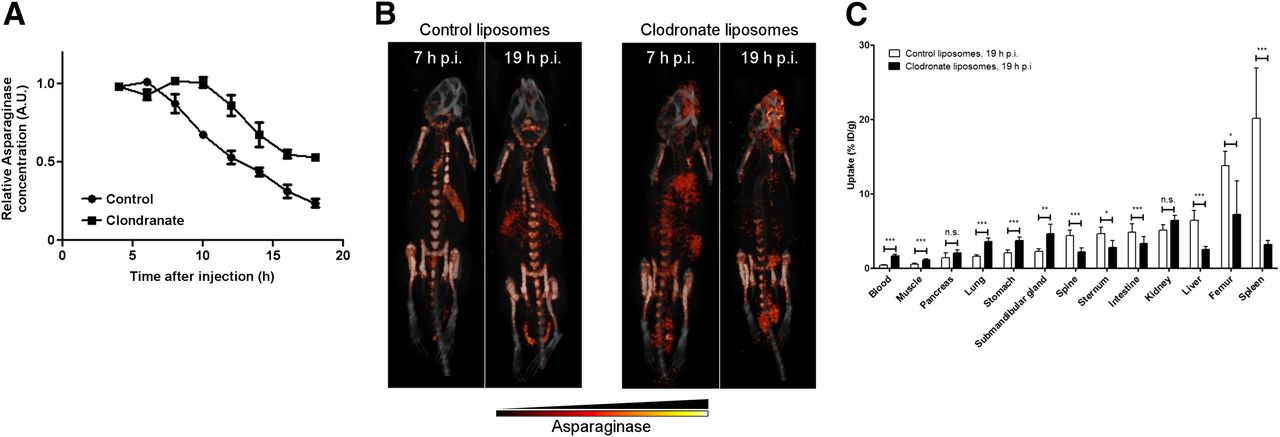
To further study the role of phagocytic cells for asparaginase biodistribution and turnover, we used clodronate liposomes to deplete phagocytic cells from the organs of interest. We observed an almost complete depletion of F4/80-positive macrophages in the liver and spleen and a marked decrease of the numbers of macrophages in bone marrow (Supplemental Fig. 3) 24 h after injection of clodronate liposomes. Clodronate pretreatment significantly prolonged the serum half-life of asparaginase (Fig. 2A). Small-animal SPECT/CT (Fig. 2B; Supplemental Video 2) and ex vivo biodistribution assays (Fig. 2C) confirmed that clodronate pretreatment markedly affected the in vivo distribution of asparaginase. SPECT scans of control mice were similar to those obtained in previous experiments. In contrast, in clodronate-treated mice, asparaginase was still detectable in the circulation, whereas little activity was observed in the liver (2.5 ± 0.4 %ID/g) and spleen (3.2 ± 0.5 %ID/g), indicating a near-complete block in asparaginase uptake by these organs. Furthermore, accumulation in the bone marrow was significantly diminished (femur: 7.2 ± 4.5 %ID/g; spine: 2.2 ± 0.5 %ID/g; sternum: 2.8 ± 0.9 %ID/g), which is consistent with the partial depletion of macrophages in this tissue (Supplemental Figs. 3E and 3F). Together, our results establish a central role for phagocytic cells in the regulation of asparaginase pharmacokinetics.

Depletion of macrophages affects asparaginase pharmacokinetics and biodistribution. (A) Residual serum asparaginase activity at indicated times after injection in mice. Mice were treated with single dose of control or clodronate liposomes 24 h before asparaginase injection. At indicated times after injection of unlabeled asparaginase, serum samples were taken and asparaginase activity was determined as described in “Materials and Methods” section. Data represent mean ± SEM of n = 3 mice per time point per treatment group. ANOVA statistical analysis was applied to test for significance (P < 0.05). (B) Ventral 3-dimensional volume projections of fused SPECT/CT scans of mice treated with single dose of control or clodronate liposomes 24 h before 111In-labeled asparaginase injection. Scans were obtained at 7 or 19 h after injection (h p.i.) with 111In-labeled asparaginase. (C) Ex vivo quantification of 111In-labeled asparaginase uptake in various organs of mice pretreated with control or clodronate liposomes, 19 h after injection of asparaginase. Data represent mean ± SEM of n = 5 mice per time point per treatment group. Statistical significance was determined by unpaired 2-sided t test. *P < 0.05. **P < 0.01. ***P < 0.001. n.s. = not significant.
Assessment of Biologic Clearance Mechanism
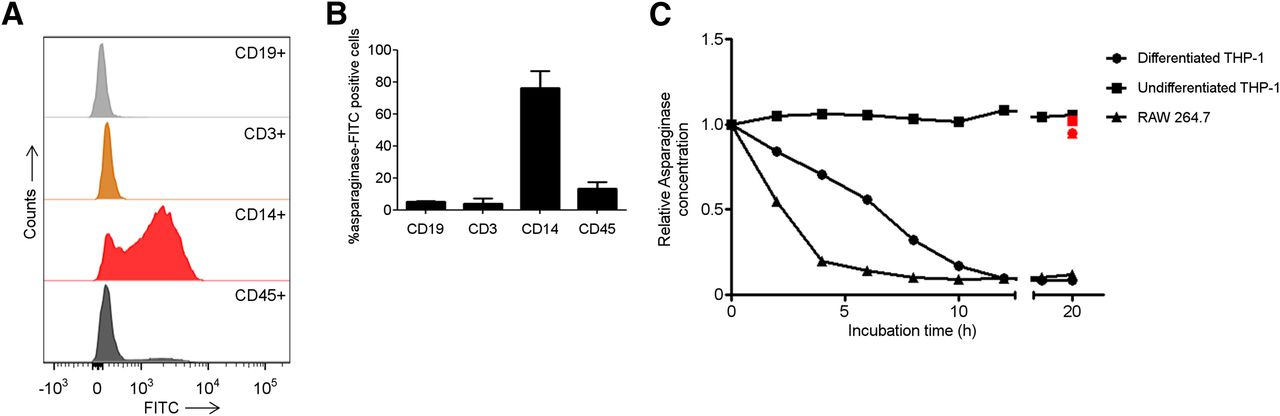
Our data indicate highly efficient uptake of asparaginase by murine phagocytic cells. To determine whether these findings could be replicated with human cells, we incubated freshly isolated PBMCs from healthy volunteers with FITC-labeled asparaginase and used flow cytometry to assess which cells bind or internalize asparaginase. Consistent with our observations in mice and with previous reports (13,14), predominantly cells expressing the monocyte/macrophage marker CD14 (76.4% ± 14.8%) were found to bind asparaginase (Fig. 3B).

Human macrophages bind and degrade asparaginase. (A) Histograms showing binding of asparaginase to various cellular subsets in PBMCs. Freshly isolated PBMCs were incubated with FITC-labeled asparaginase and subsequently identified on basis of indicated cell surface markers using flow cytometry. Lineages were defined as follows: CD45, all nucleated cells; CD14, monocytes/macrophages; CD3, T cells; CD19, B cells. (B) Average of percentage of peripheral blood mononuclear cell subsets binding FITC-labeled asparaginase (n = 2). (C) Asparaginase degradation in lysates of cell lines. Asparaginase was incubated in lysate of human undifferentiated, monocytelike THP-1 cells (▪); differentiated, macrophage like THP-1 cells (●); and murine macrophage cell line RAW264.7 (▲). After incubation, residual ASNase activity was assayed as described in “Materials and Methods” section. Cathepsin inhibitor CA-074 was included to selected samples to confirm contribution of cathepsin B in this degradation (red data points).
In an earlier study, we identified lysosomal protease cathepsin B as a critical determinant of asparaginase half-life (8). To link this observation to the potential role for phagocytic cells identified here, we studied the role of cathepsin B in macrophage-mediated degradation of asparaginase. To this end, we used THP-1 cells, a human monocytic cell line that can be forced into differentiation toward a macrophagelike phenotype using phorbol-12-myristate-13-acetate. Similar to freshly isolated CD14+ cells, THP-1 cells efficiently bound asparaginase (Supplemental Fig. 4). We used a previously described in vitro degradation assay (8) to show that asparaginase activity remained unaffected in the monocyte lysate, whereas the protein was rapidly degraded in lysates from differentiated cells. We observed a similar but even more efficient degradation in lysates of the murine macrophage cell line RAW264.7. Importantly, degradation in both macrophage lysates was completely inhibited by the addition of the cathepsin B inhibitor CA-074 (Fig. 3C, red marked values).
To investigate the correlation between cathepsin B expression and asparaginase degradation, we compared cathepsin B messenger RNA expression levels in undifferentiated versus differentiated THP-1 cells (Fig. 4A) and found that cathepsin B messenger RNA expression is strongly induced on differentiation. RNA interference–mediated suppression of cathepsin B activity (Fig. 4B; Supplemental Figs. 5A and 5B) resulted in a complete or partial block of asparaginase degradation, depending on knockdown efficiency (Fig. 4C). Furthermore, we observed that the serum half-life of asparaginase was strongly prolonged in cathepsin B knockout mice (Fig. 4D). Together, these data firmly establish that cathepsin B activity is an essential and rate-limiting enzyme for asparaginase degradation by macrophages.
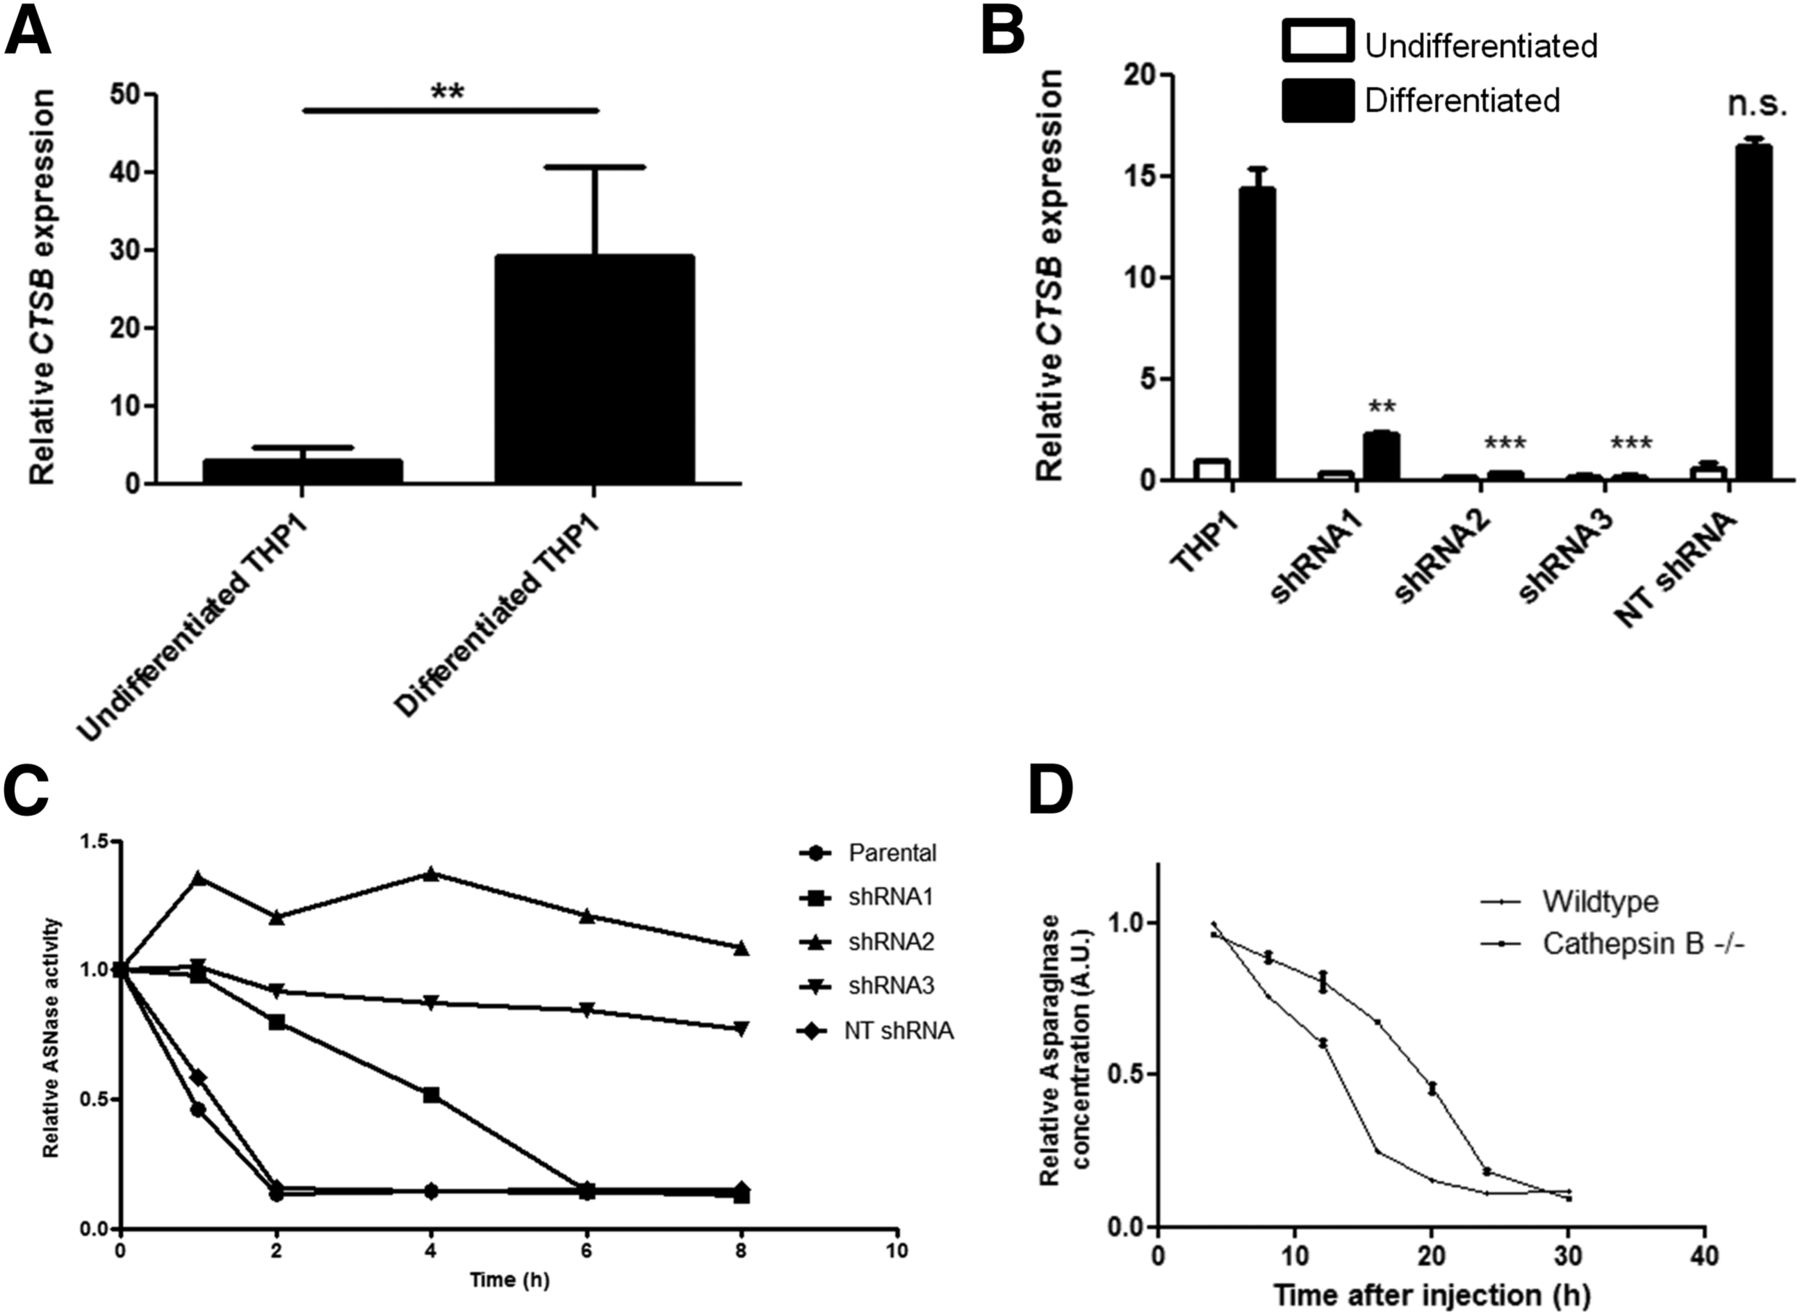
Cathepsin B is required for asparaginase degradation and controls asparaginase pharmacokinetics. (A) Real-time quantitative polymerase chain reaction analysis of cathepsin B messenger RNA expression in undifferentiated and PMA-induced differentiated THP-1 cells, normalized for expression of TATA binding protein. Data represent mean ± SEM of n = 4. Statistical significance was determined by unpaired 2-sided t test. **P < 0.01. (B) Real-time quantitative polymerase chain reaction analysis of cathepsin B messenger RNA expression in undifferentiated and PMA-induced differentiated THP-1 cells transduced with shRNAs targeting cathepsin B or control, nontargeting (NT) shRNA. Data are normalized for TBP expression and shown as mean ± SD of n = 2. Statistical significance was determined by unpaired 2-sided t test. **P < 0.01. (C) Asparaginase degradation in lysates of cell lines. Asparaginase was incubated in lysate of differentiated THP-1 cells, transduced with control of cathepsin B–targeting shRNAs. After incubation, residual ASNase activity was assayed as described in “Materials and Methods” section. Representative example of multiple experiments (n = 3) is shown. (D) Residual serum asparaginase activity at indicated times after injection in mice. Cathepsin B knockout mice and age- and sex-matched control were injected with unlabeled asparaginase. At indicated times after injection of unlabeled asparaginase, serum samples were taken and asparaginase activity was determined as described in “Materials and Methods” section. Data represent mean ± SD of n = 2 mice per time point per treatment group. ANOVA statistical analysis was applied to test for significance (P < 0.05). n.s. = not significant.
DISCUSSION
Despite the fact that asparaginase has been used for decades in the treatment of patients with acute lymphoblastic leukemia, little is known about its metabolic fate in patients. Although depletion of asparagine in serum and bone marrow aspirates can be monitored and shows complete depletion when asparaginase concentrations reach threshold levels, concentrations in situ and the supportive role of the microenvironment are the subject of debate (2,3,5,15–18). The question remains whether asparaginase is sufficiently active at this particular niche in which the leukemia originates and leukemia-initiating cells reside.
We applied in vivo imaging of radiolabeled asparaginase with small-animal SPECT/CT to visualize asparaginase biodistribution. In addition to the spleen and liver, both organs most frequently involved in uptake of foreign macromolecules and particles, we found a remarkably rapid and strong accumulation of asparaginase in the bone marrow (Fig. 1). Although bone marrow–resident macrophages are part of the mononuclear phagocyte system, the role of these cells in clearing the blood from macromolecules is often secondary to spleen- and liver-resident cells and is directed by the size of the molecule (19,20). Because of its therapeutic action, asparaginase needs to be present in the serum, raising the question of whether rapid clearance of the drug by bone marrow–resident macrophages will negatively affect the depletion of asparagine in the bone marrow niche. Hence, our imaging approach may point toward a rapid local elimination of the drug that could provide a mechanism by which leukemic cells can escape from apoptosis as a result of the asparaginase-induced nutrient limitation.
We have limited our studies to Escherichia coli asparaginase. Two other formulations are in use in clinical practice: Erwinia chrysamthemi asparaginase is frequently used as a second-line treatment option after development of inhibitory antibodies. In our previous study (8), we showed that the kinetics of Escherichia coli and Erwinia asparaginase are similarly affected by a mutation in cathepsin B. In addition to its native form, a PEGylated form of Escherichia coli asparaginase, which was introduced to reduce hypersensitivity reactions to the drug, is widely used in the clinic. However, recent work indicates that similar to native or recombinant asparaginase, PEG-asparaginase treatment should also be supported by therapeutic drug monitoring to prevent underexposure (21). As a result, the benefits compared with the use of native asparaginase are reduced. Several studies have shown that the structure of asparaginase permits the introduction of modifications without appreciable loss of enzymatic function (7,22,23). The data we present here may provide a rationale for the generation of novel modified versions of asparaginase. Because our data show that phagocytic cells are an important sink for asparaginase, as well as a key determinant of the asparaginase pharmacokinetics, preventing these interactions, by means other than PEGylation, could be of benefit. A modified form of asparaginase that exhibits a reduced affinity for surface receptors of phagocytic cells is expected to have a prolonged half-life and show delayed clearance from the bone marrow and thus enhanced therapeutic efficacy. In addition, because uptake by phagocytic cells and subsequent presentation is the first step in the activation of the immune response, interfering with this initial step may prevent or delay the formation of inhibitory antibodies. Future studies should therefore generate more insight into interaction between these cells and asparaginase.
Only a few studies have addressed the potential molecular mechanisms involved in the regulation of asparaginase kinetics (7,8). We show a highly efficient uptake of asparaginase by phagocytic cells, predominantly macrophages (Figs. 2 and 3). We previously showed that asparaginase is extremely stable when incubated in serum ex vivo (8). Although we cannot exclude that in vivo, asparaginase is subject to degradation in the serum and subsequent endocytosis of fragments, our results point toward active uptake by phagocytic cells. These cells express a large variety of antigen uptake receptors that recognize macromolecules based on charge, peptide structure, or modification, which are subsequently internalized and degraded in the endolysosomal compartment (24). Previous reports discuss the role of lysosomal proteases in controlling asparaginase degradation in vitro and in vivo (7,8). Our recent finding that the prolonged half-life of asparaginase in a pediatric patient with acute lymphoblastic leukemia may be attributed to a germline mutation in the cathepsin B (8) is now further supported by the in vitro and in vivo experiments presented here.
We have shown using both a small-molecule inhibitor and RNA interference–mediated knockdown (Fig. 4) that lysosomal protease cathepsin B is required for the efficient degradation of asparaginase by both human and murine macrophages (Fig. 4). Our in vivo studies demonstrate that loss of cathepsin B leads to a significantly prolonged asparaginase half-life in vivo, whereas inhibition of cathepsin B activity completely abolishes its degradation in vitro. These results are in accordance with our previous report, which linked a germline loss-of-function mutation in the gene encoding cathepsin B to a prolonged serum half-life of asparaginase in a pediatric patient (8). On the basis of these results, we conclude that cathepsin B plays a major role in the degradation of asparaginase. Although the incomplete depletion of phagocytic cells may explain the partial block of asparaginase turnover in the clodronate-treated mice, the fact that cathepsin B knockout mice display only a delayed clearance indicates that other mechanisms of asparaginase will contribute to the regulation of asparaginase kinetics. However, because lysosomal processing of epitopes is a crucial step toward successful antigen presentation, pharmacologic inhibition of cathepsin B, which is currently being explored in a preclinical setting for a different purpose (25), may not only prolong the serum half-life of the asparaginase, but also attenuate the immune response directed against this therapeutic protein.
CONCLUSION
By using small-animal SPECT/CT, we showed that asparaginase is efficiently cleared by macrophages of the mononuclear phagocyte system. In particular, bone marrow–resident macrophages may provide a protective environment for leukemic cells by effectively removing the therapeutic protein from the bone marrow niche. Cathepsin B is required for the degradation of asparaginase by macrophages, and this degradation aids in the regulation of serum half-life. These new insights into both the prominent role of macrophages and the importance of the lysosomal protease cathepsin B in asparaginase clearance may aid in a rational design of a next-generation asparaginase.
DISCLOSURE
This work was supported in part by research funding from KiKa (grant #134) (Laurens T. van der Meer). No other potential conflict of interest relevant to this article was reported.
Footnotes
↵* Contributed equally to this work.
Published online Aug. 4, 2016.
- © 2017 by the Society of Nuclear Medicine and Molecular Imaging.
REFERENCES
- Received for publication May 23, 2016.
- Accepted for publication July 25, 2016.


