


Abstract
The purpose of this study was to assess various volume-based PET quantification metrics, including metabolic tumor volume and total lesion glycolysis (TLG) with different thresholds, as well as background activity–based PET metrics (background-subtracted lesion activity [BSL] and background-subtracted volume) as prognostic markers for progression-free and overall survival (PFS and OS, respectively) in early-stage I and II non–small cell lung cancer (NSCLC) after resection. Methods: Patients (n = 133) underwent an adequate 18F-FDG PET/CT scan before surgery between January 2003 and December 2010. All PET activity metrics showed a skewed distribution and were log-transformed before calculation of the Pearson correlation coefficients. Survival tree analysis was used to discriminate between high- and low-risk patients and to select the most important prognostic markers. The Akaike information criterion was used to compare 2 univariate models. Results: Within the study time, 36 patients died from NSCLC and 26 patients from other causes. At the end of follow-up, 70 patients were alive, with 67 patients being free of disease. All log-transformed PET metrics showed a strong linear association, with a Pearson correlation coefficient between 0.703 and 0.962. After multiple testing corrections, only 1 prognostic marker contributed a significant split point in the survival tree analysis. Of 10 potential predictors including 7 PET metrics, a BSL greater than 6,852 (P = 0.017) was chosen as split point, assigning 13 patients into a high-risk group. If BSL was removed from the set of predictors, a 42% TLG (TLG42%) of greater than 4,204 (P = 0.023) was chosen as split point. When a dichotomized BSL or TLG42% variable was used for a univariate Cox model, the Akaike information criterion difference of both models was smaller than 2; therefore, the data do not provide evidence that 1 of the 2 prognostic factors is superior. Conclusion: Volume-based PET metrics correlate with PFS and OS and could be used for risk assessment in stage I–II NSCLC. The different PET metrics assessed in this study showed a high correlation; therefore, it is not surprising that there was no significant difference to predict PFS or OS within this study. Overall, patients with large and metabolically active tumors should be considered high risk and might need further treatment after resection. Because all analysis steps were done with the same data, these results should be validated on new patient data.
The most common cancer and leading cause of cancer death worldwide is lung cancer, with non–small cell lung cancer (NSCLC) being by far the most common subtype. The therapeutic options depend on tumor stage, based on tumor size, tumor localization, infiltration of adjacent structures, lymph node involvement, and distant metastasis (1). In early-stage NSCLC, a surgical procedure is considered the treatment of choice whereas the treatment in cases with local progression is more controversial (2). The need for adjuvant therapy is still controversial after complete resection without positive margins of stage I–II NSCLC patients. Although adjuvant chemotherapy based on cisplatin in combination with vinorelbine or gemcitabine is recommended for nodal-positive stage IIA–IIB, observation is recommended for nodal-negative patients, unless one of the factors considered to be indicative for a higher risk is present (poorly differentiated tumors, vascular invasion, wedge resection, tumors > 4 cm, visceral pleural involvement, and unknown lymph node status), according to the National Comprehensive Cancer Network guidelines 2016 (3).
Although 18F-FDG PET has been an integral component of staging NSCLC for more than 10 y (4,5) and multiple studies showed already early on that the metabolic tumor activity on PET images is an independent prognostic factor for progression-free survival (PFS) and overall survival (OS) (6–10), high metabolic tumor activity is not considered a risk factor for tumor staging and does not have an impact on treatment. This additional information about tumor aggressiveness in addition to the extent of metastasis on 18F-FDG PET/CT could be incorporated into clinical decisions regarding the need of adjuvant therapy.
There are several potential reasons why tumor metabolism still is not considered for tumor assessment; the first might be based on the methodology chosen to determine predictive measures. Most publications assess the median value of the PET metrics as a virtual cutoff for Kaplan–Meyer survival analysis, resulting in various different cutoffs published in the literature (e.g., for SUVmax 15 (6), 7.8 (10), or 6 (8)) being variable and highly dependent on selected patient population.
A second reason might be the wide variety of methods for PET quantification, including the most commonly reported SUVmax, which reflects only the hottest voxel and is therefore prone to high statistical noise and does not represent the overall tumor activity (11–13). PET activity measures incorporating tumor volume have been developed, including the metabolic tumor volume (MTV), defined as the total number of voxels within a volume of interest having an uptake above a predetermined SUV threshold, and the total lesion glycolysis (TLG), as a multiplication of the MTV and the SUVmean measuring the uptake of the entire lesion (14). Several studies showed that TLG and MTV have a superior correlation to PFS and OS compared with SUVmax for NSCLC (15–17). Liao et al. investigated in stage IV NSCLC patients the prognostic value of baseline whole-body tumor burden measuring the MTV, TLG, SUVmax (15). A study by Lee at al. described MTV, independent of other established prognostic factors (e.g., stage), to be highly prognostic for disease progression and death in lung cancer (18).
However, the SUV threshold has not yet been standardized, and several thresholds from SUVmax (40%–50%) as well as absolute thresholds including all voxels with an SUV over 2.5 (TLG2.5) were suggested.
A recent study, however, showed a systematic bias for PET volume quantification with absolute thresholds or relative thresholds based on SUVmax, demonstrating that 18F-FDG activity of lesions with a high SUVmax are underestimated by TLG42% whereas the activity of lesions with low activity are underestimated by TLG2.5 and that a background-subtracted lesion activity (BSL) and a background-subtracted volume (BSV) were more accurate in both phantoms and humans (11). Furthermore, a retrospective analysis of therapy response assessment with 18F-FDG PET/CT before and after neoadjuvant chemotherapy showed that the relative difference for BSL and BSV significantly correlated with the tumor regression grade on histopathology whereas PET volume metrics based on an SUVmax 42% threshold did not (19). Others proposed background-based thresholds to delineate MTV and TLG for NSCLC and showed correlation to OS, using liver activity as background. This, however, could limit the analysis of adenocarcinomas, known to have only mild 18F-FDG activity, and therefore would be underestimated by the proposed method (20).
Therefore, it was the aim of our study to compare background-based volume PET metrics with the commonly used quantification methods SUVmax, TLG, and MTV with survival tree models, to predict early recurrence and OS after resection of stage I and II bronchial carcinomas in a large study cohort.
MATERIALS AND METHODS
This retrospective, single-center study was approved by the Institutional Review Board. The conduct of the study met all local legal and regulatory requirements and was in accordance with the ethical principles originating from the International Conference on Harmonization guideline E6: good clinical practice (KEK-ZH 2014-0130). One hundred thirty-three consecutive patients were included with bronchial carcinoma stage I and II who had undergone 18F-FDG PET/CT before surgery. Inclusion criteria were histopathology or cytology confirming adeno or squamous cell carcinoma, tumor stage I or II, and 18F-FDG PET/CT performed within 119 d before surgery. Exclusion criteria were tumor stage III or IV; second malignancy; malignant pleural or pericardial effusion; surrounding inflammatory infiltrate with increased 18F-FDG activity that could not be separated from the tumor lesion; off-site PET/CT before surgery without quantitative adequate imaging; paravenous injection; patient not fasting for at least 4 h; and elevated blood glucose (>7 mmol/dL). PET/CT images were acquired from January 2003 until September 2010; surgery followed from January 2003 until December 2010. Clinical follow-up was performed according to guidelines of the European Society for Medical Oncology, with clinical and CT control every 3 mo in the first year, every 6 mo for the second and third years, and annual checks for the fourth and fifth years. Follow-up 18F-FDG PET/CT was performed for unclear findings.
PET/CT Acquisition and Analysis
All patients were examined using a routine clinical protocol in our institution on dedicated PET/CT scanners (GE Healthcare DSTX, 16- or 64-slice CT, 7–8 frames, frame time of 2 min) with injection of 350 MBq of 18F-FDG 45–60 min before examination. A low-dose unenhanced CT scan was obtained for attenuation correction and used for anatomic localization (80 mA, 140 kV). Approximate total dose equivalent for the entire PET/CT examination was 10 mSv. Image analysis was performed independently by a dual–board-certified nuclear medicine physician and radiologist and a nuclear medicine trainee with 2 y of radiology experience.
A cubic volume of interest (VOI) was placed around the primary tumor, in a way that the entire tumor activity was within the VOI but no physiologically increased activity (e.g., 18F-FDG uptake in the heart) was included, using the Advantage Window 4.6 software (GE Healthcare). Physiologic 18F-FDG uptake within the selected tumor VOI was manually segmented using the cut inside tool. Within the selected VOI, the hottest voxel was measured (SUVmax); MTV and the corresponding TLG above 42% from SUVmax as well as MTV and TLG above 2.5 were assessed using either 42% of SUVmax (MTV42% and TLG42%) or 2.5 (MTV2.5 and TLG2.5) as a cutoff to delineate the volume. Furthermore, BSL and BSV were measured in the same VOI using a background-adapted threshold for each lesion, which was determined in a separate VOI placed over the most active adjacent background activity (e.g., of the lung, thoracic wall, or mediastinum) (Fig. 1).

PET/CT image with 376 MBq of 18F-FDG of a 57-y-old woman with large squamous cell cancer in left lower lobe on maximum-intensity projection (MIP) with central necrosis on axial CT and high 18F-FDG uptake on axial PET (SUVmax, 15.5). In lower row, fused axial PET/CT image with VOI placed around tumor with 3 cutoffs is illustrated, showing that 42% SUVmax–based metrics underestimate volume. However, all measures were above cutoff for high risk according to survival tree analysis. After lobectomy (pT2 pN0 cM0, G2–3, R0), she developed a recurrence after 1.2 y and died after 2.8 y with osseous, pulmonary, and cerebral metastasis.
Statistical Analysis
Interreader agreement is assessed with Bland–Altman agreement analysis and interclass correlation coefficients (ICCs). To facilitate the comparability, we report all PET metrics: ICC values < 0 indicate no agreement, values from 0 to 0.2 are interpreted as slight, 0.21–0.4 as fair, 0.41–0.6 as moderate, 0.61–0.8 as substantial, and 0.81–1 as almost-perfect agreement (21).
In a first descriptive analysis step, all PET-activity-measuring predictors were compared with each other using scatterplots and Pearson correlation coefficients.
In cases in which the assumptions for Cox models were violated when the continuous versions of the predictors were used, we used survival tree models to assess the association between the set of 10 potential predictors and survival or time to recurrence package (22). These models took censoring into account and did not assume a specific form of associations between predictors and hazards (such as proportional hazard); moreover, nonlinear effects or higher-order interactions of predictors were handled automatically. At each node of a survival tree, P-value-adjusted log rank statistics were used to decide which variable split leads for the current patient population to an optimal separation into a lower- and higher-risk groups. The P values were adjusted for multiple testing, and splitting was continued only if further significant splits were found. If a survival tree yielded only 1 significant split of a continuous predictor, this split revealed a data-driven cut point, which separated low- from high-risk patients. We used the Akaike information criterion (AIC) described by Brunham et al. to compare 2 univariate models. To determine the AIC, we used univariate Cox regression models on dichotomized variables with the cut point revealed by the survival tree models. When models had an AIC difference of less than 2, then both models were equally good fitting the data. If the AIC difference was larger than 10, then the model with the larger AIC was not considered further (23).
To get further insight into the nonlinear association between predictors and hazard and to confirm results from survival tree and Cox regression models, we also used a survival random forest model (24). The modeled association between predictors and hazard is illustrated by partial dependency plots. The mortality on the y-axis depicts the expected number of events in the setting of the investigated study; therefore, absolute numbers of the mortality variable should be used to compare the hazard across different predictor values. The ticks at the x-axis depict the position of the observed predictor values and give an impression how well the curve is supported by observed data. A horizontal curve in the partial dependency plot implies that the predictor has no influence on the mortality. If a curve steps from low values to high values, we would use the predictor value at the step position for separating between a lower- and higher-risk group.
Statistical analysis was performed using R software (version 3.1.0) (25).
RESULTS
Our study population consisted of 133 patients, of whom 45 were women and 88 men (age range, 47–91 y; average, 73 y). Sixty-two were diagnosed with squamous cell carcinoma and 71 with adenocarcinoma. Patient characteristics and tumor histology are summarized in Table 1.
Patient Characteristics and Tumor Histology
The mean and median follow-up time for this study was 4.4 y (range, 0.1–10.9 y). Patients who did not die during the study period were followed over at least 2.3 y. Within the study time, 36 patients died from NSCLC or direct complications due to tumor progression. Twenty-six patients died from other causes, among them 6 had evidence of recurrence, whereas 20 were free of diseases. At the end of follow-up, 70 patients were alive, 3 had known recurrence, and 67 were free of disease (mean follow-up time, 5.8 y). Patients who died from NSCLC had a mean recurrence-free time of 1.9 y (mean, 676 d; range, 48–1,923 d) and an average survival time of 4.3 y (1,578 d; range, 34–3,975 d). The distribution of events is illustrated in Figure 2.

Distribution of events and censor times for death of disease (A) and evidence of recurrence (B).
Interreader Agreement in 18F-FDG PET
Interreader agreement is given in Table 2. The SUVmax of the primary tumor yielded similar values for both readers, and accordingly the ICC was high (ICC, 1; P < 0.0001). Also, for 6 investigated volume-based PET metrics, the ICC showed almost-perfect agreement (Table 2). Therefore, for all further analysis only the results of reader 1 were considered. The absolute values for all PET volume metrics are given in Table 3.
Interreader Agreement
PET Metrics
Correlation of 18F-FDG PET Volume Metrics
All pairs of volume-based PET activity metrics showed after log-transformation a strong linear association, which was quantified by the Pearson correlation coefficients between 0.703 and 0.962 (Table 4).
Correlation of PET Metrics
Influence of Different Predictors on Mortality
The dependency plots are given in Figure 3. All volume-based PET metrics yielded similar curves. Up to a certain threshold, the values of the predictors do not influence the hazard; however, above this threshold the hazard increases almost linearly. In the range above the threshold, though, we have only few observations (<20); therefore, the model is not well supported in this range. Nevertheless, this result indicates that the threshold for all PET metrics was higher than the mean or median value.
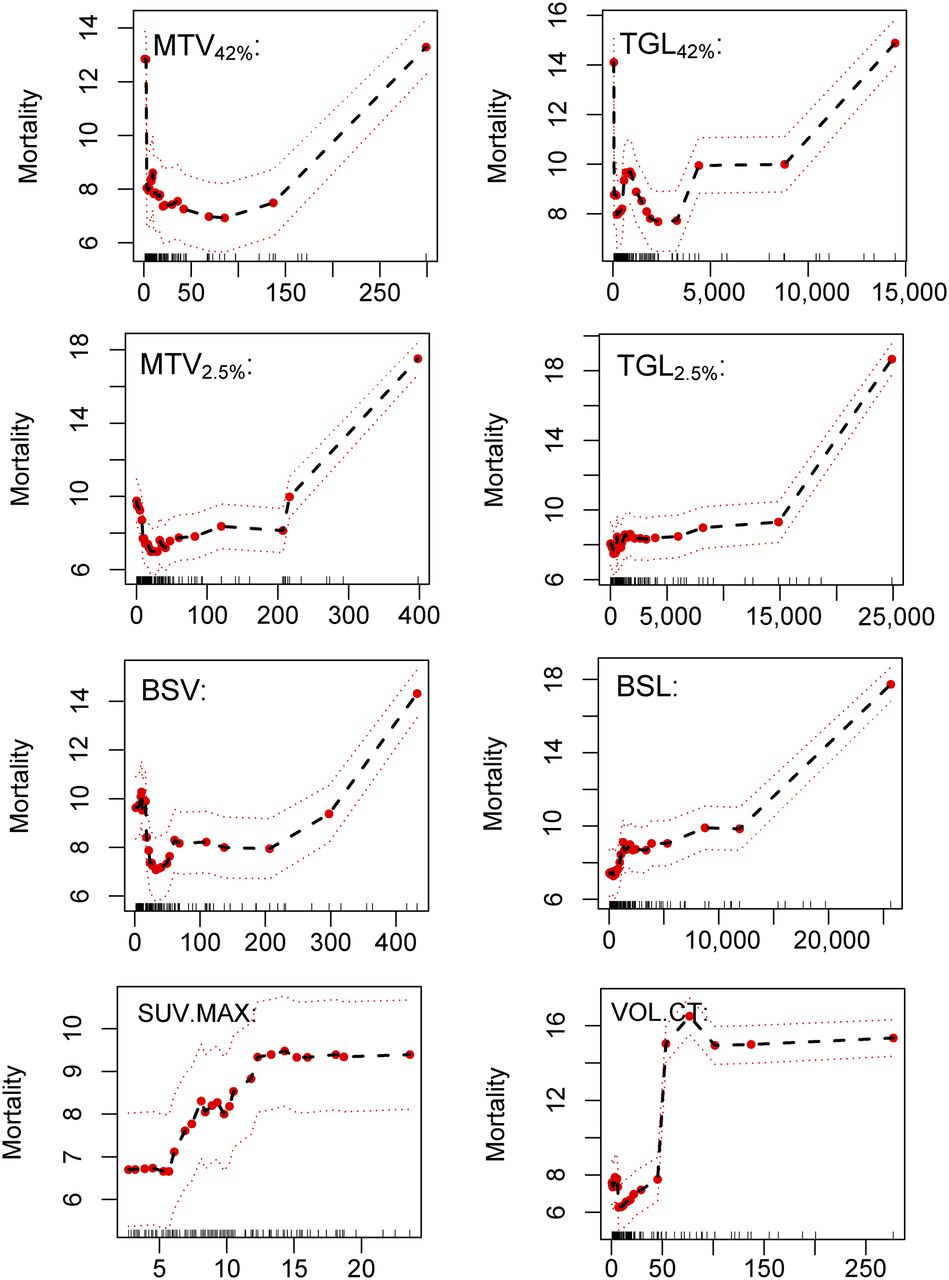
Dependency plots for all volume-based PET metrics to illustrate influence on mortality. Mortality on y-axis depicts expected number of events in setting of investigated study. Hence, absolute numbers of mortality variable can be used to compare hazard across different predictor values. Ticks at x-axis depict position of observed predictor values and give impression of how well curve is supported by observed data. Horizontal curve in partial dependency plot implies that predictor has no influence on mortality. If a curve steps from low values to high values, we can use predictor value at step position for separating between lower- and higher-risk group.
Identification of High-Risk Patients for Survival
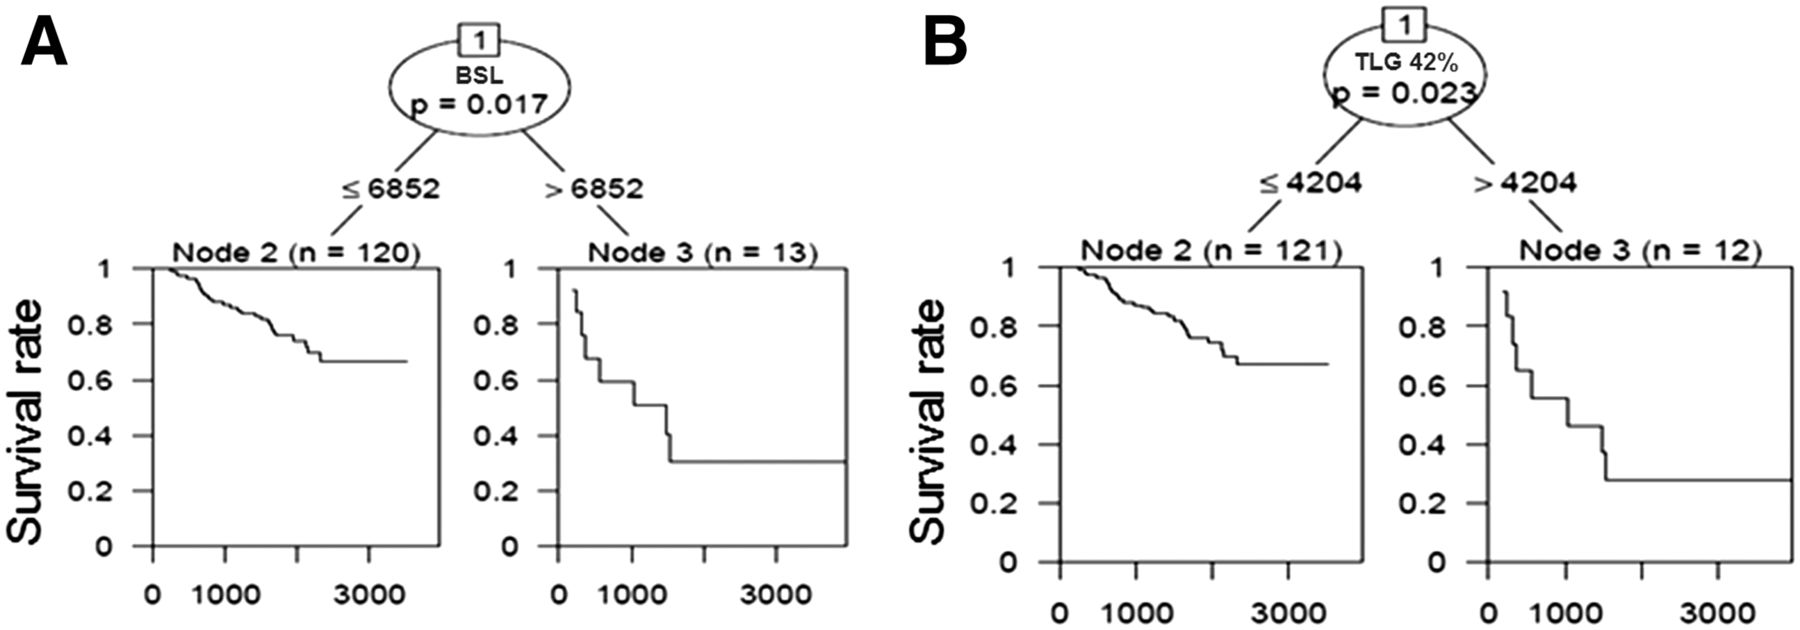
For the survival tree model, we used 10 potential predictors, that is, histology, stage, volume, SUVmax, TLG42%, TLG2.5, MTV42%, MTV2.5, BSL, and BSV. After multiple testing corrections only a BSL greater than 6,852 (P = 0.017) was chosen as a significant split point, assigning patients in a low-risk group (BSL ≤ 6,852, n = 120) and high-risk group (BSL > 6,852, n = 13). No further split became significant in the fitted survival tree. If BSL as a possible variable was removed from the study population, TLG42% was selected with a split point at a TLG42% greater than 4,204 (n = 12) and TLG42% of 4,204 or less (n = 121), with a P of 0.023. The corresponding Kaplan–Meier curve for the split points are given in Figure 4. The high-risk group revealed by a TLG42% was completely included in the high-risk group revealed by BSL. The AIC difference for both univariate models using BSL or TLG42%, respectively, was smaller than 2; therefore, the data do not provide evidence for either event that 1 of the 2 prognostic factors (BSL or TLG42%) was superior (Fig. 1). This was true for both types of events (dead of disease or early recurrence). All 18F-FDG PET metrics yielded similar results at various split points; further results are given in Table 5.

Kaplan–Meier curves for 2 split points according to Cox regression survival tree model showing that patients with high values for PET metrics BSL and TLG42% did significantly worse than patients with values below split point (6,852 for BSL and 4,204 for TLG42%). There was no significant difference for predictive value for either model.
Split Points According to Survival Tree Analysis
DISCUSSION
This study confirms previous reports suggesting an association between increased PET activity and OS as well as PFS for NSCLC (6). Our survival tree analysis showed that volume-based PET metrics were primarily selected to differentiate between low-risk and high-risk patients, confirming previous reports suggesting that TLG and MTV were better predictive values for OS and PFS than SUVmax (26). In our study, BSL and TLG42% showed similar prognostic performance, resulting in the nearly exact same selection of high-risk patients with a large, highly metabolically active tumor burden. We did this study in continuance of a former study with phantoms and 50 patients with lung tumors showing that the BSL correlated better with the total injected 18F-FDG activity than TLG2.5 and TLG42%. The data showed that TLG2.5 and TLG42% have systematic errors: the activities of lesions with a high SUVmax are underestimated by TLG42%, and the activity of lesions with low activity are underestimated by TLG2.5 (11). A second study showed that therapy response assessment was indeed significantly limited by this systematic bias of TLG42% whereas BSL and BSV were able to detect histopathologic response with a significantly higher accuracy (19). In the current study population, however, although BSL was the primary selected node, we could not show a significant improvement of predictability of OS or PFS compared with TLG42%. Given the high correlation of all volume-based PET metrics, this is not surprising and the grouping in high- or low-risk patients was therefore similar for the various PET metrics. This further confirms that 18F-FDG PET is independently predictive for PFS and OS and therefore might be an important factor to be considered for more aggressive adjuvant therapy in early-stage NSCLC.
In the literature, various cutoffs for MTV or TLG have been proposed. The largest cohort, analyzing 529 patients with stage I or II NSCLC, used the median values for MTV (16 cm3) and TLG (70) (26). The assumption that the median value of a cohort actually is the ideal discriminator between high- and low-risk patients is, however, questionable. Kim et al. suggested MTV (11.6 cm3) and TLG (13.8) (27) using receiver-operating-characteristic analysis. However, this method does not take the time to the event “dead of disease” into account. When the partial dependency plots from the survival random forest model are considered, we actually see that a nonlinear relation between risk and all volume-based PET metrics were fitted, with a clear increase for high volumes and activities. This is also reflected by the relatively high split points in our cohort (BSL = 6,852 and TLG42% = 4,024) when working with a single survival tree, suggesting that large tumors with high 18F-FDG uptake on staging PET/CT should be considered high risk and therefore might profit from adjuvant therapy.
In our cohort, MTV2.5 and TLG2.5 yielded 8 (6%) cases in which tumor activity could not be assessed, because the SUVmax was below 2.5 (Fig. 5). However, all of these cases would be in the low-risk category and therefore this limitation would not be as substantial for outcome prediction as it would be for therapy response assessment, if one cannot determine the baseline value. To use the background of the surrounding tissue instead of an absolute or relative cutoff also seems to be a superior approach in other organs with variable background activities, such as the liver (28). First evidence showed more stable results of BSV compared with MTV50% measurements between breath-hold and free-breathing PET. This can be explained by the strong influence of blurring on the SUVmax and consequently the selected threshold, whereas background activity of the liver is less affected by motion, therefore the tumor volume between breath-hold and free-breathing PET scans shows better correlation for BSV than MTV50% (28).

18F-FDG PET/CT with 351 MBq showing solitary pulmonary mass on maximum-intensity projection (MIP), spiculated on axial CT with only minimal 18F-FDG uptake on axial PET (SUVmax, 2.3). Therefore, only PET metrics for MTV42%/TLG42% and BSV/BSL could be measured.
Our study has several limitations. It is a retrospective analysis of patients with bronchial carcinoma stage I or II who underwent surgery after imaging with PET/CT at a single institution. The retrospective setting allows a study with a large population with standardized clinical parameters such as histology, treatment regimen, and a long-lasting follow-up period. However, there are also strong limitations given the heterogeneous time intervals of up to 119 d between imaging and surgery that could have led to a progression of the disease, the heterogeneous postsurgical therapy, and the long period with some heterogeneity also in PET data acquisition such as uptake time, injected dose, or reconstruction algorithms.
Furthermore, some care was necessary in drawing the tumor VOI without including any physiologic increased 18F-FDG accumulation. Furthermore, the determination of the most active background is a further variable influencing the read out. However, because most stage I or II tumors were either surrounded by lung parenchyma or close to the mediastinum, measurement of lung or mediastinal activity was straightforward. Also, the prognostic performance of the dichotomized predictors with the data-driven cut points has not yet been confirmed.
CONCLUSION
Our data confirm that volume-based PET metrics are predictive for both PFS and OS. The ideal cutoff between high- and low-risk patients might not be the median of the respective predictor. In our dataset, volume-based PET metrics including the total activity (BLS and TLG42%) showed the highest prognostic value among 10 potential predictors. The high correlation between readers seems promising for further use of those metrics in clinical settings. However, the cutoffs (BSL > 6,852, TLG42% > 4,204) need to be confirmed. A prospective study with standardized protocols in multiple institutions will be needed to delineate absolute cutoffs that could be used clinically and applied to direct more aggressive therapy in patients with large tumors with high 18F-FDG uptake.
DISCLOSURE
No potential conflict of interest relevant to this article was reported.
Footnotes
↵* Contributed equally to this work.
Published online May 10, 2017.
- © 2017 by the Society of Nuclear Medicine and Molecular Imaging.
REFERENCES
- Received for publication January 20, 2017.
- Accepted for publication April 20, 2017.


Jump to section
Related Articles
Cited By...
- Feasibility, Tolerability, and Preliminary Clinical Response of Fractionated Radiopharmaceutical Therapy with 213Bi-FAPI-46: Pilot Experience in Patients with End-Stage, Progressive Metastatic Tumors
- Relationships between SUVmax of lung adenocarcinoma and different T stages, histological grades and pathological subtypes: a retrospective cohort study in China