


Abstract
We investigated whether motion correction of gated 18F-fluoride PET/CT and PET/MRI of the aortic valve could improve PET quantitation and image quality. Methods: A diffeomorphic, mass-preserving, anatomy-guided registration algorithm was used to align the PET images from 4 cardiac gates, preserving all counts, and apply them to the PET/MRI and PET/CT data of 6 patients with aortic stenosis. Measured signal-to-noise ratios (SNRs) and target-to-background ratios (TBRs) were compared with the standard method of using only the diastolic gate. Results: High-intensity aortic valve 18F-fluoride uptake was observed in all patients. After motion correction, SNR and TBR increased compared with the median diastolic gate (SNR, 51.61 vs. 21.0; TBR, 2.85 vs. 2.22) and the median summed data (SNR, 51.61 vs. 34.10; TBR, 2.85 vs. 1.95) (P = 0.028 for all). Furthermore, noise decreased from 0.105 (median, diastolic) to 0.042 (median, motion-corrected) (P = 0.028). Conclusion: Motion correction of hybrid 18F-fluoride PET markedly improves SNR, resulting in improved image quality.
Aortic stenosis is the commonest form of valve disease in the western world and is set to increase rapidly with an aging population (1,2). Recently, there has been growing interest in the potential role of 18F-fluoride PET for assessing disease activity, predicting disease progression, and serving as an endpoint in clinical trials investigating novel therapies (2,3).
Combined PET/CT and PET/MRI each possess unique attributes suited to the assessment of aortic stenosis. PET/CT provides detailed anatomic information with respect to valve morphology and calcification and may allow for the assessment of calcification in bioprosthetic valves, whereas PET/MRI informs about the hypertrophic response of the left ventricle, myocardial fibrosis, and the transition to heart failure (4).
A major challenge facing PET/CT and PET/MRI of the heart is the impact of cardiac, respiratory, and gross patient movement on PET image quality. Prior 18F-fluoride PET/CT studies have used PET data reconstructed from the end-diastolic phase only (25% of total PET counts) to avoid blurring from cardiac motion, but at the expense of increased image noise (5,6). We have developed a novel software-based method of cardiac motion correction that allows the use of data from the full cardiac cycle, and we recently demonstrated that this method enhances image quality and quantitation in the coronary arteries while reducing noise (7). To our knowledge, this approach has not yet been applied to patients with valvular heart disease or to PET/MRI. In this dual-center study, we used multimodality motion correction in hybrid PET/CT and PET/MRI in a group of patients with aortic stenosis.
MATERIALS AND METHODS
Study Population
PET/CT
Patients with aortic stenosis were recruited prospectively from outpatient clinics at the Edinburgh Heart Centre as part of the ongoing SALTIRE II clinical trial (NCT02132026). The study was approved by the local research ethics committee in accordance with the declaration of Helsinki, and all patients provided written informed consent.
PET/MRI
A 60-y-old asymptomatic man was prospectively recruited as part of an ongoing research study. The study was approved by the institutional review board, and the patient provided written informed consent for use of the data.
Image Acquisition and Analysis
PET/MRI
The PET/MRI protocol involved PET acquisition in list mode for 40–60 min, with concurrent MRI acquisitions to assess the myocardium comprehensively (Biograph mMR; Siemens). These included standard cine views to evaluate left ventricular function, contrast-enhanced MR angiograms acquired in diastole, late gadolinium enhancement to assess midwall fibrosis or infarction (8,9), and a new interleaved sequence (coronary atherosclerosis T1-weighted characterization with integrated anatomical reference, or CATCH) (10). The unenhanced CATCH sequence facilitates acquisition of a dark-blood T1-weighted image in one heartbeat followed by an anatomic bright-blood reference in the next; after reconstruction, a hyperintense signal has been shown to correspond to thrombus or potential intraplaque hemorrhage (10).
For PET/MRI, 212 MBq of 18F-fluoride were injected, and the MR image acquisition began 20 min later. The PET acquisition began 1 h after injection and was performed in list mode for over 60 min. Dixon-based MR images of water and fat were used for attenuation correction with the standard method provided on the scanner.
PET/CT
For PET/CT, 125 MBq of 18F-fluoride were administered intravenously; afterward, the patients rested in a quiet environment. After 60 min, images were acquired using a hybrid PET/CT scanner (Biograph mCT; Siemens). Attenuation-correction CT was performed before acquisition of PET data in list mode using a single 30-min bed position centered on the valve in 3-dimensional mode. Finally, electrocardiography-gated contrast-enhanced CT angiography was performed prospectively in end-expiration. Patients were given 25 mg of oral metoprolol if their resting heart rate was more than 65 beats/min.
For both PET/MRI and PET/CT, PET images were reconstructed using standard iterative ordered-subsets expectation maximization with resolution recovery (11), applying 4 cardiac gates.
Cardiac Motion Correction
Cardiac motion was corrected using an anatomically guided automated registration algorithm, similar to our previously described method (7,12). First, a 3-dimensional sphere was drawn to define the aortic valve region. A nonlinear registration algorithm, radially constrained around the aorta and coronary tree centerlines, was used to align PET images to the diastolic gate. The nonlinear registration algorithm was a diffeomorphic, mass-preserving, anatomy-guided demon method that optimizes the global energy between PET frames, with built-in optimization for anatomic data (13,14). The motion-corrected gates were then summed to form a motion-free image (12) containing all the PET counts. The motion correction procedure required approximately 10 min per patient. PET quantification was performed by delimiting 3-dimensional regions of interest on fused PET/MRI and PET/CT angiograms using FusionQuant software (Cedars-Sinai Medical Center). For each PET/CT subject, rigid registration in the axial, sagittal, and coronal planes was performed between the PET data and the CT angiography data from the most optimal diastolic phase. For the PET/MRI subject, MR angiography was acquired during a single diastolic phase, and this image was similarly fused and manually registered with the PET data. Background blood-pool activity was measured in the right atrium using mean SUVs from 3-dimensional spheric volumes. Maximum uptake in the aortic valve was computed by creating a sphere-shaped volume of interest through the aortic valve after reorientation of the image into the aortic valve plane (6). Signal-to-noise ratio (SNR) (defined as the maximum uptake in the aortic valve divided by the image noise) and target-to-background ratio (TBR) (defined as the maximum uptake in the aortic valve divided by the mean SUV of the blood pool) were computed for the motion-corrected image, summed image, and original diastolic gate. PET image noise was calculated as the SD of the blood pool measurement.
Statistical Analysis
Statistical analyses were performed with SPSS (version 22; IBM). Continuous variables were tested for normality, and nonparametric data are expressed as median followed by interquartile range in brackets, as appropriate. Two-sample t testing or Wilcoxon rank-sum testing was applied to compare groups for continuous variables. A 2-sided P value of less than 0.05 was taken as statistically significant.
RESULTS
Increased 18F-NaF uptake in the aortic valve was observed in all 6 patients (Table 1; Figs. 1 and 2]). After motion correction, there was an increase in SNR and TBR when compared with the diastolic gate (SNR, 51.61 [32.79–61.15] vs. 21.0 [16.37–25.25]; TBR, 2.85 [2.45–3.84] vs. 2.22 [1.94–3.29]) (P = 0.028 for all) and the summed data (SNR, 51.61 [32.79–61.15] vs. 34.10 [24.36–42.54]; TBR, 2.85 [2.45–3.84] vs. 1.95 [1.75–2.66]) (P = 0.028 for all) (Fig. 3). Further, there was a reduction in noise in the motion-corrected image when compared with both the summed data (0.042 [0.037–0.076] vs. 0.052 [0.051–0.104]) and the original diastolic gate (0.042 [0.037–0.076] vs. 0.105 [0.096–0.160]) (P = 0.028 for all) (Fig. 4). On the PET/MR image, detailed cardiovascular MRI investigation of the left ventricle was possible, including measurements of left ventricle mass volume (45 g/m2) and ejection fraction (53%), as well as late gadolinium enhancement imaging. The CATCH sequence was also well tolerated by the patient but did not reveal evidence of T1 hyperintense lesions in either the valve or the coronary arteries.
Patient Characteristics
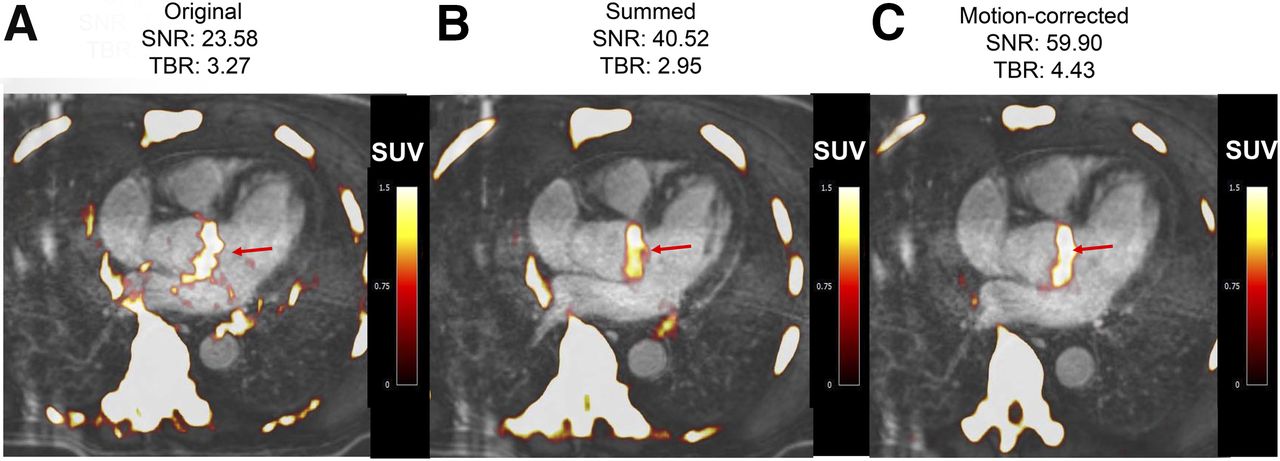
Fused 18F-fluoride PET/contrast-enhanced MR angiograms of aortic valve of 60-y-old man with aortic stenosis. Shown are original diastolic gate (A), summed image (B), and motion-corrected image (C) with focal 18F-fluoride uptake (arrows).

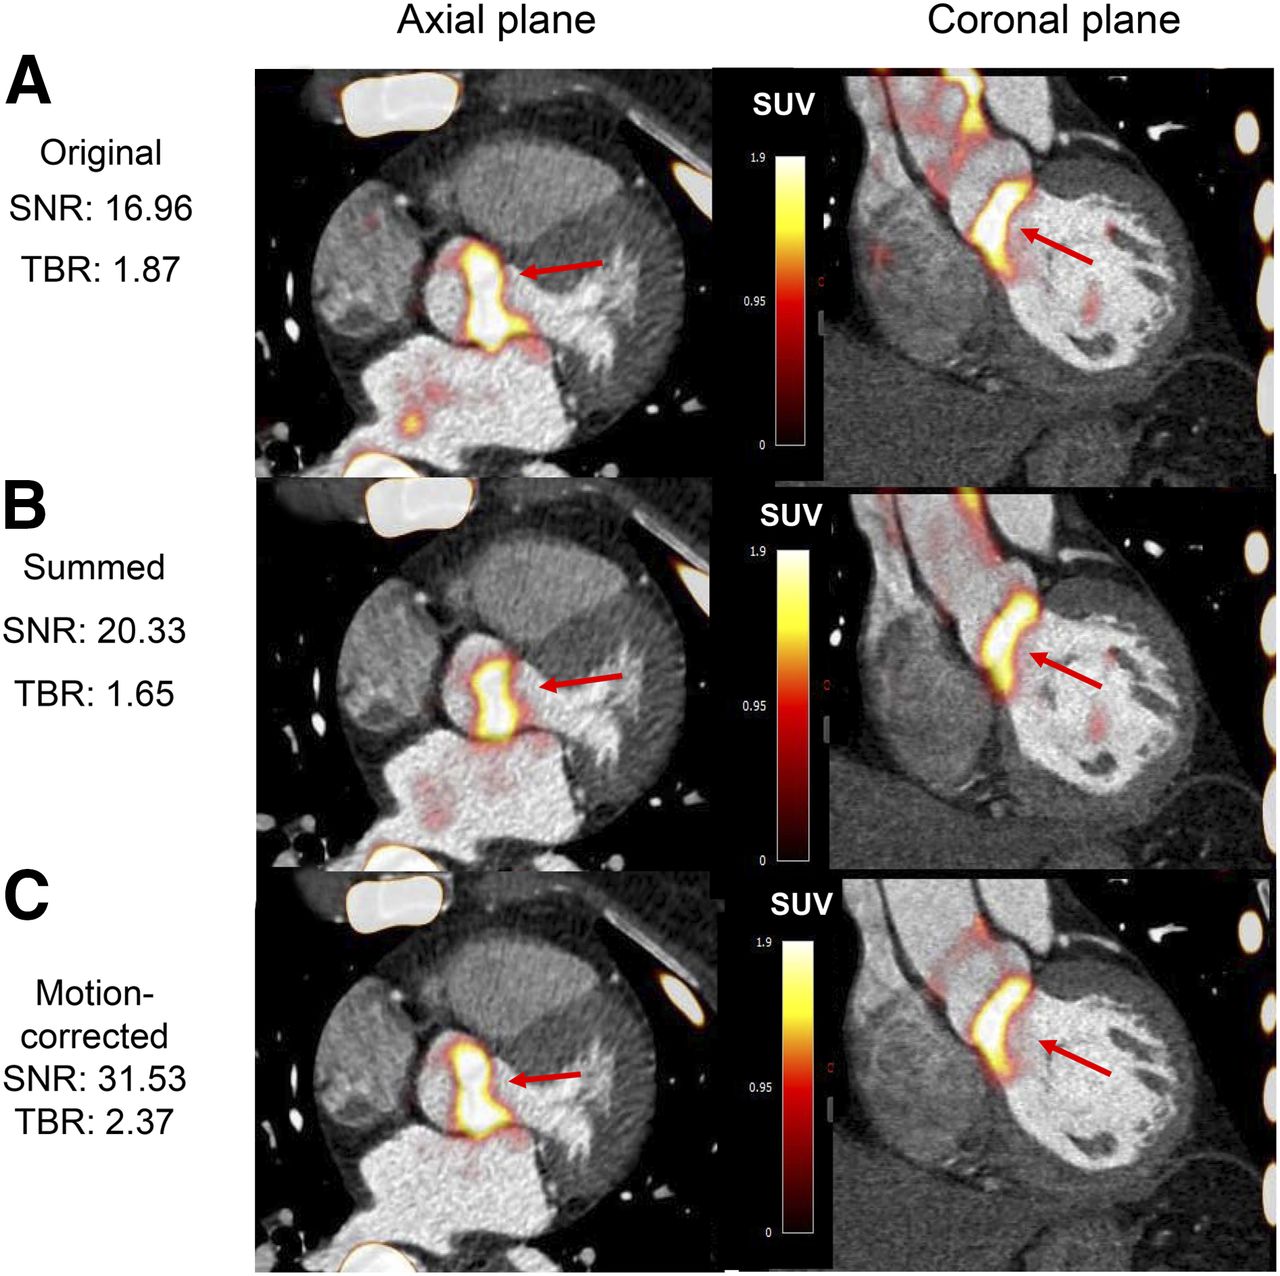
Fused PET/CT angiograms of 79-y-old woman with aortic stenosis. Shown are original diastolic gate (A), summed image (B), and motion-corrected image (C) with focal 18F-fluoride uptake (arrows).
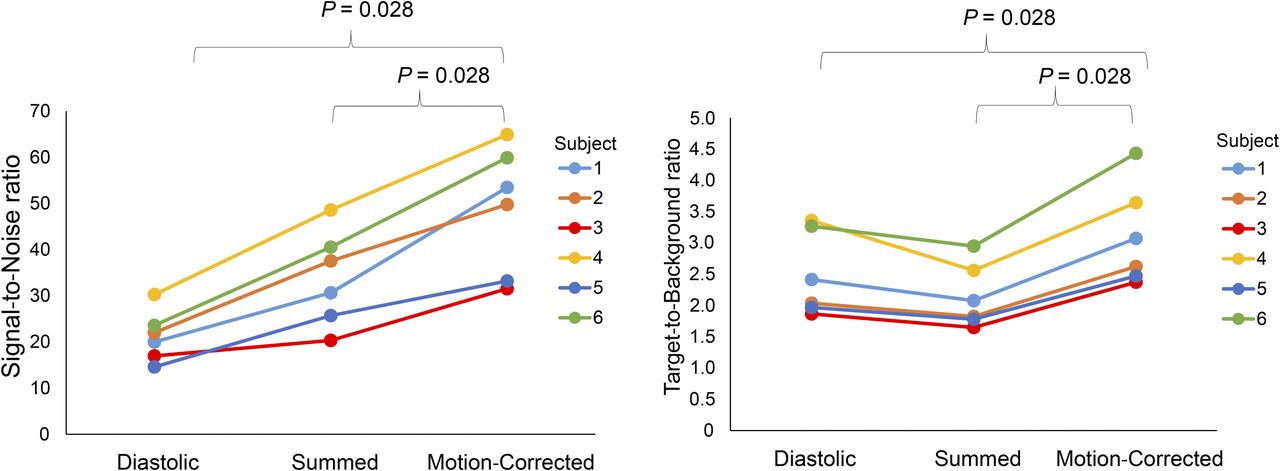
SNRs (left) and TBRs (right) in original gate, summed data, and motion-corrected data.
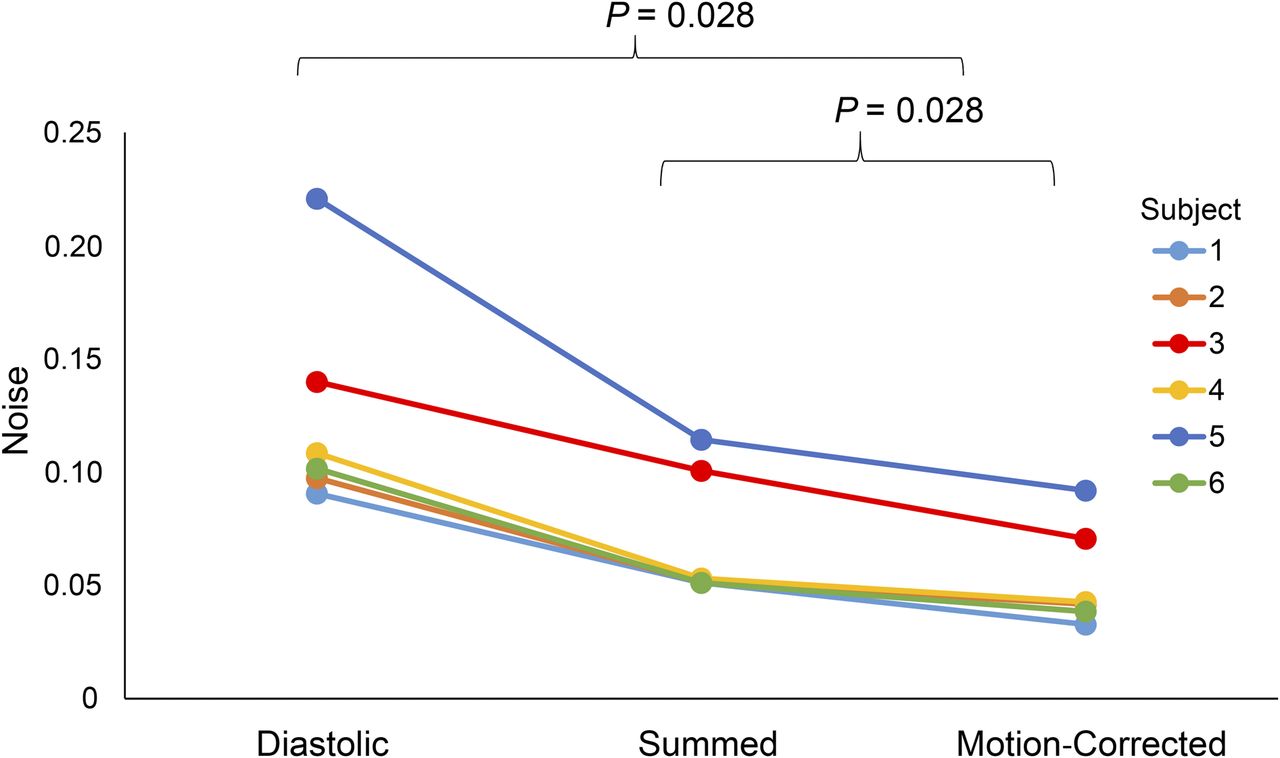
Difference in noise between motion-corrected image, original diastolic gate, and summed image. Although noise was higher in subjects 1 and 3, probably because of increased body weight, same trend was observed.
DISCUSSION
This feasibility study represents the first analysis—to our knowledge—of multimodality cardiac motion correction guided by anatomic data from 18F-fluoride PET/MRI and PET/CT. To our knowledge, it also represents the first demonstration of hybrid PET/MRI in aortic stenosis, which allows simultaneous imaging of calcification activity in the aortic valve using 18F-fluoride PET alongside the detailed myocardial assessments provided by MRI.
In the future, this sophisticated imaging method has great clinical potential for assessing native aortic valve disease alongside markers of myocardial decompensation such as midwall late gadolinium enhancement (8) and T1 mapping (15,16). However, a limitation of PET/MRI is the inability to accurately assess prosthetic valve disease because of the influence of metal artifacts on PET attenuation and MR image quality. With the increasing use of transcatheter aortic valve replacement, PET/CT is likely to play an important role in the assessment of aortic valve bioprostheses. Indeed, the role of 18F-fluoride PET/CT in assessing the longevity of transcatheter aortic valve replacement valves is currently under investigation (NCT02304276). Here, we have described how these imaging techniques may be optimized with motion correction of the aortic valve to maximize the research and clinical potential of hybrid cardiac imaging.
Our study was limited by the fact that we had data from only a few patients. Although these data were sufficient to demonstrate the clear improvements in SNR and TBR offered by motion correction techniques, larger studies are required for confirmation.
CONCLUSION
Motion-corrected simultaneous imaging of the aortic valve is feasible both with hybrid 18F-fluoride PET/MRI and with hybrid 18F-fluoride PET/CT. Motion correction using a diffeomorphic mass-preserving image registration algorithm improved quantitative SNR and TBR while significantly reducing image noise.
DISCLOSURE
The study was supported by a grant (“Cardiac Imaging Research Initiative”) from the Adelson Medical Research Foundation. The study was also funded by the British Heart Foundation (FS/14/78/31020; RG/16/10/32375) and by the Chief Scientist Office of Scotland (ETM/160). David Newby (CH/09/002) and Marc Dweck (FS/14/78) are supported by the British Heart Foundation. David Newby is also the recipient of a Wellcome Trust Senior Investigator Award (WT103782AIA). No other potential conflict of interest relevant to this article was reported.
Footnotes
↵* Contributed equally to this work.
Published online May 25, 2017.
- © 2017 by the Society of Nuclear Medicine and Molecular Imaging.
REFERENCES
- Received for publication April 6, 2017.
- Accepted for publication May 17, 2017.


Jump to section
Related Articles
Cited By...
- Lipoprotein(a) has no major impact on calcification activity in patients with mild to moderate aortic valve stenosis
- Summary of the First ISMRM-SNMMI Workshop on PET/MRI: Applications and Limitations
- Sodium Fluoride PET and Aortic Bioprosthetic Valve Degeneration: Implications for Patient Diagnosis, Management, and Treatment