


Abstract
Cerenkov luminescence imaging can image radiopharmaceuticals using a high-sensitivity charge-coupled device camera. However, Cerenkov luminescence emitted from the radiopharmaceuticals is weak and has low penetration depth in biologic tissues, which severely limits the sensitivity and accuracy of Cerenkov luminescence imaging. This study presents 3-dimensional (3D) radiopharmaceutical-excited fluorescence tomography (REFT) using europium oxide (EO) nanoparticles, which enhances the Cerenkov luminescence signal intensity, improves the penetration depth, and obtains more accurate 3D distribution of radiopharmaceuticals. Methods: The enhanced optical signals of various radiopharmaceuticals (including Na131I, 18F-FDG, 68GaCl3, Na99mTcO4) by EO nanoparticles were detected in vitro. The location and 3D distribution of the radiopharmaceuticals of REFT were then reconstructed and compared with those of Cerenkov luminescence tomography through the experiments with the phantom, artificial source–implanted mouse models, and mice bearing hepatocellular carcinomas. Results: The mixture of 68GaCl3 and EO nanoparticles possessed the strongest optical signals compared with the other mixtures. The in vitro phantom and implanted mouse studies showed that REFT revealed more accurate 3D distribution of 68GaCl3. REFT can detect more tumors than small-animal PET in hepatocellular carcinoma–bearing mice and achieved more accurate 3D distribution information than Cerenkov luminescence tomography. Conclusion: REFT with EO nanoparticles significantly improves accuracy of localization of radiopharmaceuticals and can precisely localize the tumor in vivo.
- radiopharmaceutical excitation fluorescence tomography (REFT)
- Cerenkov luminescence imaging (CLI)
- radionuclides
- hepatocellular carcinoma (HCC)
- PET
Cerenkov luminescence imaging (CLI) provides a convenient approach to image the in vivo distribution of radiopharmaceuticals using optical instruments. It has attracted much attention and been widely applied in animal imaging (1–9). Compared with PET or SPECT, CLI has several distinctive advantages, such as high throughput, cost savings, and the ability of imaging therapeutic pure β-emitters. Recently, the thyroid gland of a patient treated orally with Na131I was successfully imaged with CLI (10). The patient’s lymphatic nodes in the axillary region were also visualized with CLI by injection of 18F-FDG (11). However, the emission of Cerenkov radiance dominantly distributed in the blue-violet light region (300–500 nm), which resulted in great absorption in biologic tissues and low penetration depth (2,8). These severely limit the broad applications and potential clinical translation ability of CLI. To resolve these problems, researchers have tried to design new instruments (11–13) and explore creative ways to transfer or enhance the Cerenkov signal for better detection (14–16). Liu et al. developed a Cerenkov luminescence endoscopy system, which has the potential to image abnormalities inside the human body (11). On the other hand, Cerenkov radiance energy transfer has demonstrated that Cerenkov radiance can excite a variety of fluorophores such as quantum dots to emit light with longer wave lengths (14–16). More importantly, Thorek et al. showed that the secondary Cerenkov-induced fluorescence imaging effectively reduced the optical signal of the nontarget tissues and improved the target-to-background tissue ratios (17).
CLI is the 2-dimensional planar imaging modality that simply provides the qualitative information and reflects only whether there are luminescent signals in the target of interest. Three-dimensional (3D) Cerenkov luminescence tomography (CLT) provides more information, such as the specific location of the lesion, depth, and size (18–23), which is important for diagnosis and treatment of disease. However, the reconstruction of CLT is usually not very accurate (18–23); this imprecision is caused by the following 3 elements: the inaccuracy of the photon transport model and reconstruction algorithm; the limitation of the surface luminescent signal detected using a charge-coupled device camera with much random noise and weak intensity; and the deviation from data processing, such as the registration and segmentation.
In this study, 3D radiopharmaceutical-excited fluorescence (REF) tomography (REFT) has been developed to improve the reconstruction of CLT. REFT has been explored using our previous work on the radiopharmaceutical-excited fluorescence imaging (REFI) technique, which can dramatically enhance the signal intensity using the dual excitation of nanoparticles by both γ-rays and Cerenkov luminescence (CL) (24). When the anatomic information provided by CT is combined, REFT can realize 3D visualization and distribution information and improve the CLT reconstruction by increasing the intensity and signal-to-noise ratio of the surface fluorescent signal. Specifically, in this study, the enhancement of the optical signal of a variety of radiopharmaceuticals by europium oxide (EO) nanoparticles was tested. REFT for phantoms, artificial source–implantation mouse models, and tumor xenograft mouse models was conducted and compared with CLT. Furthermore, the performance of REFT in tumor detection was evaluated through the comparison with CLT and small-animal PET.
MATERIALS AND METHODS
Preparation of Radiopharmaceuticals and EO Nanoparticles
Radiopharmaceuticals including Na131I, 18F-FDG, 68GaCl3, and Na99mTcO4 for this study were obtained from the Department of Nuclear Medicine, Xijing Hospital, the Fourth Military Medical University (FMMU). The EO nanoparticle (Eu2O3, 99.9% metal basis, molecular weight = 351.91) was purchased from Aladdin Reagents (Shanghai) Co. Ltd. and used as previously described (24). The excitation spectrum and emission spectrum of EO nanoparticles were recorded with a fluorescence spectrophotometer (F-4500; Hitachi).
In Vitro Optical Imaging of Radiopharmaceuticals and EO Nanoparticles
In the first experiment, EO nanoparticles (100 μL, 2 mg/mL) were added into the wells of the black 96-well plates and the optical images were acquired without any excitation. In the second experiment, Na131I, 18F-FDG, 68GaCl3, or Na99mTcO4 (0.37 MBq in 50 μL) alone or mixed with 50 μL (2 mg/mL) of EO nanoparticles, respectively, was added into the wells of the black 96-well plates. In the third experiment, 18F-FDG (0.37 MBq in 100 μL) and the mixture of 18F-FDG (0.37 or 0.74 MBq in 50 μL) and EO nanoparticles (50 μL, 2 mg/mL) were added into the wells of the black 96-well plates. All optical images were acquired with IVIS Kinetic imaging system (PerkinElmer). For all the experiments, images were acquired with an 8 × 8 binning, aperture fnum of 1, and 1-min exposure time for in vitro imaging and 5 min for in vivo imaging. No filter was used, and net photon production was collected to compare the intensities of CL and radiopharmaceutical-excited fluorescence (radiofluorescence). Regions of interest of the corresponding areas were drawn over the optical images of the optical sources, and the average radiances were calculated by the Living Image 3.2 software (PerkinElmer), which provided the quantification information such as intensities of the optical signals.
Optical Imaging of EO Nanoparticles Excited by 68GaCl3
First, CLI for 100 μL of 68GaCl3 with various activities (0.046, 0.093, 0.185, 0.37, and 0.74 MBq) was performed. Second, REFI of 50 μL of EO (20 mg/mL) excited by 50 μL of 68GaCl3 with various activities (0.046, 0.093, 0.185, 0.37, and 0.74 MBq) was carried. Third, REFI for 0.37 MBq of 68GaCl3 in 50 μL mixed with 50 μL of EO with various concentrations (2.5, 5, 10, 20, and 40 mg/mL) was studied.
Phantom Imaging for CLT and REFT Comparison
Ex Vivo Phantom Experiment
Cubic phantoms were used to mimic the biologic tissue in an ex vivo phantom study. The phantom was made from polyethylene and had sides 40 mm long. The refractive index of the phantom was 1.5. Circular holes with a diameter of 2.3 mm and various depths from the top surface of the phantom were drilled to place 68GaCl3 or the mixture of 68GaCl3 and EO. The 5 phantoms containing 0.185 MBq of 68GaCl3 (5 μL) at the bottom of the holes were used for CLT experiments. The mixture of 0.185 MBq of 68GaCl3 (5 μL) and 1 mg of EO was used for REFT experiments. The depths of the sources were 1, 2, 5, 7, and 8 mm. The heights of the cylindric solution were 2 mm.
In Vivo Phantom Experiment
To investigate the performance of REFT in the real biologic application, an artificial source–implantation study on living animals was performed. All animals were obtained from the Laboratory Animal Center of the FMMU, and all animal studies were conducted in compliance with the FMMU Animal Studies Committee (protocol 20090260). 68GaCl3 (3.7 MBq, 5 μL) was mixed with 20 μL of EO (100 mg/mL) in a microfuge tube. Anesthetized male athymic BALB/c mice (n = 9) between the age of 6 and 7 wk underwent aseptic celiotomy and were implanted with the microfuge tubes at different positions in the abdominal cavity. The embedded artificial sources were positioned close to the ventral surface of the abdomen, the lesser curvature of the stomach, and the dorsal surface of the abdomen of the mice, respectively (n = 3 for each position). Similarly, the mice (n = 9) were implanted with sources containing only 68GaCl3 (3.7 MBq, 5 μL) as the control group. After implantation, mice immediately underwent REFT and CLT.
Orthotopic and Ectopic Xenografts of Hepatocellular Carcinoma (HCC) Tumor
The well-differentiated luciferase-labeled human HCC cell line HepG2-Red-Fluc (BW134280; PerkinElmer) was used to construct tumor models. Male athymic BALB/c nude mice (n = 4) between the ages of 6 and 7 wk were injected with 5 × 10⁶ HCC cells dispensed in 30 μL of Matrigel (Corning) into the liver lobes and the peritoneum. All of the mice developed tumors. Two weeks later, the HCC tumor–bearing mice were subjected to in vivo imaging studies.
CT Imaging
Our previously developed small-animal CT system was used to provide structural information for optical source reconstruction in imaging of phantoms and xenografts (18). The scanner operated at 55 kVp and 145 μA. For in vivo imaging of mouse models, mice were fixed on a holder and anesthetized by inhalation of a 1%–2% isoflurane–oxygen mixture. No contrast agent was used.
Ex Vivo and In Vivo REFT Imaging
In ex vivo phantom imaging experiments, CLI and REF images were acquired, and then the phantoms underwent CT scans as described above. The images were registered to segmented CT volumes of the cubic phantoms, and optical source reconstruction was performed.
In in vivo phantom imaging, mice were anesthetized by inhalation of a 1%–2% isoflurane–oxygen mixture and fixed on a holder. Cerenkov luminescence and REF images were acquired, followed by CT scans. The images were registered to segmented CT volumes of the mice, and optical source reconstruction was performed.
In xenograft imaging experiments, mice bearing HCC tumors were fasted overnight before the intravenous injection of 18F-FDG (2.22 MBq, 0.1 mL). CLI and PET scans (using a GENISYS4 scanner; Sofie Biosciences) were obtained. Ten-minute static scan mode was used. Then the mice were injected with EO nanoparticles (0.1 mL, 1 mg/mL) intravenously, and REF images were acquired. After CLI, PET scanning, and REFI, the mice underwent CT scanning.
REFT Source Reconstruction Method
To reconstruct the 3D distribution of the radiofluorescence, the Cerenkov radiation spectral characteristic-based source reconstruction method was used in the REFT (22).
On the basis of this method, the relationship between the radiofluorescence source and surface flux density can be established as follows: Eq. 1where
  is the system matrix for the j-th level mesh, which is related to the estimated optical properties;
  denotes the radiofluorescence distribution located in the permissible source region that is determined by a priori knowledge; and
  represents the nodal flux density on the mouse surface obtained without any filters.
It is difficult to solve Equation 1 directly because of the ill-posed nature of the internal source reconstruction. The classic conjugate gradient least-squares technique can be used to solve Equation 1. The following optimization problem is defined to determine the 3D radiofluorescence distribution: Eq. 2where
  and
and  are the lower and upper bounds of the radiofluorescence power density, respectively, and
  represents the regularization parameter.
  denotes the weight matrix and satisfies
  .
.
Statistical Analysis
Data are expressed as mean ± SD. Statistical significance was determined using the Student t test (version 6.0; GraphPad Prism Software). Linear regression was determined using Origin software for Windows (version 8.0; Origin Pro Software). Differences between groups were considered significant if the P value was 0.05 or less.
RESULTS
Excitation Spectrum and Emission Spectrum of EO Nanoparticles
The excitation spectrum is shown in Supplemental Figure 1A (supplemental materials are available at http://jnm.snmjournals.org). There were multiple characteristic absorption peaks at 363, 382, 394, 466, and 535 nm. The peak of emission spectrum of EO nanoparticles was 613 nm (Supplemental Fig. 1B).
EO Emitted Highest Radiofluorescence When Excited by 68GaCl3
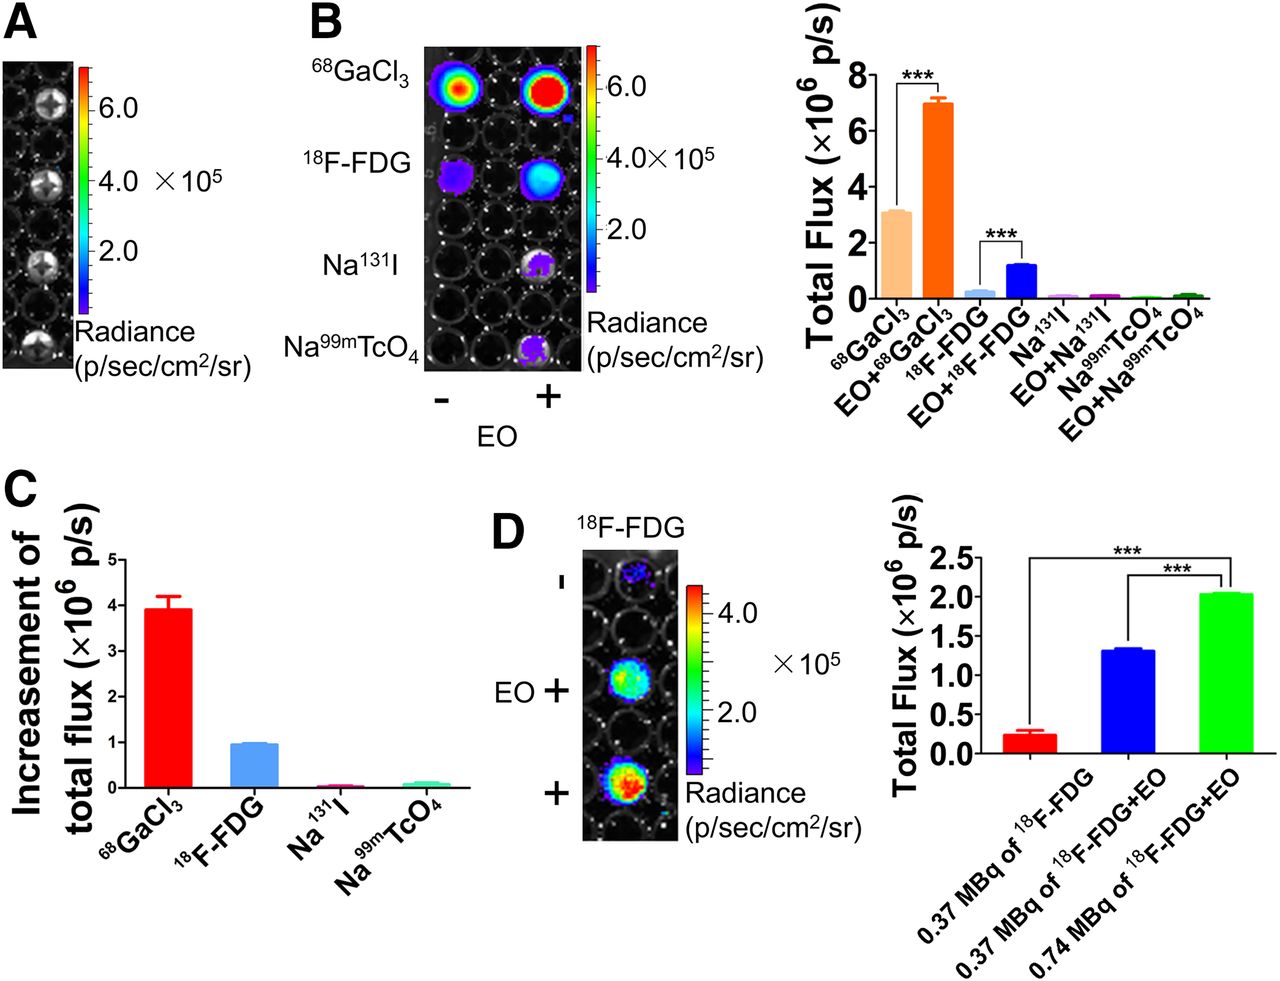
There was not any light of EO nanoparticles without excitation (Fig. 1A). The optical signal intensities dramatically increased after the radiopharmaceuticals were mixed with EO nanoparticles, and the mixture of 68GaCl3 and EO nanoparticles possessed the strongest optical intensity (Fig. 1B). The increased optical signal intensity of the mixture of 68GaCl3 and EO nanoparticles was the maximum compared with other mixtures (Fig. 1C). Compared with the CL signal of 18F-FDG, the REF signal of the mixture of 18F-FDG and EO nanoparticles was obviously enhanced (Fig. 1D).

CLI of radiopharmaceuticals and REFI of mixture of radiopharmaceuticals and EO nanoparticles. (A) Optical image of EO nanoparticles. (B) CL images of radiopharmaceuticals, including Na99mTcO4, 68GaCl3, 18F-FDG, and Na131I, and REF image of mixture of EO nanoparticles and radiopharmaceuticals (left). Quantification analysis of CL signal and REF signal (right). Open field was used for collecting all light. (C) Quantification analysis of optical signal intensity, which was obtained through subtraction of Cerenkov luminescent intensity from optical signal intensity of mixture of radiopharmaceutical and EO nanoparticles. (D) CLI of 18F-FDG and REFI of mixture of 18F-FDG and EO nanoparticles (left) and quantification analysis (right).
Optical Signal Intensity of REFI Increased with Radioactivity of 68GaCl3 and Concentration of EO Nanoparticles
The REF signal increased with radioactivity of 68GaCl3 and concentration of EO (Supplemental Fig. 2A). The quantification relationship between REF intensity and radioactivity and concentration of EO is shown in Supplemental Figures 2B and 2C, respectively. The excited REF signal intensity linearly correlated with radioactivity of 68GaCl3 (y = 1.5e7 +1.9e6 ×, R2 = 0.96) and the concentration of EO (y = 1.86e6 +9.96e5 ×, R2 = 0.98), respectively.
REFT Improved Accuracy of Reconstruction Results
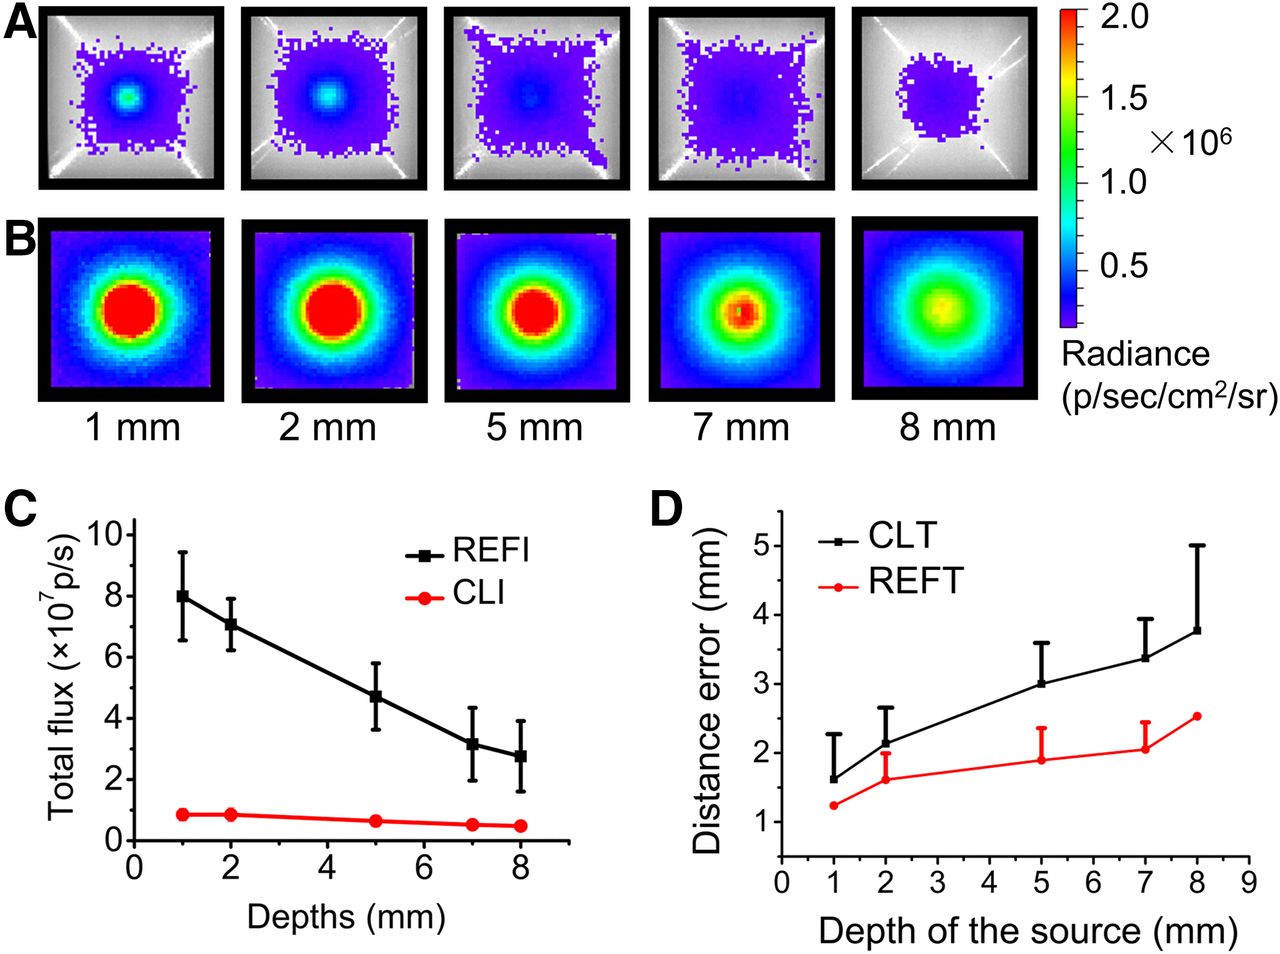
The total flux of signal of 68GaCl3 penetrated through 1 mm of phantom material was 6.55 × 10⁶ photons/s. It decreased to 4.38 × 10⁶ photons/s through 5 mm (Fig. 2A). However, the total signal of EO excited by 68GaCl3 was much more intense than the CL signal of 68GaCl3, and the signal of EO mixed with 68GaCl3 was 6.53 × 10⁷ photons/s through 1 mm and decreased to 3.79 × 10⁷ photons/s (8.65 times that of 68GaCl3) through 5 mm (Fig. 2B). REF signals were significantly higher than CL (P < 0.05) (Fig. 2C). Although the reconstructed distance error (DE) increased with the increase of the source depth, which was observed both in CLT and in REFT, the reconstruction results of REFT were more accurate than those of CLT (Fig. 2D). For example, the reconstructed position of EO excited by 68GaCl3 was 1.89 mm away from the actual position in depth of 5 mm, but it was 2.62 mm for 68GaCl3 alone.

CLI and REFI of phantoms. (A) Cerenkov luminescence images of phantoms injected with 68Ga with radioactivity of 0.185 MBq. Depths of sources were 1, 2, 5, 7, and 8 mm. (B) Radioluminescent images of 1 mg of EO excited by 68Ga with radioactivity of 0.185 MBq. (C) Quantification comparison results of REFI and CLI. (D) Comparison of 3D reconstruction DEs of CLT and REFT.
Comparison of CLT and REFT on Artificial Source–Implanted Mouse
The radionuclide source with or without EO was implanted with different depths in the mouse separately, followed by REFI (Fig. 3A, left) and CLI (Fig. 3A, right) detection. The first row of the implanted source was only 0.77 mm to the ventral surface of the mice, the second was closed to the lesser curvature and 6.11 mm to the ventral surface, and the third was close to the dorsal surface and 13.47 mm to the dorsal surface (Fig. 3A). Figure 3B shows the comparison of reconstruction results of REFT (left) and CLT (right) of the implanted sources. Obviously the reconstructed DE increased with the source depth. When the depth of the implanted source was 0.77 mm, the reconstructed DE of CLT and REFT was 1.84 and 1.35 mm, respectively. When the implanted source depth was 13.47 mm, DE of CLT and REFT was 7.85 and 2.85 mm, respectively. Furthermore, for the different source depths, all the results of REFT were more accurate than that of CLT. Figure 3C further shows the relationship between the reconstructed DE of REFT or CLT and the depth of the implanted source. Again the reconstructed DE increased with the depth. More importantly, the reconstructed DE of REFT was less than that of CLT, indicating that REFT can localize the implanted source more accurately than CLT.
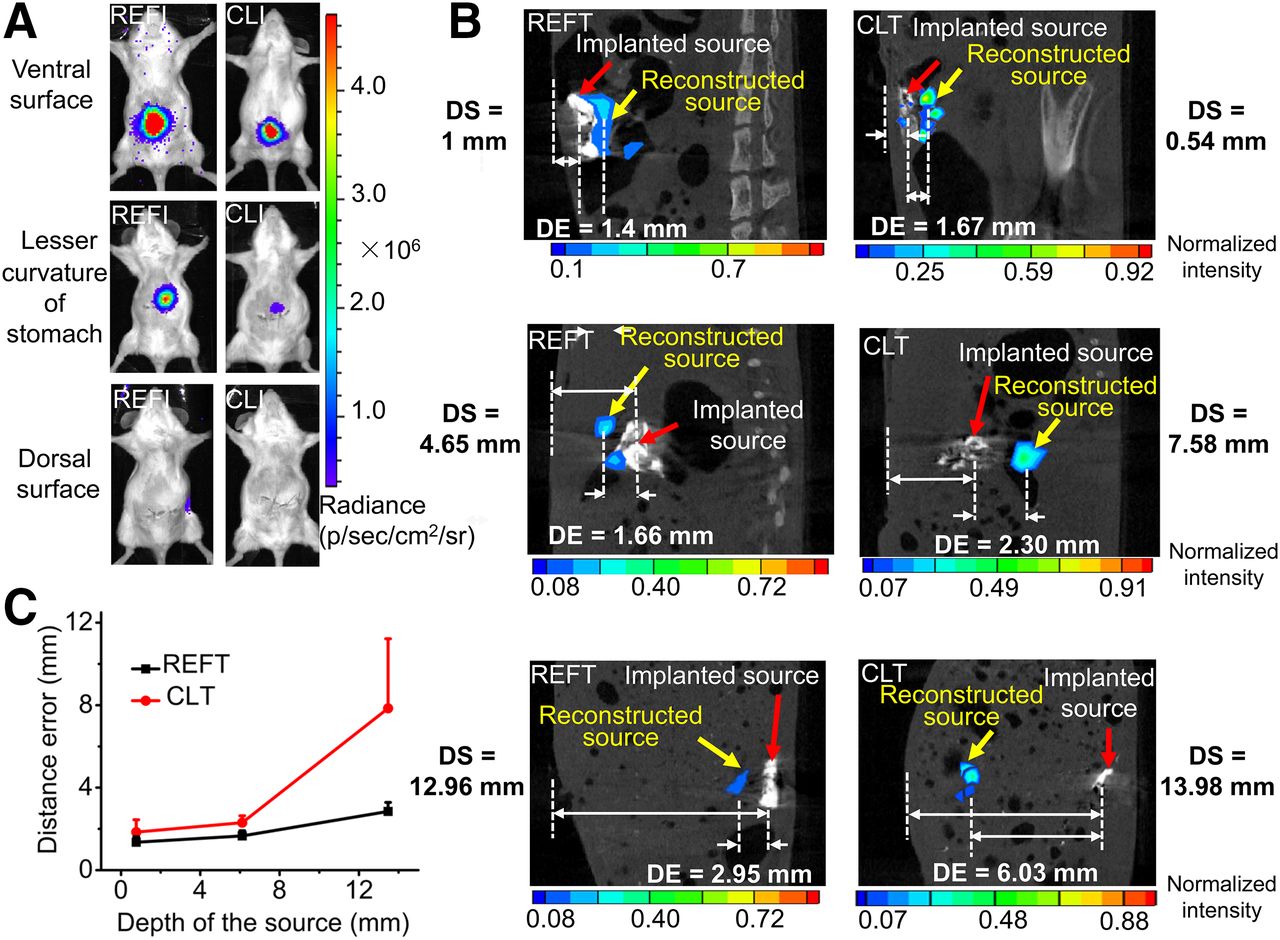
REFT and CLT of artificial source–implantation mouse models. (A) REFI (left) and CLI (right) of mice implanted with artificial sources. Position of implanted source was close to ventral surface of abdomen (first row), lesser curvature of stomach (second row), and dorsal surface of abdomen of mouse (third row). (B) Comparison of reconstruction results of REFT and CLT. DE = reconstructed distance error, which is defined as distance from real source position to reconstructed source position; DS = source depth from real source position to surface of mouse body. (C) Relationship between DE of REFT or CLT and depth of implanted sources.
REFT of Mice Bearing HCC Tumors
Interestingly in the experiment, PET imaging delineated only a tumor in the abdomen (red arrow in Fig. 4A). CLI of the same mouse showed that there were more optical signals in several locations. It detected 3 tumors (red arrows in Fig. 4B) especially in the lower abdomen, but CL of the upper 2 tumors was almost too weak to be detected. Three tumors were also detected by REFI (Fig. 4C), and REFT delineated the 3D positions of the tumors more clearly (Fig. 4D). Figure 4E further displayed the axial, coronal, and sagittal image of the tumor presented in the lower abdomen region (yellow arrows). The distribution of 18F-FDG uptake in the tumor was clearly visualized. After imaging, the mouse was dissected, and the photograph of the 3 tumors during the operation on the mouse is shown in Figure 4F. The locations of the tumors were consistent with the findings as revealed by REFT, as indicated by the yellow arrows. All 3 dissected tumors were confirmed with hematoxylin and eosin (Fig. 4G). This study showed that REFT provided 3D visualization, which not only clearly detected more tumors but also localized the tumors more accurately.
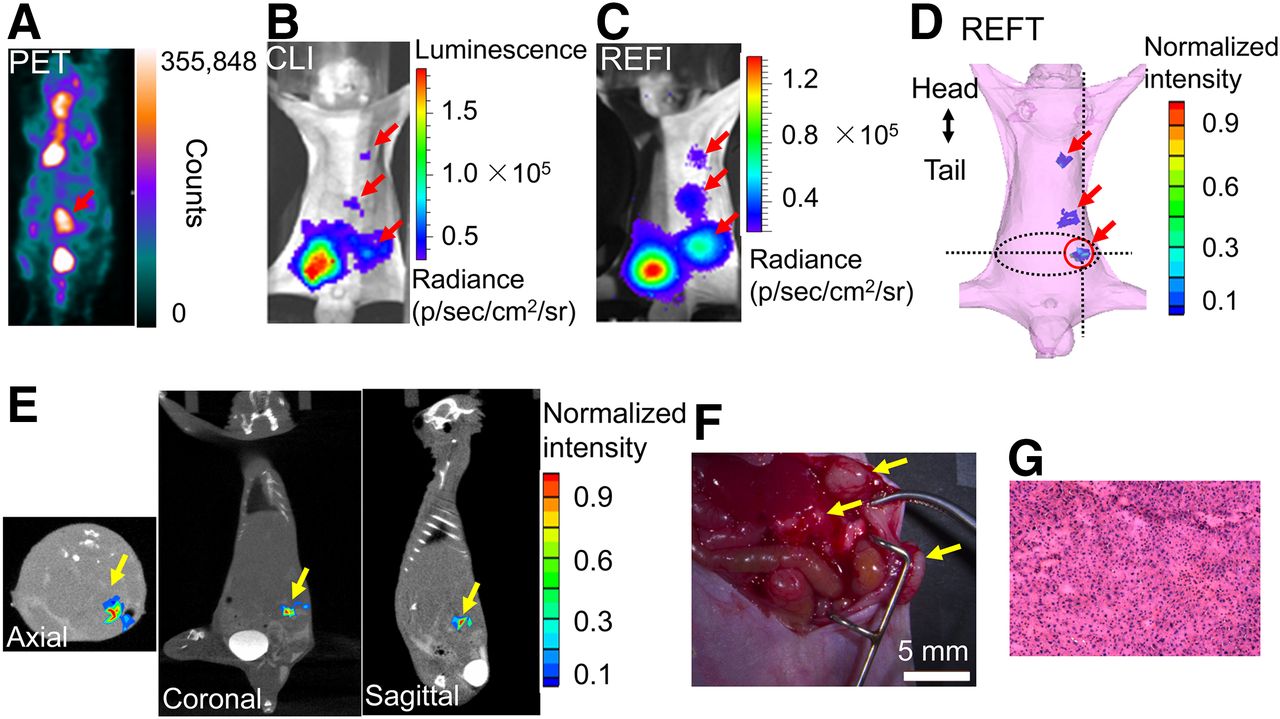
Small-animal PET, CLI, REFI, and REFT of mouse bearing HCC tumors. (A–D) Small-animal PET, CLI, REFI, and REFT of same mouse. (E) Axial, coronal, and sagittal view of reconstructed results of REFT. (F) Photograph of 3 tumors during operation on mouse (arrows). (G) Hematoxylin and eosin results of tumors.
In the experiment, 4 orthotropic and ectopic HCC tumor–bearing mice were used to perform REFT and PET. The comparison of detection rates was also listed in the Table 1. The experimental results showed that REFT detected significantly more tumors than PET (detection rate, 88.75% ± 13.15% vs. 42.08% ± 15.84%, P < 0.05).
Comparison of Detection Rates of REFT and PET
DISCUSSION
This study presents a 3D REFT imaging technique for in vivo imaging of tumor mice. The most important advantages of REFT include that it can obtain 3D visualization information of tumors with a small deviation of reconstructed location, it can more clearly and easily detect tumors than other methods such as CLT, and it has strong capability in reconstructing the deeper source in living animals. In the phantom and the implanted-mice experiment, we found that REF can penetrate more than 12 mm in the real biologic tissues (Fig. 3). REFT shows high potential of imaging deep tumors. Furthermore, from 1 to 13 mm of the light source, REFT results are more accurate and robust than CLT, as shown in Figures 2D and 3C. Although the DE of REFT or CLT increases with increasing source depth, in the 12-mm case the reconstruction error of REFT is only about 3 mm, which is much smaller than the reconstruction error of CLT with 8 mm. The significantly improved reconstruction results of REFT are likely due to the following reasons. The greater tissue attenuation of the lower wavelength spectrum generated by Cerenkov photon results in the higher background noise than the narrow peak from the nanoparticle (hence greater penetration). On the other hand, the signal intensity of REFT is stronger than that of CLT because of the energy transfer from the γ-rays and Cerenkov light. Therefore, the signal-to-noise ratio of REFT is higher than that of CLT.
CLT reconstruction with multispectral images is time consuming, and accurate reconstruction results with little time cost have been successfully achieved in this study. This accurate reconstruction is mainly attributed to the improvement of the ill-posed problem of source reconstruction using a greater number of surface measurement data with less random noise and more strong optical signals. Moreover, the classic conjugate gradient least-squares technique has been used in our current work to reconstruct the sources (22). In the axial image in Figure 4E, there appears to be 2 lesions. The weak signal shown in the right side of the lesion could be a small metastasis that was not delineated by CLI and REFI. This could open new opportunities for using REFT for imaging ultra-small lesions and is worthy of further investigations.
The phantom experiment and artificial source–implanted mouse using REFT have clearly proven the reliability and accuracy of REFT. We further conducted the imaging study of orthotropic and ectopic HCC tumor–bearing mice. The small-animal PET detected only 1 tumor in the mouse abdomen. CLI detected 3 tumors (indicated by red arrows in Fig. 4B). However, CL of the upper 2 tumors was almost too weak to be detected by CLI. As a comparison, REFI imaging identified 3 tumors in the mouse. However, the other useful and important information such as the location, depth, and size of the tumors cannot be obtained. To address this issue, REFT has been developed and evaluated in this study. It is clear that REFT can not only light up all the 3 tumors but also accurately locate them in the mouse. The tumor-specific anatomic position has testified the accuracy of REFT. Overall, these results have demonstrated that the proposed 3D REFT imaging technique can better detect tumors and achieve 3D visualization and distribution information than CLI and REFI, which is crucial to the diagnosis and treatment of disease.
In this experiment, REFT detected all 3 HCC tumors, and PET detected only 1 tumor. The possible explanation for this observation is that the different microenvironment of tumor cells may lead to different levels of 18F-FDG uptake. PET picked up the tumor that had the highest 18F-FDG accumulation among the 3 tumors. The other 2 tumors may take up less 18F-FDG, which is beyond the detection sensitivity of PET. In contrast, the optical signal intensities of all the 3 tumors were enhanced greatly and thus they were successfully detected with the REFT technique. This result suggests that REFT could be more efficient than PET in detecting tumors in some circumstances. More studies using different types of tumors and probes would be helpful to further evaluate and clarify this observation.
Compared with the CLI, the REFI signal was significantly enhanced for most of the radiopharmaceuticals in this study. Because the mixture of 68GaCl3 and EO nanoparticles displays the highest optical signal, it was chosen to conduct the consecutive phantom and implantable experiments. The specific reasons for the highest imaging sensitivity of 68GaCl3 may be related to its decay scheme, branching ratio, and energy spectrum of decay products. Although 68GaCl3 is an ideal radionuclide for REFT, it lacks a suitable 68Ga-based targeting probe for HCC, and 18F-FDG was thus used in animal tumor imaging. In future studies, we will further explore 68GaCl3-labeled probes for imaging other type of tumors, such as 68Ga-DOTATATE for neuroendocrine tumor imaging. Additionally, the clinical translation of EO nanoparticles can be problematic. Novel nanoparticles with higher biocompatibility are desired to be used for REFT. But overall, our study highlights the potential advantages of REFT. With the advancement of material science, REFT may be eventually translated into clinical use.
CONCLUSION
The signal of CL of radiopharmaceuticals and its tissue penetration can be dramatically enhanced by EO. 3D REFT with EO nanoparticles significantly improves the accuracy of localization of radiopharmaceuticals and can also precisely localize the tumor in vivo.
DISCLOSURE
This study was supported by the National Natural Science Foundation of China under grant nos. 81227901 and 81371594; the National Key Research and Development Program of China grant no. 2016YFC0102600; the National Natural Science Foundation of China under grant nos. 61231004, 81527805, 61302024, 81230033, and 81471700; and the Beijing Municipal Science and Technology Commission: Specific Projects grant no. Z151100001615012. No other potential conflict of interest relevant to this article was reported.
Footnotes
↵* Contributed equally to this work.
Published online Sep. 22, 2016.
- © 2017 by the Society of Nuclear Medicine and Molecular Imaging.
REFERENCES
- Received for publication July 4, 2016.
- Accepted for publication August 3, 2016.


Jump to section
Related Articles
Cited By...
- No citing articles found.