


Abstract
Brown adipose tissue (BAT) could facilitate weight loss by increasing energy expenditure. Cold is a potent stimulator of BAT, activating BAT primarily through the sympathetic nervous system (SNS). Older or overweight individuals have less metabolic BAT activity than the lean and young, but the role of the SNS in this decline is unknown. We aimed to determine whether this lower metabolic BAT activity in older or overweight individuals can be explained by a lower SNS response to cold. Methods: This was a prospective observational study. We included 10 young obese, 11 old lean, and 14 young lean healthy men. All subjects underwent 18F-FDG PET/CT and 123I-meta-iodobenzylguanidine (123I-mIBG) SPECT/CT after an overnight fast and 2 h of cold exposure. Metabolic BAT activity was expressed as volume and as SUVmax of 18F-FDG. BAT SNS activity was expressed as volume and as the ratio between 123I-mIBG uptake in BAT and a reference region (SQUVmax of 123I-mIBG). Results: SUVmax, BAT volume, and SQUVmax were significantly different between young and old (SUVmax, 7.9 [range, 4.2–17.3] vs. 2.9 [range, 0.0–4.0]; volume, 124.8 [range, 10.9–338.8] vs. 3.4 [range, 0.0–10.9]; and SQUVmax, 2.7 [range, 1.9–4.7] vs. 0.0 [range, 0.0–2.2], respectively) (all P < 0.01) but not between lean and obese (SUVmax, 7.9 [range, 4.2–17.3] vs. 4.0 [range, 0.0–13.5] [P = 0.69]; volume, 124.8 [range, 10.9–338.8] vs. 11.8 [range, 0.0–190.2] [P = 0.64]; and SQUVmax, 2.7 [range, 1.9–4.7] vs. 1.7 [range, 0–3.5] [P = 0.69], respectively). We found a strong positive correlation between BAT activity measured with 18F-FDG and 123I-mIBG in the whole group of BAT-positive subjects (ρ = 0.82, P < 0.01). Conclusion: Both sympathetic drive and BAT activity are lower in older but not in obese men.
The increasing prevalence of obesity in the young heralds a period in which we will be confronted with an older and obese population with an abundance of adverse consequences and associated health costs (1,2). So far most solutions for this problem have been unsatisfactory because attempts to lose weight fail in most cases (3,4).
Metabolically active brown adipose tissue (BAT) increases energy expenditure and could play a role in the battle against obesity by facilitating weight loss (5,6). If we could identify factors that contribute to stimulation or recruitment of metabolically active BAT, it would be possible to use BAT as a means to lose weight. Though cold exposure is the strongest activator of BAT known so far (7), people will not be exposed to cold for most of the day. Factors activating BAT during thermoneutrality have to be found. An important target in this respect is the sympathetic nervous system (SNS), which is thought to be the primary activator of BAT (8).
In both older and overweight people, metabolic activity of BAT is generally found to be much lower than in younger or leaner controls (9–12). The reason for this decreased metabolic BAT activity remains unknown, and the role of the SNS in BAT activation in the older and the obese has not been studied.
The common method to demonstrate metabolically active BAT is by performing 18F-FDG PET/CT. Recently, our group showed that the sympathetic nervous stimulation of BAT can be visualized by 123I-meta-iodobenzylguanidine (123I-mIBG) SPECT (13). We showed a strong, positive correlation between 18F-FDG and 123I-mIBG in BAT in lean young men.
We hypothesized that SNS activation is diminished in both older and obese subjects as compared with young lean subjects as a cause for the diminished BAT activity. Therefore, we investigated whether SNS activation of BAT (123I-mIBG) as a mediator of BAT activity (18F-FDG) is diminished in young obese or lean older men when compared with the lean and young. In addition, we investigated whether the strong correlation between 18F-FDG and 123I-mIBG in lean men is also present in obese and older men. Finally, we investigated whether energy expenditure correlated with BAT activity.
MATERIALS AND METHODS
This study was approved by the Medical Ethics Committee of the Academic Medical Center of the University of Amsterdam and was conducted according to the Declaration of Helsinki. Written informed consent was obtained from all subjects after oral and written explanation of the study procedures. The registration numbers of this study are NCT02173834 and NCT02130154 (www.clinicaltrials.gov).
Participants
This study consists of 2 separate protocols, which we have combined into 1 study. Power calculations were performed using nQuery Advisor (Statistical Solutions Ltd.), and they were based on previous studies (13). Assuming an α of 5%, 10 subjects per group were needed to be included in the study to obtain a power of 80% to detect a significant difference between the young obese and young lean subjects. To detect a significant difference between the young lean and old lean subjects, assuming an α of 5%, 11 subjects per group were needed to be included in the study to obtain a power of 80% to detect a significant difference between the young lean and old lean subjects.
We decided to combine the 2 studies after inclusion of 14 young lean subjects. In all, we included a group of 35 healthy, Caucasian male volunteers. We studied 10 young obese men (inclusion criteria: age, 18–30 y; body mass index [BMI], >28 kg/m2; later referred to as the obese men), 11 old lean men (inclusion criteria: age, >40 y; BMI, 19–25 kg/m2; later referred to as the older men), and 14 lean young men (inclusion criteria: age, 18–30 y; BMI, 19–25 kg/m2; later referred to as lean young). Subjects were included when they met the age and BMI criteria of the specified group and did not use any medication or drugs.
Baseline characteristics were obtained during the first visit. Anthropometric data were measured with the subjects wearing only underwear. Weight was measured on the same calibrated mechanical scale (SECA) to the nearest 100 g, and height and waist circumference were recorded to the nearest 0.01 m.
18F-FDG PET/CT and 123I-mIBG SPECT/CT Imaging Protocols
18F-FDG PET/CT and 123I-mIBG SPECT/CT were performed on 2 separate days within an interval of 2 wk between April 2013 and March 2014 according to the previously established protocol (14). In short, all subjects arrived in the morning after an overnight fast, after which they were exposed to mild cold (∼16°C–17°C) in an air-cooled room for 2 h. During the cold exposure, subjects were wearing underwear only. After 1 h of cold exposure, the radioactive tracer was administered (the 18F-FDG was adjusted for BMI, leading to dosages of ∼200 MBq; for 123I-mIBG, a fixed dose of 185 MBq was used). 18F-FDG PET/CT was performed directly after the 2-h cold exposure (i.e., 1 h after 18F-FDG administration), and 123I-mIBG SPECT/CT was performed approximately 24 h after the 123I-mIBG administration (according to the previously established protocol) (13). After every 2 subjects, the sequence of 18F-FDG PET/CT and 123I-mIBG SPECT was changed to overcome order effects.
The scans were assessed by 2 authors, one trained in analyzing the scans and the other a nuclear physician. To compare areas with active BAT on both scans, 18F-FDG PET/CT and 123I-mIBG SPECT/CT were aligned. Volumes of interest established on 18F-FDG PET/CT (i.e., uptake of 18F-FDG identified by PET and the presence of fat identified by CT) were copied to the aligned 123I-mIBG SPECT/CT images. PET and SPECT images were aligned using an automated rigid method. We measured maximal uptake, mean uptake, and volume of BAT on both 18F-FDG PET/CT and 123I-mIBG SPECT/CT.
BAT volume was measured using a PET- or SPECT-threshold–based delineation. Therefore, volumes measured reflect activated BAT volume. All visually identified areas with active BAT were included in the analysis.
To be able to integrate the influence of both the metabolic and the sympathetic BAT activity within subjects across the 3 groups, we also calculated the SQUVmax-to-SUVmax ratio.
Other Measurements
Energy expenditure was recorded every minute using Quark RMR (Cosmed) during 30 min via indirect calorimetry after the 2 h of cold exposure in the waiting period after 123I-mIBG administration and the SPECT/CT acquisition (e.g., 1 h after the 123I-mIBG administration).
Oral glucose tolerance test and laboratory measurements were performed according to standard procedures (the supplemental data provide detailed methods; supplemental materials are available at http://jnm.snmjournals.org).
Statistical Analysis
The characteristics of the study participants are reported as medians with interquartile ranges (IQRs). The P values for differences between the lean young men and the older men and the obese were determined using the Mann–Whitney U test. Differences in the presence of BAT activity between the groups were calculated with the Fisher exact test. Correlations were determined with the Spearman correlation. Data analysis was performed using SPSS software 20.0 (IBM Software). A P value of less than 0.05 was considered to indicate statistical significance.
RESULTS
The study was performed between April 2013 and March 2014. Baseline characteristics of the subjects are shown in Table 1 (a more detailed table of baseline characteristics can be found in the supplemental data). As expected, the obese and the older men showed a more adverse metabolic profile than the lean and young subjects; that is, older subjects had a significantly higher HbA1c and total and low-density lipoprotein cholesterol whereas obese subjects were significantly less insulin-sensitive and had higher high-density lipoprotein cholesterol values and triglycerides (Supplemental Table 1).
Characteristics of Male Volunteers
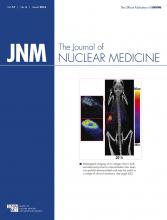
18F-FDG uptake was visually seen in 7 of 10 subjects in the obese-male group, 6 of 11 in the older-male group, and 13 of 14 in the lean-young-male group. The presence of BAT activity on 18F-FDG PET/CT was not significantly different between the obese and lean males (P = 0.27) and borderline significant between the old and young males (P = 0.056). Figure 1 shows 3 typical cases of metabolically active BAT in our subjects. Metabolic BAT activity (maximal and mean) and volume measured on 18F-FDG PET/CT were different between the lean older men and lean young (P < 0.01) men but not between the obese and lean young men (Fig. 2).
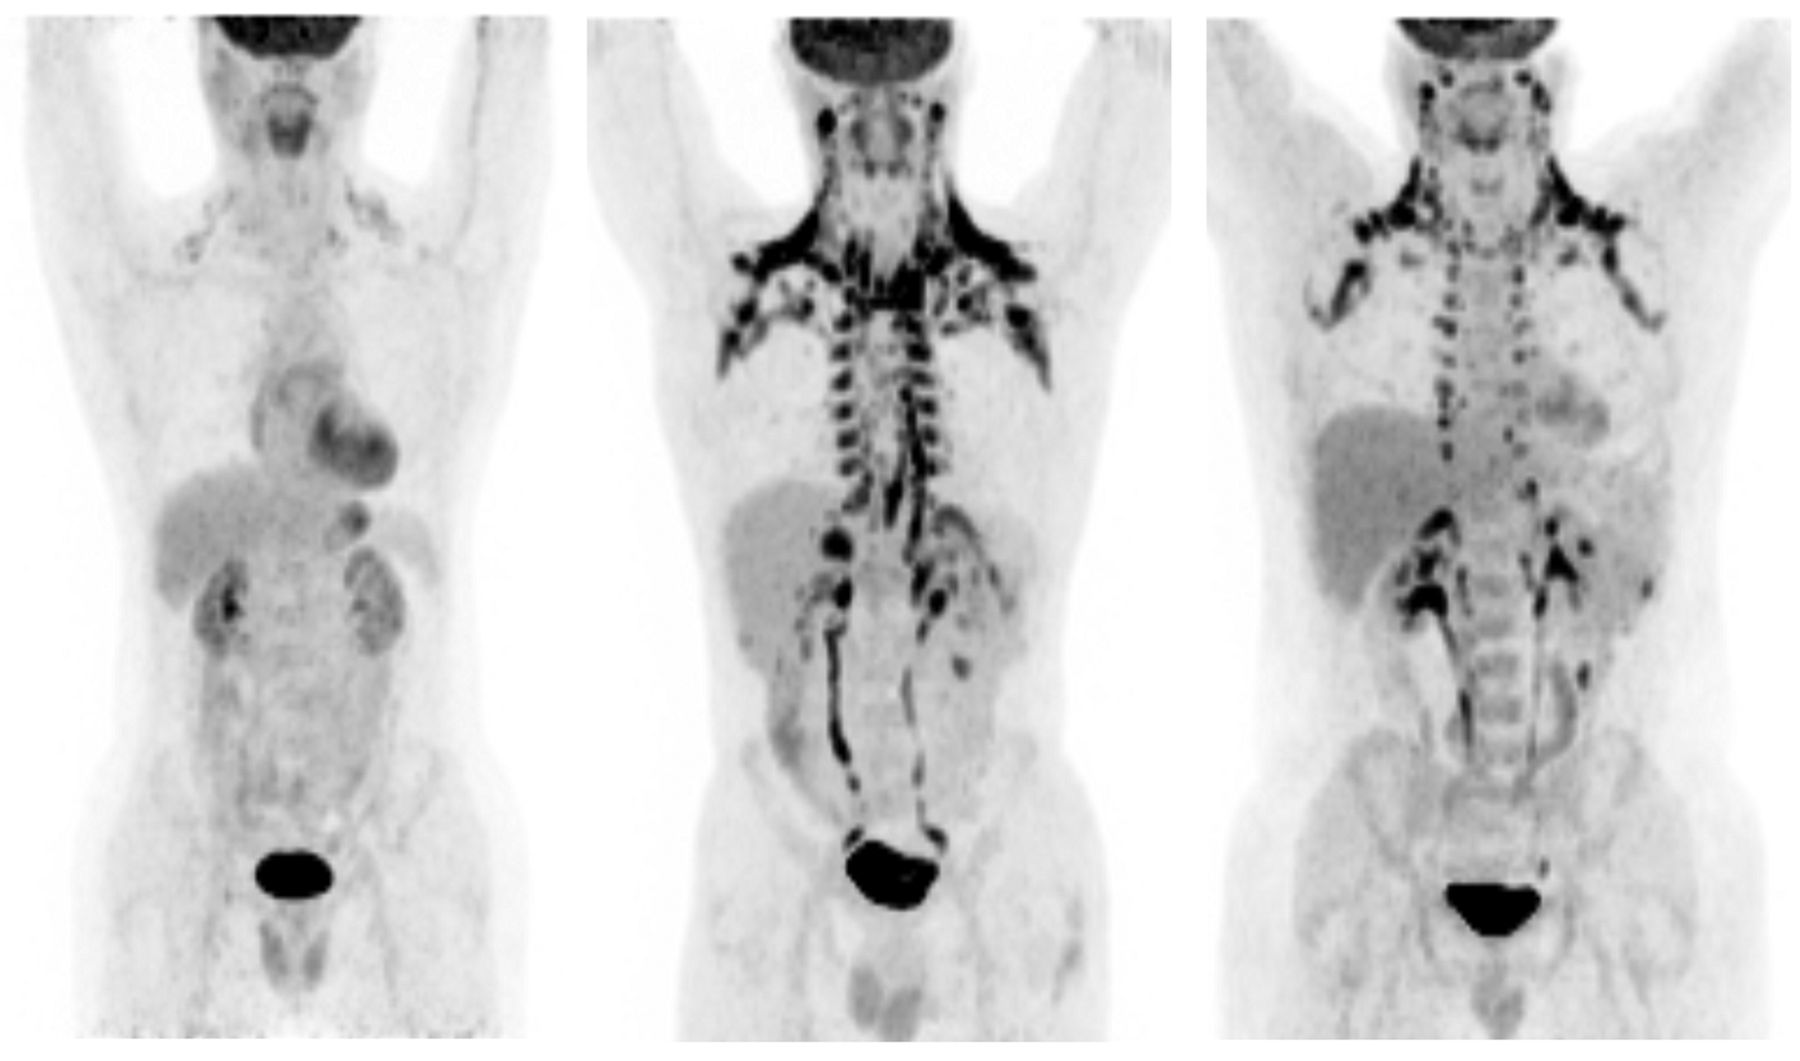
Three typical examples of BAT activity in accordance with subjects’ age and BMI. Left subject is a lean and old subject showing minimal BAT activity; middle subject is a lean and young subject showing abundant BAT activity; and right subject is an obese and young subject showing BAT activity but less than lean and young subject.

(A–C) Metabolic activity of BAT between the 3 groups defined as median (IQR) SUVmax, SUVmean, and volume of 18F-FDG (defined as activity in Bq/mL within region of interest divided by injected dose in Bq/g of body weight), respectively. (D– F) Sympathetic nervous stimulation to BAT between the 3 groups defined as median (IQR) SQUVmax and volume of 123I-mIBG (calculated as maximum count in BAT divided by mean count per voxel in the mediastinum), respectively. NS = not significant.
Uptake of 123I-mIBG was seen in 7 of 10 subjects in the obese-male group, 5 of 11 in the older-male group, and 13 of 14 in the lean-young-male group. Again, the presence of BAT activity on 123I-mIBG SPECT was not significantly different between the obese and lean men. The maximal sympathetic nervous stimulation of BAT (SQUVmax) and volume measured on 123I-mIBG SPECT were significantly diminished in the older men as compared with the lean young but did not differ between the obese and the lean young men. Mean sympathetic nervous stimulation of BAT (SQUVmean) was not significantly different between any of the groups (Fig. 2).
All the subjects with 123I-mIBG uptake in BAT also showed 18F-FDG uptake in BAT. Conversely, there was 1 older subject who showed 18F-FDG uptake in BAT but no 123I-mIBG uptake.
To assess the relative influence of the sympathetic drive, we calculated the maximal and mean SQUV/SUV ratio in all subjects who were BAT-positive on both scans. Although both the SQUVmax and the SUVmax were lower in the older men, the SQUVmax-to-SUVmax ratio was higher in the older men than the lean young. There was no difference in the ratio between the obese and the lean young. The SQUVmean/SUVmean ratio did not differ between the groups (Fig. 3).

Relative influence of sympathetic drive, calculated as SQUV-to-SUV ratio in all subjects who were BAT-positive on both scans for maximal values (A) and mean values (B). NS = not significant.
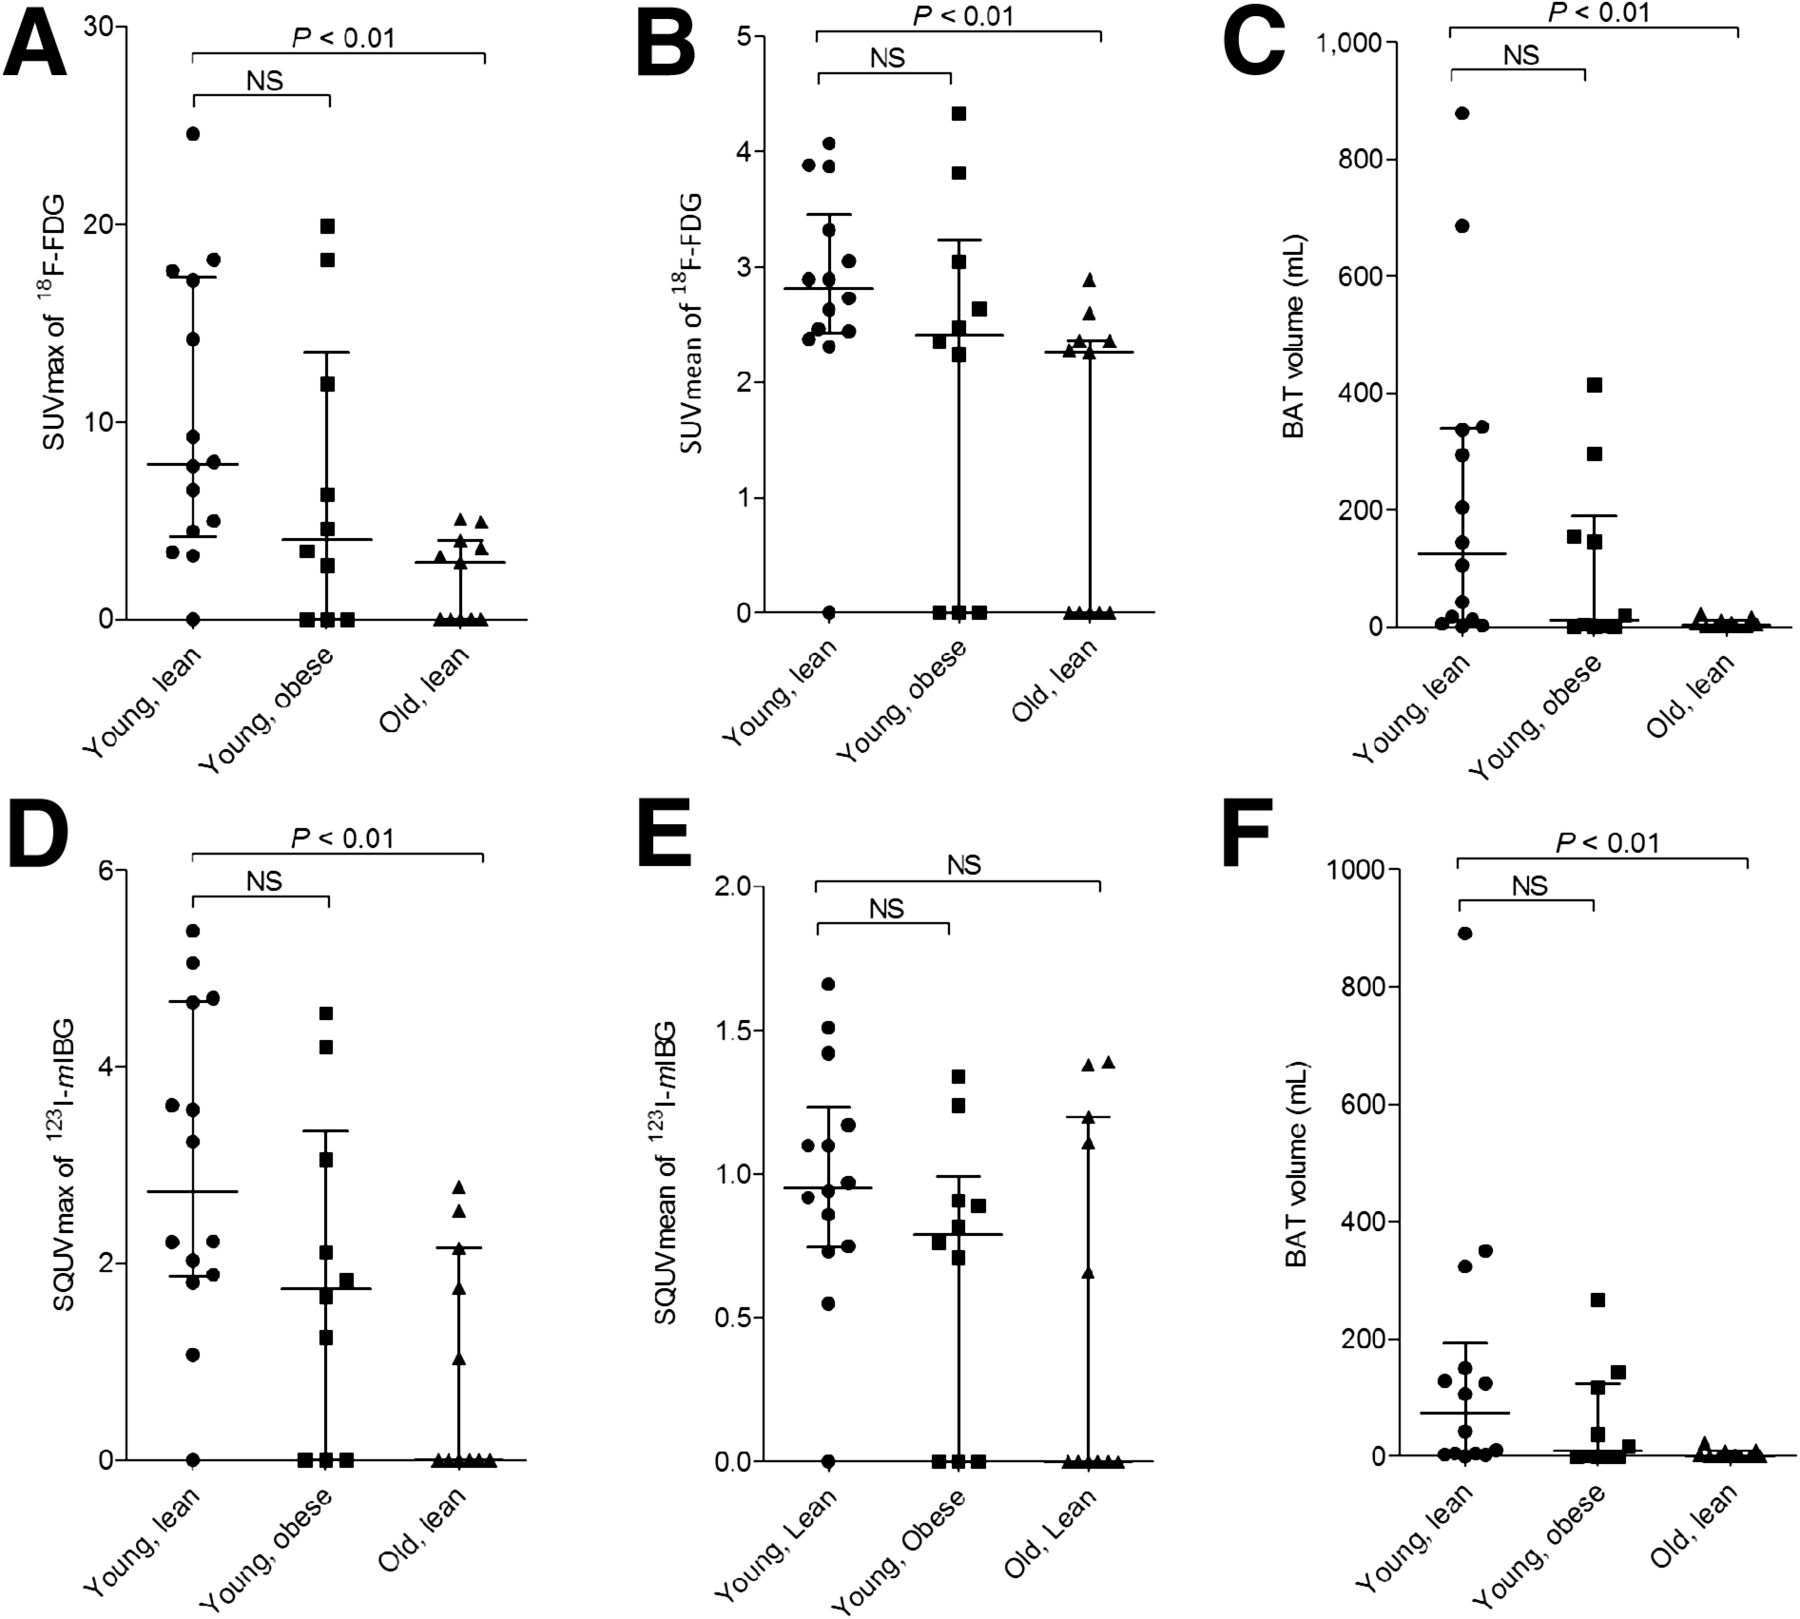
There was a negative correlation between age and maximal metabolic and sympathetic BAT activity. Although the correlation remained significant for age and mean metabolic BAT activity, the correlation disappeared for age and the mean sympathetic BAT activity (Table 2). There was no correlation between BMI and maximal or mean metabolic and maximal sympathetic BAT activity or BMI and BAT volume (Table 2). There was a strong and positive correlation in the whole group for both maximal and mean BAT activity measured with 18F-FDG and 123I-mIBG (Fig. 4). Also after removal of the BAT-negative subjects, this correlation remained strong and positive for maximal BAT activity but not for mean BAT activity (Fig. 4).
Correlations Between BAT Parameters and Patient Characteristics

Spearman correlations for metabolic BAT activity measured on 18F-FDG PET/CT (expressed as SUVmax of 18F-FDG) and sympathetic nervous stimulation to BAT measured on 123I-mIBG SPECT (expressed as SQUVmax of 123I-mIBG). (A) Maximal BAT activity in all subjects (n = 35). (B) Maximal BAT activity in all BAT-positive subjects (n = 26). (C) Mean BAT activity in all subjects (n = 35). (D) Mean BAT activity in all BAT-positive subjects (n = 26); regression line not shown because of nonsignificance.
After stratification, the strong positive correlation between maximal BAT activity measured with 18F-FDG and 123I-mIBG was still apparent in the lean young and the obese men but not in the older men (Table 3). After removal of the BAT-negative subjects, the correlation was still significant in the lean young men (spearman correlation ρ, 0.74; P < 0.01) but not for the obese men (spearman correlation ρ, 0.12; P = 0.64). There was no correlation between mean BAT activity measured with 18F-FDG and 123I-mIBG for any of the groups (Table 3).
Correlations Between BAT Parameters After Stratification
Energy expenditure during cold did not differ significantly among the 3 groups (Table 1). There was a positive relation between energy expenditure in cold and maximal metabolic and sympathetic BAT activity in the whole group (Table 2).
DISCUSSION
We found a lower SNS activity in the older men than in the lean young men, which may be the explanation for the lower metabolic BAT activity. In line with our earlier data, we found a strong and positive correlation for detecting BAT on 18F-FDG PET/CT and 123I-mIBG SPECT/CT in the lean young men (13). This correlation disappeared in the older men.
The higher SQUVmax-to-SUVmax ratio in the older men than in lean young men may suggest a dissociation between the stimulus and effect. This dissociation might also explain the absence of a correlation for detecting BAT between 18F-FDG PET/CT and 123I-mIBG SPECT/CT.
Because the SNS drive is supposed to be the main determinant of BAT activity, an increasing ratio of SNS activity over metabolic BAT activity (for our purposes the ratio of 123I-mIBG uptake over 18F-FDG uptake) might imply that BAT becomes less sensitive to SNS signals on aging. After all, the SNS signal, relative to metabolic activity (i.e., the SQUVmax-to-SUVmax ratio) was higher in the older men than in the lean young men, though just short of statistical significance.
The combination of both a lower absolute SNS signal and a possible declined sensitivity of BAT for SNS stimulation may cause the lower ability to activate and recruit BAT in the older men. However, the relative role of the SNS should be confirmed in trials with larger subject numbers.
Strikingly, older humans have an inability to appropriately regulate their temperature when exposed to cold (15–17). At least some part of this inability is due to an increased heat loss caused by inefficient vasoconstriction responses or changes in peripheral blood flow during cold exposure (17–19). Nonetheless, there is also evidence that on aging, the ability to produce metabolic heat decreases (20). Hypothetically, this might at least in part be caused by the lower absolute SNS signal to BAT in the elderly population, causing a lower ability to activate and recruit BAT in the older men.
These findings support the idea that the SNS has an important role in the activation process of BAT.
Studies investigating the effects of sympathicomimetics (e.g., ephedrine, isoprenaline) on BAT activation did not result in unequivocal evidence (21–24). However, recently Cypess et al. showed an intense BAT activation after administration of mirabegron (a β3 adrenergic receptor agonist) (25). Similar to our previous study (13), we also clearly show involvement of SNS in BAT. The SNS activity to BAT can be visualized and quantified by performing 123I-mIBG SPECT.
The involvement of the SNS in BAT activation is clearly demonstrated by the strongly positive correlation for detecting BAT on 123I-mIBG SPECT and 18F-FDG PET/CT in lean young, healthy men (13). The lower metabolic BAT activity in the older men than in the lean young men is in line with previous studies, though less pronounced (10,12). We found a fairly high metabolic BAT activity in the older men as compared with the literature; this might be explained by the fact that the older men in our study were in a good physical condition as illustrated by a relatively low BMI and the fact that none of our subjects used any medication, despite the median age of 54 y (IQR; range, 50–60 y). We found a borderline significant difference in the presence of BAT activity on 18F-FDG PET/CT between the young and older men. Though the metabolic BAT activity in the older men was relatively high, the borderline significant difference is probably a type 2 error, caused by the small sample size.
In addition to the lower metabolic BAT activity in the older men, we now demonstrate a lower SNS activity to BAT, as compared with the lean, young. This might, at least in part, explain the lower metabolic BAT activity in older men. Promising results have been obtained in several studies indicating that BAT can be recruited, even in individuals with decreased BAT activity (26,27). However, whether this could also be applied in older humans has to be investigated.
We used 123I-mIBG SPECT to measure sympathetic stimulation in an acute exposure setting. The uptake of 123I-mIBG in neuroendocrine cells occurs by an active uptake mechanism via the norepinephrine transporter. There is evidence that acute modulation of norepinephrine transporter trafficking may provide additional modulatory capacity for noradrenergic signaling (28). This means that the 123I-mIBG uptake patterns we have observed most likely reflect the fast sympathetic response to the acute cold exposure. After the uptake, 123I-mIBG is stored in neurosecretory granules and may subsequently be secreted in the synaptic cleft. 123I-mIBG uptake in a specific organ is dependent on catecholamine excretion or the adrenergic innervation of the specific organ (29).
In contrast to other groups, we used a uniform cooling method in which all subjects were exposed to the same room temperature instead of personalized cooling. Uniform cooling is considered clinically more relevant because humans are exposed to outdoor temperatures, which are also uniform. Nonetheless, despite the uniform cooling, we found no differences in metabolic BAT activity between the lean young and the obese men. This might be explained by the slightly lower age of the obese subjects than the subjects in the literature (30,31). Aging processes might be more important as determinants of BAT than BMI (9). Furthermore, the small number of participants may have caused a lack of power to demonstrate a difference between the obese and the lean young subjects. However, other studies, using the same sample size but a different cooling protocol, found a significant difference in metabolic BAT activity and volume between the lean young and the obese (11,30,31).
Likewise, there was no difference in SNS stimulation between the lean and the obese. The strong and positive correlation for detecting BAT on 18F-FDG PET/CT and 123I-mIBG SPECT/CT we found in the lean young was also found in the obese, confirming that 123I-mIBG SPECT/CT is capable of detecting the SNS BAT activity in both the lean young and the obese subjects.
We measured BAT volume using a PET/SPECT threshold–based delineation. Therefore, BAT volumes included in this study reflect activated BAT volume instead of total BAT volume, and total BAT volume might be underestimated. However, by exposing our subjects to cold, BAT is maximally activated. Therefore, in this setting the differences between activated BAT and total BAT are probably small.
We found a weak but positive correlation between energy expenditure during cold exposure and BAT activity, emphasizing that activated BAT could contribute to weight loss. These findings are in line with previous publications (26,27,32).
CONCLUSION
A lower sympathetic drive may explain the lower BAT activity in the older men but not in the obese men. Furthermore, with increasing age there might also be a diminished sensitivity of BAT to SNS stimulation. If the activation of BAT is regarded as a promising antiobesity strategy, future research has to be directed to identify factors able to reactivate or recruit BAT in thermoneutrality, possibly by increasing the SNS signal to BAT.
DISCLOSURE
The costs of publication of this article were defrayed in part by the payment of page charges. Therefore, and solely to indicate this fact, this article is hereby marked “advertisement” in accordance with 18 USC section 1734. No potential conflict of interest relevant to this article was reported.
Footnotes
Published online Nov. 25, 2015.
- © 2016 by the Society of Nuclear Medicine and Molecular Imaging, Inc.
REFERENCES
- Received for publication July 31, 2015.
- Accepted for publication October 28, 2015.


Jump to section
Related Articles
Cited By...
- The metabolic benefits of thermogenic stimulation are preserved in aging
- Trpm8 modulates thermogenesis in a sex-dependent manner without influencing cold-induced bone loss
- Assessment of the aging of the brown adipose tissue by 18F-FDG PET/CT imaging in the progeria mouse model LmnaG609G/G609G
- Recent advances in the detection of brown adipose tissue in adult humans: a review