


Abstract
There is strong clinical interest in using neural stem cells (NSCs) as carriers for targeted delivery of therapeutics to glioblastoma. Multimodal dynamic in vivo imaging of NSC behaviors in the brain is necessary for developing such tailored therapies; however, such technology is lacking. Here we report a novel strategy for mesoporous silica nanoparticle (MSN)–facilitated NSC tracking in the brain via SPECT. Methods: 111In was conjugated to MSNs, taking advantage of the large surface area of their unique porous feature. A series of nanomaterial characterization assays was performed to assess the modified MSN. Loading efficiency and viability of NSCs with 111In-MSN complex were optimized. Radiolabeled NSCs were administered to glioma-bearing mice via either intracranial or systemic injection. SPECT imaging and bioluminescence imaging were performed daily up to 48 h after NSC injection. Histology and immunocytochemistry were used to confirm the findings. Results: 111In-MSN complexes show minimal toxicity to NSCs and robust in vitro and in vivo stability. Phantom studies demonstrate feasibility of this platform for NSC imaging. Of significance, we discovered that decayed 111In-MSN complexes exhibit strong fluorescent profiles in preloaded NSCs, allowing for ex vivo validation of the in vivo data. In vivo, SPECT visualizes actively migrating NSCs toward glioma xenografts in real time after both intracranial and systemic administrations. This is in agreement with bioluminescence live imaging, confocal microscopy, and histology. Conclusion: These advancements warrant further development and integration of this technology with MRI for multimodal noninvasive tracking of therapeutic NSCs toward various brain malignancies.
Glioblastoma multiforme is the most aggressive primary malignant brain tumor in adults despite a maximal treatment regimen (1,2). Lack of efficacious therapy along with the impermeable blood–brain barrier prompted the development of novel approaches for direct delivery of therapeutics to the tumor burden (3,4). The nonimmunogenic nature and intrinsic ability of stem cells to preferentially migrate toward both local and disseminated diseases have generated much interest in their use as vehicles for targeted delivery of antitumor therapeutics (5–8). In particular, the success of preclinical studies investigating tropism, distribution, safety, and therapeutic efficacy of a clonal human neural stem cell (NSC) line, HB1.F3.CD, has led to approval of these cells as therapeutic carriers in patients with recurrent high-grade glioma (8). Thus, modalities tracking the fate of stem cells in vivo are of great interest and are critical for the tailored development of efficient stem cell–based glioma therapies.
SPECT, a nuclear imaging technique, possesses high sensitivity with minimal limit to tissue penetration (9) and can offer valuable information for interpretation of signal in the brain alone or in combination with MRI. The most widely used SPECT radionuclides include 111In (half-life, 67 h) and metastable 99mTc (half-life, 6 h). Although 99mTc can be used in higher doses to improve the short-term imaging resolution, 111In can provide a longer time window for cell tracking. Indeed, several groups have used 111In to image mesenchymal stem cells (MSCs) in vivo around sites of myocardial injury in canine (10,11) and porcine animal models (12). Human clinical studies have also used 111In-oxine (13,14) and 99mTc-hexamethylpropleneamine oxine (15–17) to assess stem cell trafficking in acute and chronic myocardial infarction. Nanoparticles are new modalities for labeling of stem cells and can offer advantages over other labeling methods (18). Mesoporous silica nanoparticles (MSNs) are particularly attractive as drug/contrast agent carriers because of their intrinsically large surface areas, accessible pores, low toxicity (19), and ease of uptake and transport by cells (20).
There is unmet need for development of imaging techniques for tracking of stem cells in the brain. Here we evaluate in vivo tracking of 111In-MSN–labeled NSCs migrating toward glioma xenograft. This report validates that the 111In-MSN radiolabeling strategy enables SPECT imaging of in vivo behaviors of NSCs after either local or systemic delivery.
MATERIALS AND METHODS
All reagents were used as received without further purification (Supplemental Table 1; supplemental materials are available at http://jnm.snmjournals.org).
Synthesis and Characterization of MSN
To synthesize MSN, the sol-gel co-condensation of tetraethyl orthosilicate was performed (Supplemental Table 2). All samples were collected by centrifugation (12,000 rpm × 20 min) and a series of washes with deionized water and ethanol. Nanoparticles were characterized via transmission electron microscopy, dynamic light scattering, ζ potential, and nitrogen adsorption/desorption isotherm measurements to define topology, size, pore volume, surface area, and charge (supplemental materials).
Radiolabeling of MSN with 111In and Loading of NSCs with 111In-MSN
MSNs were conjugated with DOTA-N-hydroxysuccinimide-ester through amide formation (Fig. 1). The detailed optimization of labeling efficiency and stability assessments are described in the supplemental material. Inductively coupled plasma mass spectrometry was performed to quantify silicon and cadmium content in MSN (supplemental materials). Human NSCs (clone HB1.F3.CD; ClinicalTrials.gov identifier NCT01172964) were used in all in vitro and in vivo experiments. The uptake efficiency, cytotoxicity, and phantom study details are listed in the supplemental materials.

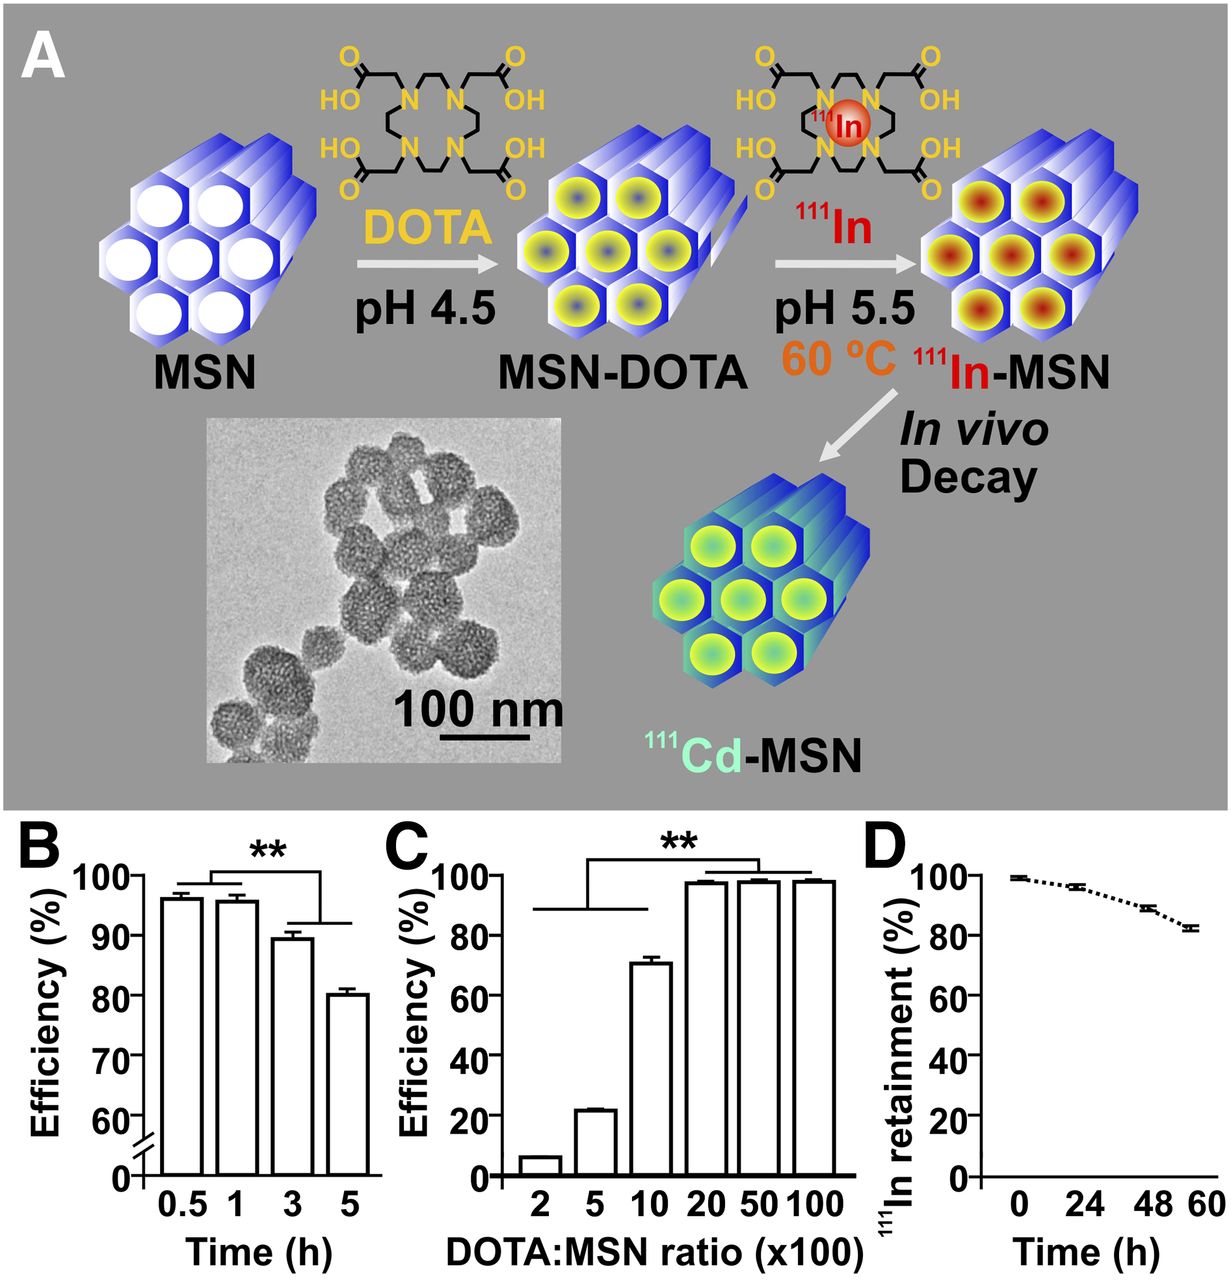
Optimization of loading protocol of MSN with 111In. (A) Schematic illustration of 111In encapsulation process in MSN. Uniformly sized MSNs were first modified with NH2 groups to form MSN-NH2, followed by DOTA conjugation to yield MSN-DOTA via (2-(1H-benzotriazol-1-yl)-1,1,3,3-tetramethyluronium hexafluorophosphate) (HBTU) coupling. 111In-MSN was radiolabeled in 2-(N-morpholino)ethanesulfonic acid (MES) buffer at 60°C. On decay, 111In-MSN transformed to 111Cd-MSN and acquired fluorescence spectra (Supplemental Fig. 2). Inset is transmission electron microscopy image of MSN-DOTA complexes. Scale bar = 100 nm. (B) Time course of labeling efficiencies of 111In-MSN indicates on high efficiency within 0.5 h. (C) Labeling efficiency of 111In-MSN with various DOTA:MSN molecule ratios indicates optimal ratio is greater than 2,000:1 (n = 3, P < 0.005, paired t test). (D) Stability of 111In retention by MSN sustained over 60 h. **P < 0.01.
Orthotopic Glioblastoma Model and 111In-MSN-NSC Injection
The animal procedures were approved by the University of Chicago Institutional Animal Care and Use Committee. Male athymic mice (age, 6 wk) were intracranially injected with 1 × 10⁵ U87MG cells in the right frontal lobe as previously described (21). Tumor cells were allowed to engraft for 3 wk before SPECT imaging. Naïve, nontumor-bearing animals served as controls. NSCs were prepared for in vivo imaging experiments as follows. NSCs were incubated with 150 μg/mL particles for 2 h in Opti-MEM medium (Invitrogen), subsequently washed twice, trypsinized, and collected by centrifugation in Dulbecco modified Eagle medium containing 10% fetal bovine serum. After an additional washing, the cells were resuspended in sterile phosphate-buffered saline. Mice were anesthetized with ketamine/xelazine and inoculated with 1 × 10⁶ of radiolabeled NSCs contralateral to the tumor injection site or with 3 × 10⁶ cells through intracardiac systemic injection.
SPECT/CT Imaging
The mice were imaged via SPECT/CT and optical imaging at the indicated time points. Small-animal SPECT/CT imaging was performed at the University of Chicago Integrated Small Animal Imaging Research Resource on a Trifoil Triumph Trimodality preclinical microPET/SPECT/CT imaging system. CT imaging of animals was performed for anatomic coregistration, and CT fusion of SPECT images was performed using AMIRA software (FEI Co.). Acquisition strategy details are listed in the supplemental materials. Optical imaging of NSCs-fluc was performed using an IVIS Spectrum System with Living Image software (PerkinElmer) as previously described (21). For quantification of SPECT signal, the images were processed in the Image J software (National Institutes of Health). Regions of interest (33.75 mm) were drawn in 5 contiguous coronal slices in the left hemisphere and in the same region of the contralateral side of brain. The sum of the counts within the regions of interest was obtained by subtracting the background counts.
Biodistribution of 111In-MSN Complex and Tissue Analysis
Biodistribution studies after an intracranial injection of radiolabeled NSCs were performed 48 h after injection of 111In-MSN–loaded NSCs in the mouse brain. Details are listed in the supplemental materials and results in Supplemental Figure 4. On completion of SPECT imaging, the brains were flash-frozen and sectioned after 111In decayed to the negligible level (details are provided in the supplemental materials).
Statistical Analysis
Statistical analyses were performed using Prism 4 (GraphPad Software Inc.). Sample size for each group was 3 or more, and numeric data were reported as mean ± SEM. Comparisons between 2 groups were conducted using the Student t test, and differences between more than 2 groups were assessed using ANOVA with Tukey post hoc test or repeated-measures ANOVA with Bonferroni post hoc test. The Pearson coefficient was calculated for the correlation between tumor weight and accumulated radioactivity. All reported P values were 2-sided and considered to be statistically significant at P < 0.05, P < 0.01, and P < 0.001.
RESULTS
Radiochemistry of 111In-MSN Complex for SPECT Imaging
A unique feature of MSN is the large surface area that supports efficient loading with radioisotopes or drug of choice. Previously, we demonstrated low toxicity of MSNs toward NSCs, confirming their feasibility for NSC-mediated antitumor therapies (20). Here, we designed radiolabeled MSN as a nanoscale probe for labeling and tracking NSCs within the brain toward glioma xenograft tissue using SPECT imaging. MSN synthesis was described previously (11), and the incorporation of 111In is schematically shown in Figure 1A. MSNs were on average 70 nm in diameter with uniform morphology as seen with transmission electron microscopy. Supplemental Table 3 summarizes the physical properties of MSNs. Figure 1B shows that the labeling efficacy reaches maximum reaction in 30 min (n = 3). Up to 95% of 111In labeling efficacy was achieved at a molecular ratio (DOTA/MSN) of 2,000. (Fig. 1C; n = 3). The average activity of MSN-DOTA-111In was 21.2 MBq/mg. Specifically, 0.5 mg/mL of MSN-DOTA-111In (n = 3) were incubated in serum-free Dulbecco modified Eagle medium at 37°C and then analyzed for released radioactivity by instant thin-layer chromatography. The stability was more than 90% during the first 48 h and the release of 111In reached only 18% ± 2.3% after 60 h of incubation (Fig. 1D).
NSC Uptake Efficacy and Toxicity Studies
NSCs plated in 96-well plates (1.0 × 10⁵ cell/well) were treated with 100 μg/mL of 111In-MSN in Dulbecco modified Eagle medium containing 1% fetal bovine serum, reduced-serum Opti-MEM medium, or in the presence of X-tremeGENE HP DNA transfection reagent (Roche Diagnostics Corporation) for 2 or 6 h. The uptake efficacy of 111In-MSN by NSCs was measured in a γ-counter. Figure 2A shows that the uptake of 111In-MSN reached 58% ± 1.7% when labeling was performed in Opti-MEM medium without significant improvement in the presence of transfection reagent and 33% ± 0.9% in serum containing medium after 2 h of incubation. The 6-h treatment did not further improve the 111In-MSN uptake and was deemed unnecessary (data not shown). The presence of albumin and γ-globulins in serum containing medium is likely the main contributor to the observed differences in uptake (22,23). In toxicity assays, cells were treated with 25, 50, 100, and 200 μg/mL of 111In-MSN complex in Opti-MEM medium for 2 h, after which the medium was changed to Dulbecco modified Eagle medium containing 10% fetal bovine serum for another 24 and 48 h. Figure 2B shows that 94% ± 8% (n = 4) and 86% ± 2% (n = 4) of NSCs remained viable at 100 μg/mL, whereby, viability was measured as 49% ± 11% (n = 3, P < 0.001) and 76% ± 2% (n = 4, P < 0.05) of control at 200 μg of 111In-MSN per milliliter at 24 and 48 h, respectively. No toxicity of MSN to NSCs in the absence of 111In was detected (Supplemental Fig. 1). Thus, these studies identify the optimal protocol for loading NSCs with 111In-MSN. Next, we performed an in vitro phantom study to validate SPECT feasibility. Figure 2C shows that SPECT signal is detectable in radiolabeled NSCs equal to 0.3 MBq of 111In, corresponding to detectable levels in animal brains. Interestingly, we observed that fully decayed 111In-MSN emits fluorescence (Supplemental Fig. 2). Next, we characterized the fluorescent profiles of NSCs loaded with decayed 111In-MSN using confocal microscopy. Supplemental Fig. 2D shows confocal images of NSCs collected in a series of color channels. The green channel recorded the strongest fluorescent signal in NSCs loaded with decayed 111In-MSN. Figure 2D shows that fluorescence of decayed 111In-MSN is strongly visible in overplayed images of NSCs stained with antinestin antibodies conjugated to phycoerythrin but not in NSCs loaded with nonradiolabeled MSN. Our data indicate that radiolabeled NSCs could be reliably traced in tissue sections based on the fluorescent properties of decayed 111In-MSN.
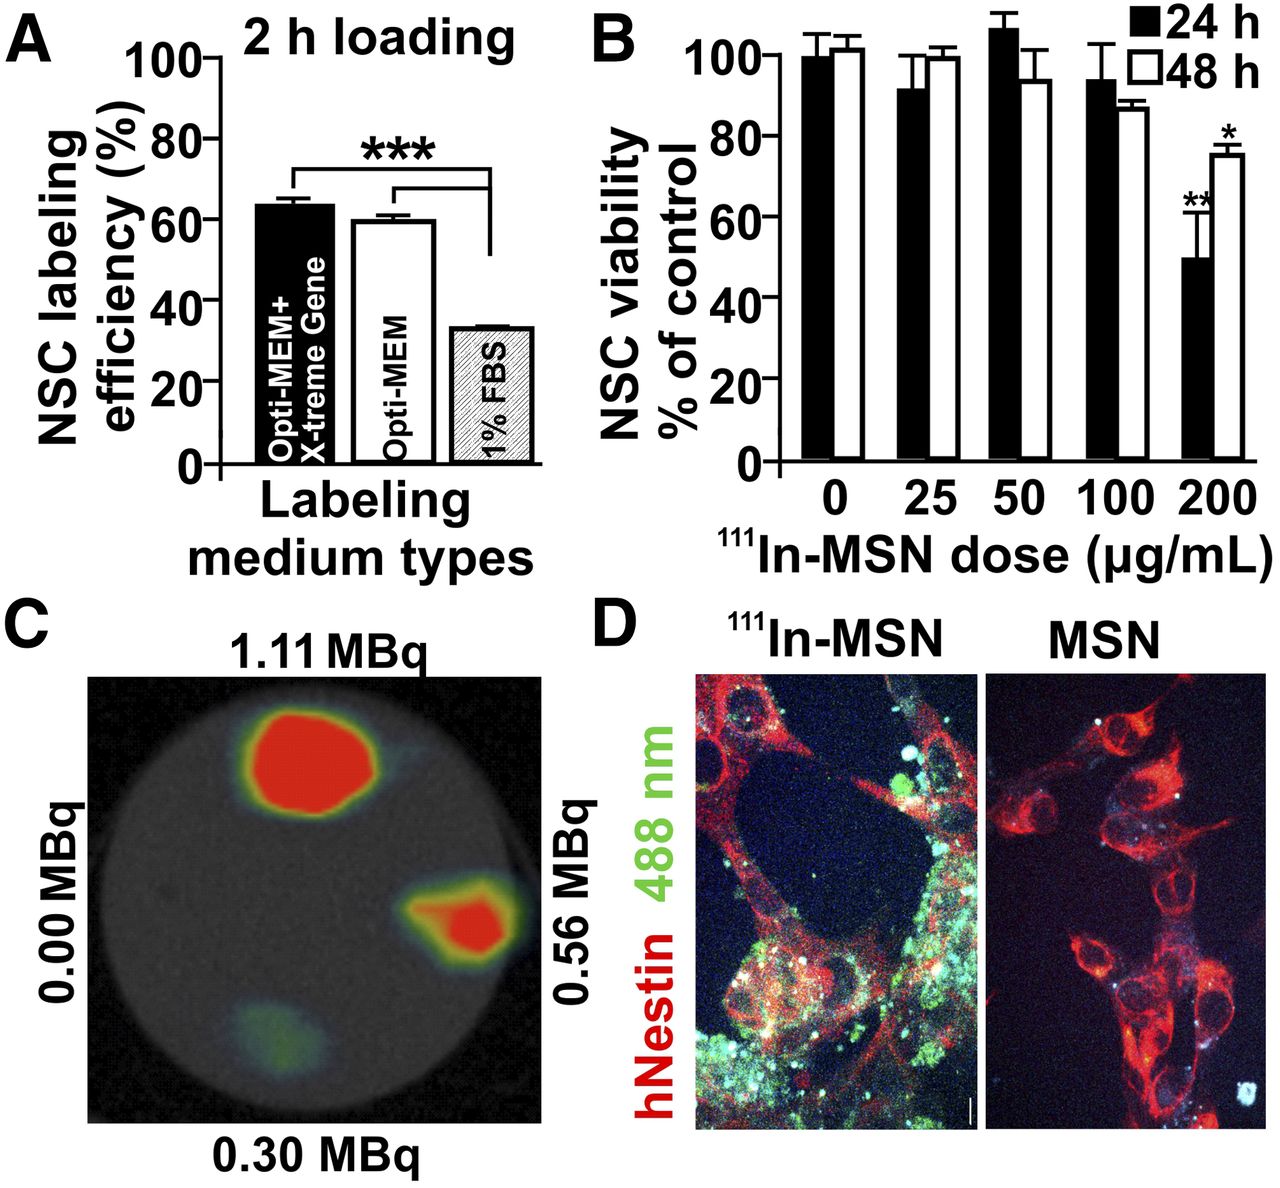
Loading of NSCs with 111In-MSN complex. (A) NSC culture medium conditions are a factor in loading efficiency of 111In-MSN. (B) Viability study for safe loading in NSCs demonstrated preservation of NSC viability at doses 100 μg/mL or less in 24 and 48 h. (C) Detection of 111In-MSN–loaded NSCs was validated via in vitro phantom study. (D) NSCs were visualized with phycoerythrin-conjugated antihuman nestin antibody (hNestin; red). Overlayed image of hNestin staining and fluorescence emitting decayed 111In-MSN excited at 488 nm (left). Nonradiolabeled MSNs in NSCs do not emit fluorescent signal (right). FBS = fetal bovine serum.
In Vivo SPECT Imaging of NSCs in Mouse Glioma Xenograft Model After Intracerebral Injection
For in vivo studies, athymic nude mice were implanted with a U87MG glioma cell line expressing cherry fluorescent protein in the right hemisphere of the brain. Three weeks later, control and tumor-bearing animals were inoculated with NSCs-fluc (expressing firefly luciferase) loaded with radiolabeled MSN in the left hemisphere of the brain for subsequent SPECT/CT imaging. CT coregistration clearly shows the NSCs and glioma cell injection sites (Fig. 3A). The 3-dimensional views of SPECT images of control mice revealed that signal corresponding to radiolabeled NSCs is strictly localized at the injection site at day 0, with no further distribution of the signal in days 1 and 2 after injection (Figs. 3B and 3C). Quantitative analysis of SPECT signal in 5 continuous slices of coronal view further confirmed this observation. In tumor-bearing animals, however, radiolabeled NSCs demonstrated robust migration as early as 4 h after injection (47 ± 1.3, P < 0.001) which was sustained throughout day 1 (34 ± 2.1, P < 0.001) and day 2 (44 ± 1.2, P < 0.001) after injection (Figs. 3B and 3C). Changes in the distribution at day 2 were highlighted by a more pronounced shift of the signal from the site of injection to the tumor site, with a definitive population of cells localized at the tumor implantation site. SPECT data corroborated bioluminescent imaging (BLI) of NSCs in control and tumor-bearing animals (Supplemental Fig. 3)
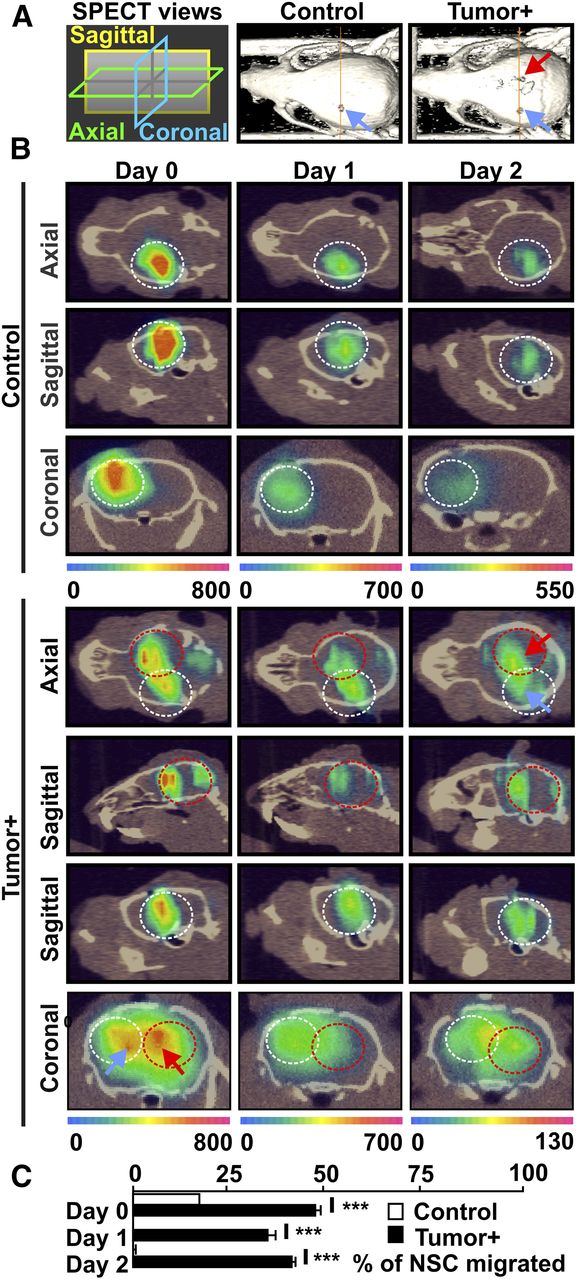
SPECT imaging of mouse brain after intracerebral delivery of NSCs loaded with 111In-MSN. (A) Three-dimensional reconstruction of cranial CT scan shows NSC and glioma cell injection sites. (B) Radiolabeled NSCs were implanted in left cerebral hemisphere of control mouse (n = 3). SPECT scans show focalized signal corresponding to radiolabeled NSCs at injection site at days 0, 1, and 2. Imaging of radiolabeled NSCs in tumor-bearing mouse shows signal extending from injection site (white dashed circle) toward tumor-bearing site (red dashed circle) as early as 4 h after injection with further distribution of signal at days 1 and 2 and increased presence at tumor site. (C) SPECT signal was quantified in both hemispheres as described in “Materials and Methods” section. ***P < 0.001, repeated-measures ANOVA with Bonferroni post hoc test.
Histologic Evaluation of Distribution of 111In-MSN–Labeled NSCs in Brain After Intracerebral Injection
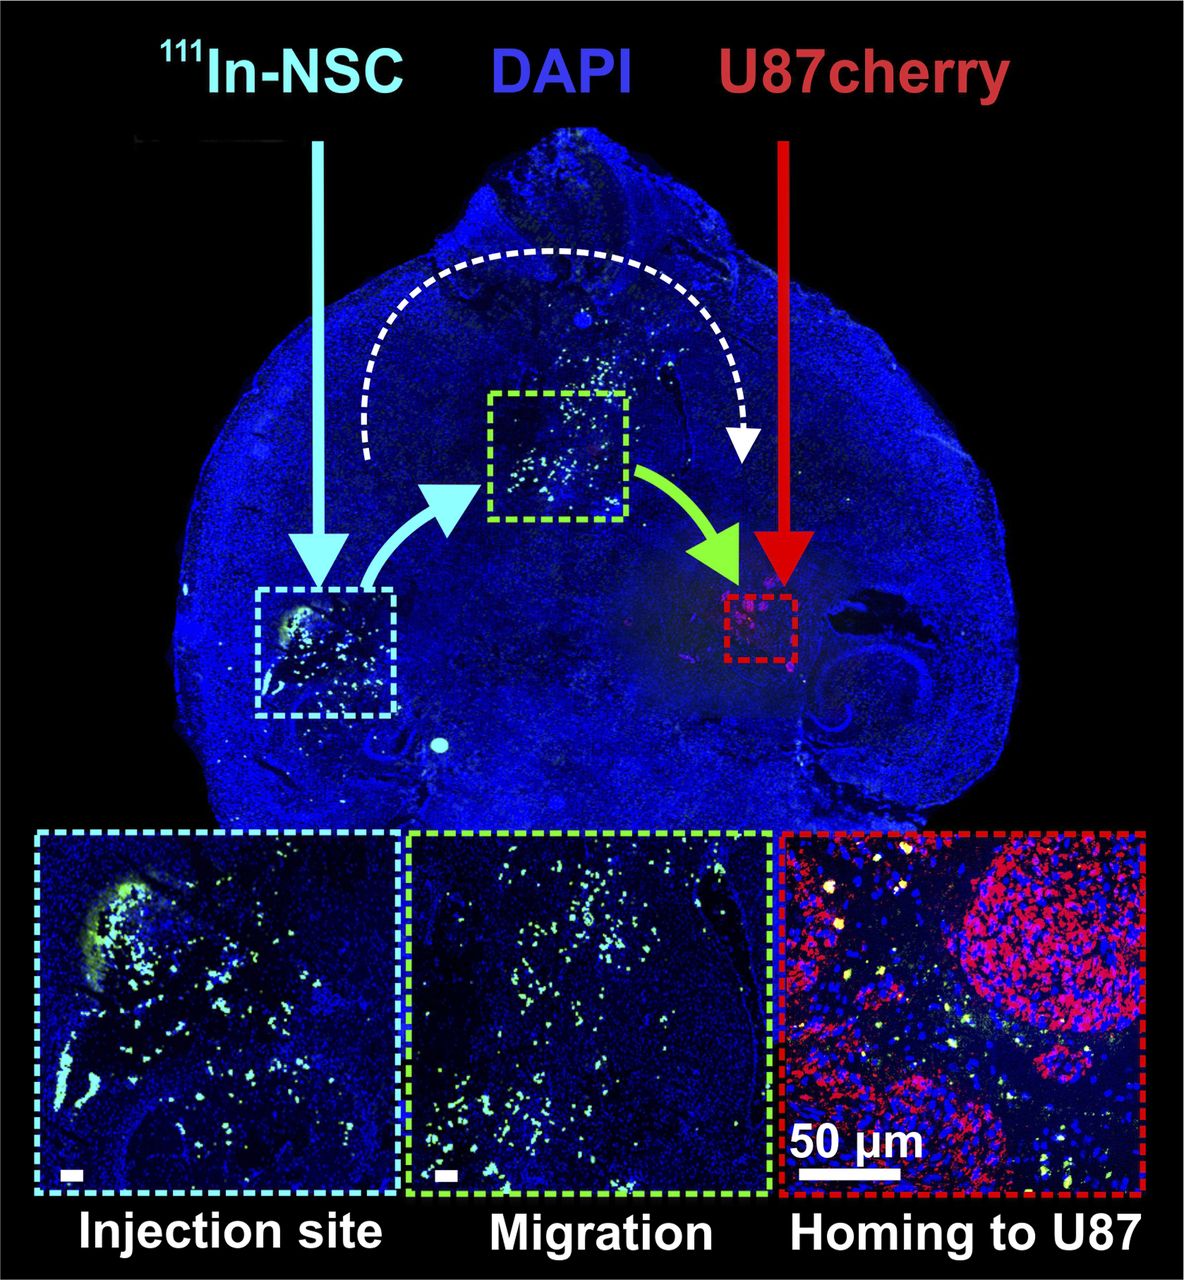
Brain tissues were harvested and snap-frozen for histology analysis. Brain sections (10 μm) were stained and scanned by the Pannoramic whole slide scanner (3DHistech Ltd.). Our discovery of decayed 111In-MSN–emitting fluorescence (peak at green spectrum, Supplemental Fig. 2) was used to identify radiolabeled NSCs in the brain tissue. Consistent with SPECT and BLI, histology demonstrated confinement of NSCs at the injection site without distribution in control animals (data not shown). In contrast, Figure 4 shows mobile NSC populations corresponding to distributed SPECT signals and, particularly, a population mobilized to the tumor site. Thus, with consistent evidence by immunocytochemistry, SPECT, and BLI, our data reliably distinguishes migrating NSCs in tumor-bearing animals (7,21,24).

Confirmation of tumor tropism of NSCs loaded with 111In-MSN in mouse brain by fluorescent microscopy. Whole-brain scan of tissue sections from tumor-bearing animal injected with NSCs loaded with 111In-MSN (green/cyan cells). NSCs can be seen at injection site, along migration path, and near U87cherry glioma xenograft. DAPI = 4′,6-diamidino-2-phenylindole.
Tracking 111In-MSN-NSCs in Mouse Brain After Systemic Injection
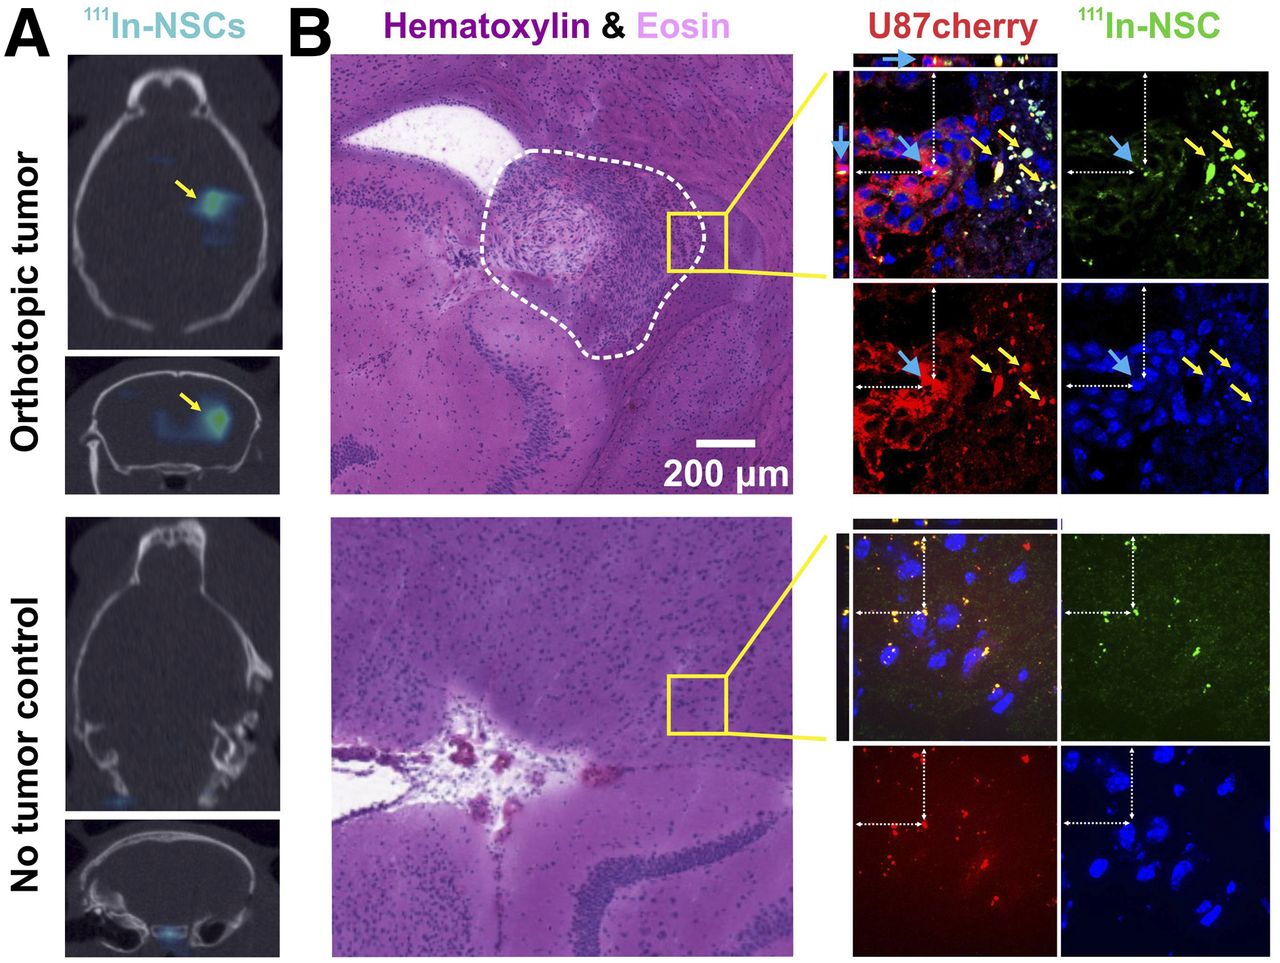
NSCs have been shown to traverse the blood–brain barrier and migrate toward brain tumors (25). To further validate our tracking system, we explored the ability to visualize NSCs labeled with 111In-MSN in the mouse brain by SPECT after systemic injection. Figure 5A shows effective homing of NSCs toward the orthotopic xenograft site in the right cerebral hemisphere (cyan mass; yellow arrow; top), whereas the naïve control animal shows only nonspecific signal (coronal view of the fourth ventricle; bottom). Histology confirmed the growth of U87MG glioma in the experimental animal showing a localized SPECT signal and lack of such in naïve control animals (Fig. 5B). Confocal microscopy revealed partial intratumoral penetration of migrating NSCs with most positioned peritumorally, 48 h after the systemic delivery (Fig. 5B, top). The timeline of systemic SPECT imaging of NSC migration is consistent with their dynamics crossing the blood–brain barrier (25). In contrast, the control tissue showed only a sporadic nonmigratory signal (Fig. 5B, bottom). Thus, SPECT confirmed the ability of radiolabeled NSCs to penetrate the blood–brain barrier from circulation and localize in the tumor area (Supplemental Fig. 6).

Tracking of NSCs in mouse brain after systemic injection. (A) SPECT imaging of 111In-MSN-NSCs after systemic injection in tumor-bearing (top) and control (bottom) animals. (B) Hematoxylin and eosin staining confirms orthotopic tumor growth (dashed white line) in experimental animals and normal structure of brain tissue in naïve control (lower). Confocal microscopy (yellow boxes) of adjacent tissue areas reveal strong homing behaviors of NSCs labeled with 111In-MSN (green; yellow arrows) near border of tumor mass (red), with occasional indications of intratumoral penetration by radiolabeled NSCs (blue arrow; orthogonal views). In contrast, naïve control tissue shows only sporadic residual SPECT signal of nonmigratory NSCs.
DISCUSSION
Several in vivo stem cell tracking methods have been developed to understand their fate after transplantation. For example, iron oxide nanoparticles have been used for tracking stem cells via MRI (11,26). PET and SPECT (11,27,28) have also applied to the experimental and clinical protocols for in vivo stem cell detection and their engraftment efficiency in the myocardium and other organs (29). Although bioluminescence and fluorescence optical imaging techniques have been successfully used in experimental animal models, their clinical relevance is lacking (30,31). MRI has significant limitations due to false-positive signals arising from macrophage engulfment of imaging vehicles, small hemorrhages, or iron depositions in the aging or degenerating brain (14,18,32,33). These limitations highlight the unmet need for additional in vivo stem cell tracking imaging modalities. Recent preliminary efforts in developing stem cell tracking strategies using nanoparticles and PET/MRI demonstrated the feasibility (34), but it requires further optimization and validation.
Our report uses SPECT for the in vivo tracking of migrating NSCs toward glioblastoma. Incorporation of PET or MRI coregistration of tumor along with SPECT could potentially enhance our knowledge of the behavior of stem cells in the brain. In addition, improvements in the loading capacity of SPECT isotopes in stem cells, the detection sensitivity, and the spatial resolution would also dramatically enhance the ability for in vivo stem cell tracking. The sensitivity and spatial resolution of the system could be significantly enhanced using advanced imaging equipment. Cai et al. reported the development of an ultrahigh-resolution MR-compatible SPECT system capable of providing a sub-500-μm imaging resolution (35). Meng et al. demonstrated that a dual-head camera single photon emission experimental system allowed the imaging of less than a thousand T cells inoculated in the brain corresponding to only 444 Bq of 125I activity (36). This system can be readily translated into a full SPECT system for tracking of a small number of cells in vivo (37). We anticipate that the amount of 111In-MSN suitable for labeling of NSCs and established in our study will be sufficient for tracking of NSCs in clinical applications. In current clinical trials (NCT01172964; NCT02015819), patients with glioblastoma multiforme receive 50–100 times more NSCs in the resection cavity than intracranially injected in mice. It is, therefore, expected that the amount of radioactivity presented by NSCs (∼101.75 MBq of 111In corresponding to 5 × 10⁷ NSCs) will be sufficient to generate reliable SPECT signals. In fact, Gholamrezanezhad et al. demonstrated that 111In-oxine–labeled MSCs injected in the patients (74–266.4 MBq of 111In-oxine activity corresponding to 400 × 106 of systemically injected MSCs) could be imaged in multiple organs over days and were safe in patients with liver cirrhosis (38). The range of radioactivity sufficient for the tracking of NSCs within the human brain will be determined in future studies.
CONCLUSION
Our data demonstrate that NSCs labeled with 111In-MSN can be tracked as they migrate toward intracranial glioma xenografts by SPECT imaging; this imaging modality allowed the detection of NSC distribution in the brain after intracranial and systemic injections. Collective SPECT data corroborate BLI and confocal microscopy. Finally, our study suggests that this noninvasive in vivo imaging platform could help generate new knowledge of therapeutic stem cell behaviors, thus further advancing them into clinical practice.
DISCLOSURE
The costs of publication of this article were defrayed in part by the payment of page charges. Therefore, and solely to indicate this fact, this article is hereby marked “advertisement” in accordance with 18 USC section 1734. This work was supported by funding from the NIH/National Institute of Neurological Disorders and Stroke (RO1 NS087990), the NIH/National Institute for Biomedical Imaging and Bioengineering (RO1 EB011640), and in part by funding provided by the Virginia and D.K. Ludwig Fund for Cancer Research via the Imaging Research Institute in the Biological Sciences Division, by the University of Chicago Comprehensive Cancer Center, and by the Department of Radiology at the University of Chicago. This project was also supported in part by the National Center for Advancing Translational Sciences of the National Institutes of Health through grant UL1 TR000430. The research of nanomaterials design and synthesis reported in this publication was also partially supported by BN-103-PP-04 and NM-103-PP-01 from the National Health Research Institutes of Taiwan and NSC102- 2113-M-400-001-MY3 from the National Science Council of Taiwan. Metal analysis was performed at the Northwestern University Quantitative Bioelemental Imaging Center generously supported by NASA Ames Research Center grant NNA04CC36G. Confocal imaging was performed at the University of Chicago Integrated Light Microscopy Facility. Karen S. Aboody is an uncompensated Board Member, Chief Scientific Officer, and shareholder of TheraBiologics. No other potential conflict of interest relevant to this article was reported.
Footnotes
↵* Contributed equally to this work.
Published online Nov. 12, 2015.
- © 2016 by the Society of Nuclear Medicine and Molecular Imaging, Inc.
REFERENCES
- Received for publication June 30, 2015.
- Accepted for publication November 9, 2015.


Jump to section
Related Articles
Cited By...
- No citing articles found.