


Abstract
The role of CT in PET/CT imaging includes acquisition techniques for diagnostic, anatomic localization, and attenuation correction purposes. Diagnostic reference levels of the volumetric CT dose index (CTDIvol) are available for dedicated CT procedures on selected body regions, but similar reference levels for whole-body CT used in PET/CT examinations are limited. This work reports CTDIvol values from sites that conduct whole-body oncologic PET/CT examinations and participated in the scanner validation program of the Society of Nuclear Medicine and Molecular Imaging Clinical Trials Network. Methods: From 2010 to 2014, a total of 154 sites submitted CT acquisition parameters used in their clinical 18F-FDG PET/CT oncology protocols. From these parameters, the CTDIvol was estimated using the ImPACT CTDI dosimetry tables. Histograms of CTDIvol values were created for each year, and descriptive statistics, including mean, median, and 75th percentile, were reported. Repeated-measures ANOVA was performed to determine whether significant differences occurred between reporting years. Results: A wide range of technical parameters was reported, most notably in tube current. Between 2010 and 2014, the median CTDIvol ranged from 4.9 to 6.2 mGy and the 75th percentile from 9.7 to 10.2 mGy. There was no significant change in CTDIvol between reporting years (repeated-measures ANOVA, P = 0.985). Conclusion: The 75th percentile CTDIvol reported in this work was 9.8 mGy averaged over all reporting years. These data provide a resource for establishing CTDIvol reference values specific to performing CT in PET/CT whole-body examinations. The wide ranges of CT acquisition parameters reported by sites suggest that CTDIvol reference levels may be beneficial for optimization of CT protocols.
The development of PET/CT systems has permitted concurrent anatomic and functional imaging of organs and lesions that allows better evaluation of disease (1,2). The CT components of PET/CT systems are equivalent in power output to their stand-alone versions and may be used for diagnostic purposes under appropriate CT technique. In addition to diagnostic acquisitions, the application of CT in hybrid PET/CT scanners may serve other specific purposes, including attenuation correction of the PET image data (3). For attenuation correction purposes, CT techniques have been proposed that yield lower doses because diagnostic image quality is not of primary importance.
The CT dose measurement concept is based on the CT dose index (CTDI), which represents the average absorbed dose from irradiation of contiguous slices. Absorbed dose is the mean energy deposited per unit of mass from the ionizing radiation interactions in a calibrated ion chamber. The CTDI for body examinations is measured from 1 full-axial-rotation scan using a 100-mm-long pencil ion chamber placed in the center and again in the periphery slots of a 32-cm phantom. These 2 measurements are termed CTDI100x, where the subscript represents the axial extent of the data collection in millimeters and the superscript represents the ion chamber location in the phantom. The center and periphery measurements are combined into a weighted sum, CTDIw = 1/3 × CTDI100center + 2/3 × CTDI100periphery, meant to represent the average dose across the entire phantom. The CTDIw is then divided by the pitch factor to accommodate gaps or overlay in contiguous CT projections (i.e., a volume), and the subscript is changed again to indicate this normalization (CTDIvol) (4).
Dose characterization, optimization, and reference levels based on the CTDI concept have been well studied and understood for diagnostic CT (4–6). Various organizations in the United States and Europe have established dose reference levels for diagnostic CT based on the 75th percentile of CTDI values recorded from national surveys of different body regions (5). For example, the American College of Radiology has established CTDIvol dose reference levels for diagnostic head CT (CTDIvol ≤ 75 mGy) and abdominal CT (CTDIvol ≤ 25 mGy) (7).
An 18F-FDG PET/CT examination has potential for high patient dose from the combination of the x-rays used to acquire the CT image and the radiotracer administered into the patient to acquire the PET image. The methodology to estimate the radiation exposure of patients receiving 18F-FDG has been well studied and understood (8). Generally, administered 18F-FDG activities range from 1.25 to 5 MBq/kg, depending on the sensitivity of the PET scanner (2- or 3-dimensional) (9), which equates to a whole-body effective dose of approximately 8.4 mSv for a 70-kg patient who receives an activity concentration of 5 MBq/kg. Including CT as part of a PET/CT examination can raise the total effective dose to as high as approximately 26 mSv (10–13). But estimates of PET/CT effective dose are variable and critically depend on an institution’s specific CT technique and activity administration protocol (14). In general, the CT component of a PET/CT examination can contribute more than 50% of the total-examination effective dose (10–13).
Unlike diagnostic CT, published dose reference levels for CT used in hybrid PET/CT examinations are limited. To provide reference level recommendations, it is appropriate to gain an understanding of the CTDIvol range used in oncologic PET/CT protocols. As part of the scanner validation program of the Society of Nuclear Medicine and Molecular Imaging (SNMMI) Clinical Trials Network (CTN) (15), PET and CT technical parameters were collected through a survey on clinical oncology scanning techniques. This work presents the survey results and estimates of CTDIvol from sites participating in the SNMMI CTN program.
MATERIALS AND METHODS
From 2010 to 2014, 273 sites participating in the SNMMI CTN scanner validation program reported PET and CT acquisition parameters from 282 PET/CT systems. For CT, the parameters collected included peak tube potential, tube current, rotation time, pitch, slice configuration, and collimation. The make and model of CT scanner were determined from the manufacturer’s service manuals and published literature reporting National Electric Manufacturers Association performance measurements. For sites involved in active trials using the SNMMI CTN scanner validation program, the validation process was performed annually and included repeated collection of the site’s CT acquisition parameters for each yearly cycle.
The dosimetry software package ImPACT (version 1.0.4, St. George’s Healthcare NHS Trust) was used to determine the CTDIvol for the body phantom (32-cm polymethyl methacrylate) based on the scanner model and reported CT parameters. The CTDIvol tables from ImPACT are constructed using the measurement techniques described above and are applied extensively to validate CTDIvol Monte Carlo simulations (16–19). The tube current reported by the sites was assumed to be fixed, though 7 sites reported use of automatic current modulation software.
CTDIvol data were compared by plotted histograms for the years 2010 to 2014. Descriptive statistics were calculated, including the mean, median, and 75th percentile. Changes in CTDIvol for a PET/CT system across reporting years were examined using a 1-way repeated-measures ANOVA that assumed a missing data point for sites that did not contribute CT parameters for estimating CTDIvol in any single year. Statistical significance was determined by a P value of less than 0.05, and the analysis was conducted with SAS statistical software (SAS Institute Inc.).
RESULTS
Of the 273 sites participating in the SNMMI CTN scanner validation program, 154 provided complete datasets. Of these, 158 different PET/CT systems contributed a total of 232 datasets between 2010 and 2014 for estimating CTDIvol from the ImPACT tables. Sixty-one of 158 systems provided datasets for 2 or more years, 13 of 158 systems provided datasets for 3 or more years, and none provided datasets for 4 or more years. Table 1 shows the number of systems by manufacturer, total number of datasets submitted, range of installation year, and parameters recorded from the site surveys. There was a large range in acquisition parameters across vendors. The largest variations were in tube current, which ranged from approximately 20 to 450 mA. Additionally, there were large variations in pitch, which ranged from 0.5 to 2, and in collimation, which ranged from 5 to 40 mm.
CT Parameters Collected from 154 Sites for 2010–2014
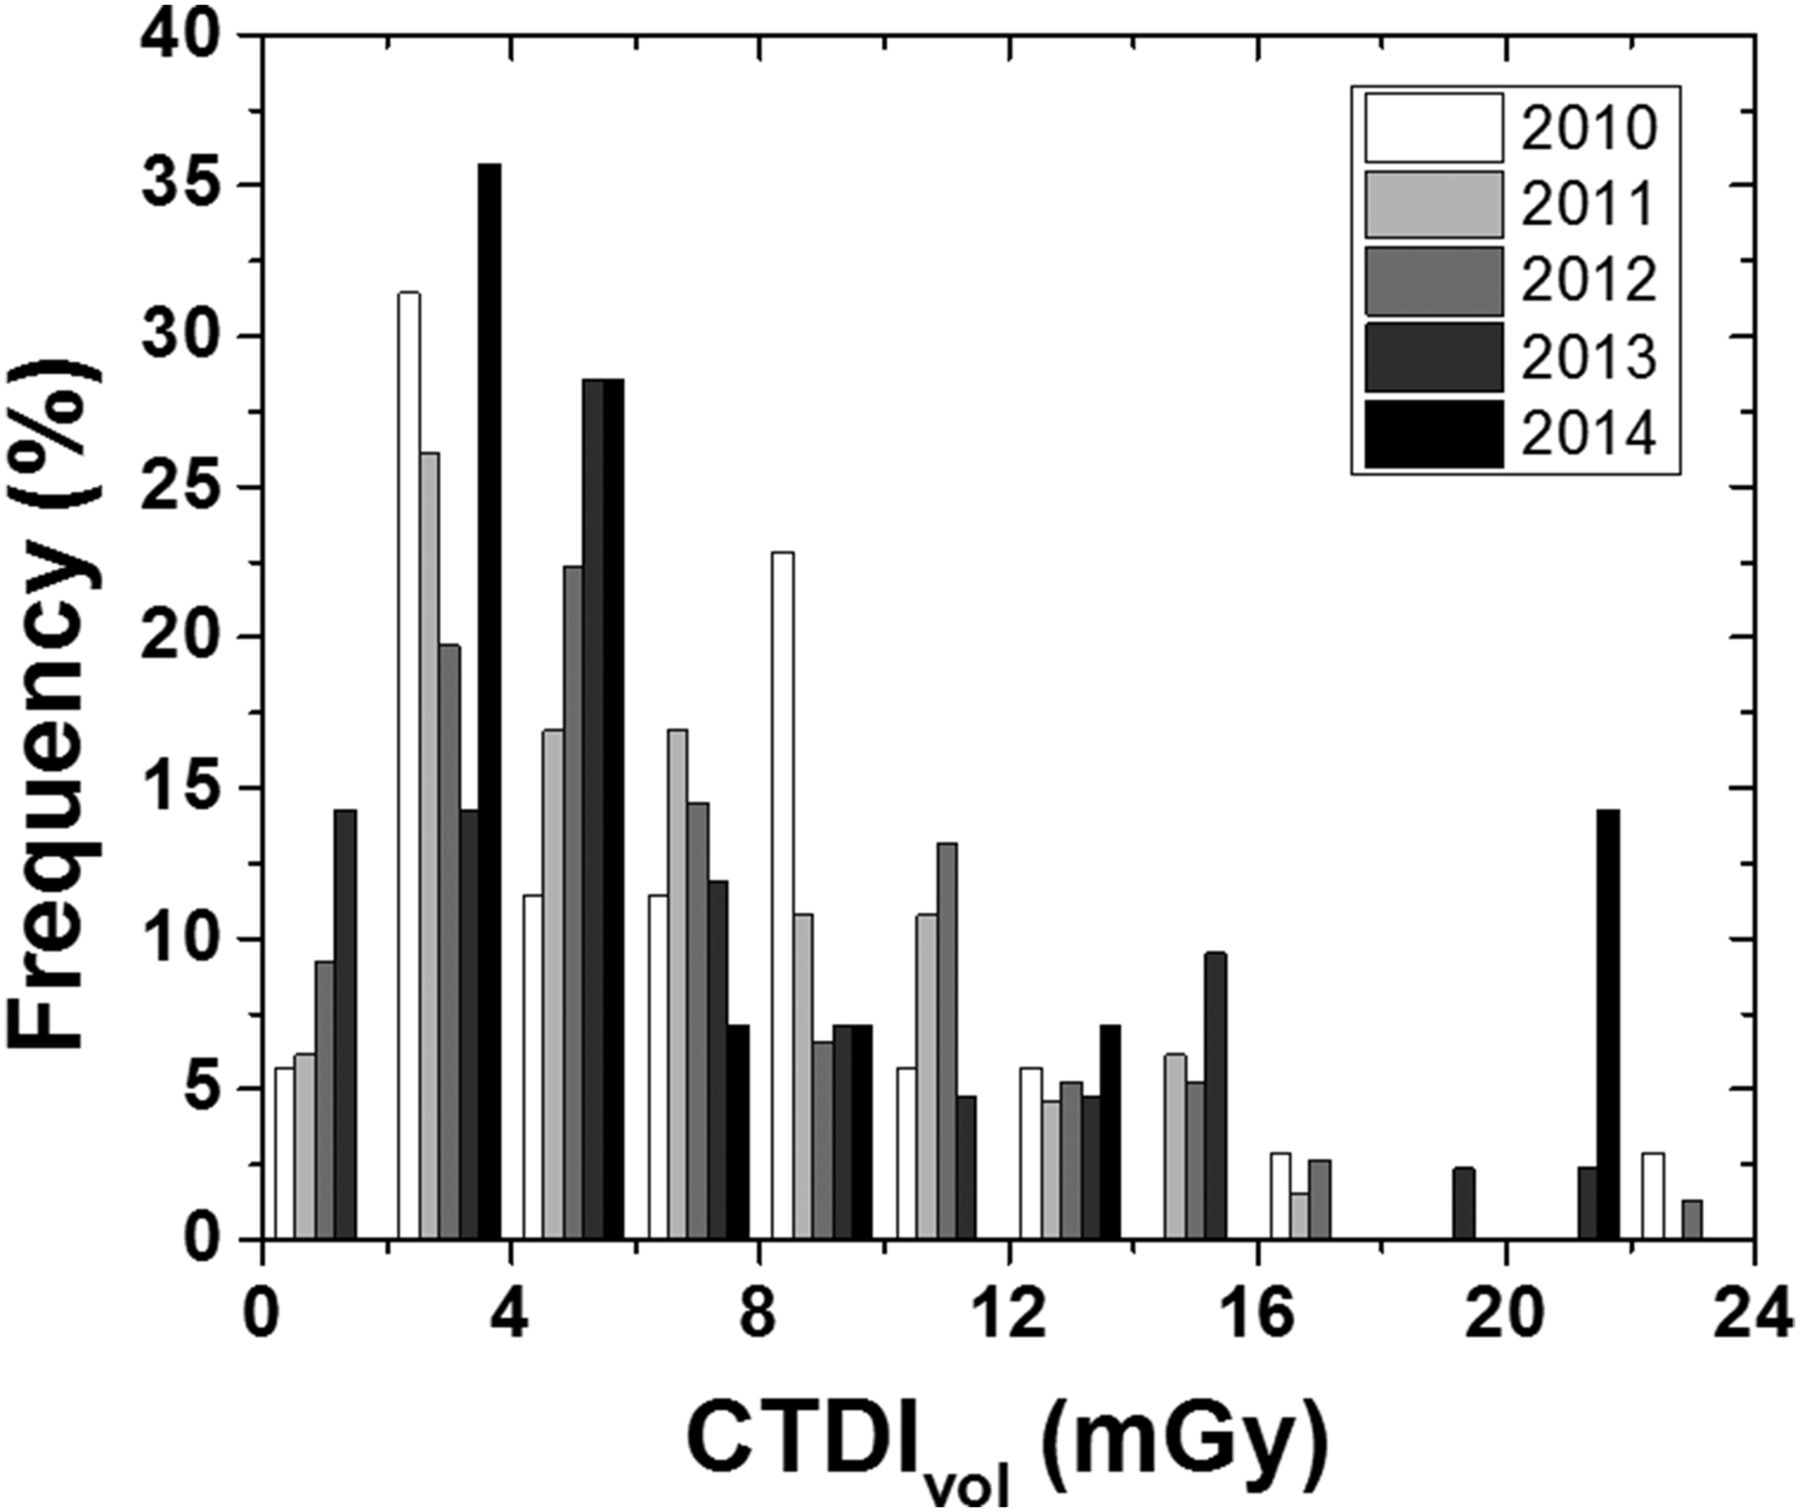
Table 2 summarizes the CTDIvol values from 2010 to 2014. Overall, CTDIvol was similar across years, and repeated-measures ANOVA yielded no significant differences between reporting years (P = 0.985). A histogram of CTDIvol from 2010 to 2014 is shown in Figure 1. The distribution is skewed toward higher CTDIvol values compared with the mean value, but the distributions show a wide range of CTDIvol operating levels.
CTDIvol for 2010–2014

Frequency histogram of CTDIvol for 2010–2014.
DISCUSSION
The objective of this study was to report the CT dose metric CTDIvol for whole-body oncologic PET/CT protocols submitted to the SNMMI CTN scanner validation committee. There is limited guidance on CT dosimetry metrics in the literature on nuclear medicine practice standards, and many of these reports reference dedicated diagnostic CT practice standards, which may not be appropriate for CT in PET/CT. Of the limited documentation on CT technique for oncologic PET, there is general acceptance that CT dose is tailored to its purpose in the reconstruction or interpretation process (14,20). For example, acquisition protocols may be designed to achieve high image quality while considering patient dose (10,12), compensate for the PET temporal resolution (21,22) or collect ultra-low-dose attenuation correction data (23). The wide range of CTDIvol values reported in this work likely represents an aggregate summary of these techniques.
There are a limited number of studies investigating the optimization of CT technique and image quality for oncologic PET/CT. Most of these studies have focused on lowering estimates of effective dose while maintaining high image quality using the Alderson RANDO anthropomorphic phantom (The Phantom Laboratory) (10,11,24). In these studies, effective dose was calculated using thermoluminescent dosimetry measurements (25), published conversion factors (26), or dosimetry software tools (27). These tools may be used to estimate effective dose using the results reported in Table 2, but the judgment on image quality will depend on the clinical indication and preferences of the individual institutions.
A comparative study to this work was a national survey conducted by the French Society of Nuclear Medicine on whole-body PET/CT oncologic procedures from 56 PET/CT units totaling approximately 1,000 examinations. The mean and 75th percentile CTDIvol was equal to 6.6 and 7.7 mGy, respectively (28). The mean value agreed well with the data reported in Table 2, and the lower 75th percentile may suggest a narrower CTDIvol distribution.
A few assumptions were made about the calculations derived from site data submitted through the survey. CTDIvol values from newer-model CT scanners not in the ImPACT tables were substituted for older models from the same manufacturer using the same collimation configuration. The amperage reported by sites was assumed to be a maximum value and fixed; however, 7 of 158 sites reported the use of automatic current modulation, which produces images of constant image quality (i.e., similar noise properties in the table direction) and reduces radiation dose (29). Since radiation dose is proportional to CTDIvol, which is proportional to tube current, 7 of 158 sites included in this work may have CTDIvol estimates higher than their true operating protocol. This possibility could contribute to a positive bias in the values reported in Figure 1 and Table 2.
CONCLUSION
This work provides valuable national survey data on CT dose metrics used in PET/CT oncologic imaging. The 75th percentile for CTDIvol was approximately 9.8 mGy averaged over all reporting years. These data can serve as reference levels for institutions conducting oncologic PET/CT imaging and may assist in the optimization of their CT protocols.
DISCLOSURE
The costs of publication of this article were defrayed in part by the payment of page charges. Therefore, and solely to indicate this fact, this article is hereby marked “advertisement” in accordance with 18 USC section 1734. No potential conflict of interest relevant to this article was reported.
Acknowledgments
We kindly thank Jina Kim, Tina Kiss, and Bonnie Clarke of the SNMMI for their hard work in administering the CTN scanner validation program and its database.
Footnotes
Published online Nov. 12, 2015.
- © 2016 by the Society of Nuclear Medicine and Molecular Imaging, Inc.
REFERENCES
- Received for publication May 5, 2015.
- Accepted for publication October 27, 2015.


