


Abstract
The objective of this study was to assess the predictive value of early assessment (after 1 cycle of induction chemotherapy [IC]) with 18F-FDG PET/CT and diffusion-weighted (DW) MRI for subsequent response to radical chemoradiotherapy in locally advanced head and neck squamous cell carcinoma (HNSCC). Methods: Twenty patients with stage III–IVa HNSCC prospectively underwent 18F-FDG PET/CT and DW MRI before and 2 wk after each cycle of IC (first cycle, IC1; second cycle, IC2). Response was assessed 3 mo after completion of chemoradiotherapy with clinical examination, MRI, and 18F-FDG PET/CT. Patients with persistent disease were classed as nonresponders. Changes in functional and molecular imaging parameters after IC1 were compared between responders and nonresponders with the Mann–Whitney U test. The significance threshold was set at a P value of less than 0.05. Results: Responders showed a significantly greater reduction in metabolic tumor volume (P = 0.03) and total lesion glycolysis (P = 0.04) after IC1 than nonresponders. Responders also showed a tendency toward a larger but statistically nonsignificant increase in apparent diffusion coefficient after IC1. There was no significant difference in the changes from baseline between the IC1 and IC2 for all functional and molecular imaging parameters, indicating that most biologic response to IC measured by 18F-FDG PET/CT and DW MRI was observed early after the first cycle of IC. Conclusion: Our preliminary data indicate that the 18F-FDG PET/CT–derived metabolic tumor volume or total lesion glycolysis, acquired after IC1, are early predictive biomarkers for ultimate response to subsequent chemoradiotherapy. These early biomarkers enable identification of patients at risk of treatment failure at an early time point, permitting treatment individualization and consideration of alternative strategies such as radiotherapy dose escalation or surgery.
Induction chemotherapy (IC) remains a contentious aspect of management for locally advanced head and neck squamous cell carcinoma (HNSCC). To date, 4 phase III randomized controlled trials have investigated the role of IC before chemoradiotherapy for locally advanced HNSCC. Only 1 study showed an overall survival benefit (1). Nevertheless, it is noteworthy that the negative studies had limitations, with poor accrual, inadequate power, and low radiotherapy completion rates (2–4).
Despite contradictory evidence regarding its overall survival benefit, IC remains a standard-of-care in organ-sparing approaches in laryngeal cancer and appears to reduce distant failure rates in HNSCC (5,6). Good response to IC has been reported to be predictive of complete response to subsequent radiotherapy and long-term disease control (7,8). This concept has led to randomized clinical trials such as ECOG-1308 and Quarterback, which are investigating radiotherapy dose reduction in human papillomavirus (HPV)–driven stage III–IV oropharyngeal cancer using complete response to IC as a selection criterion (9). Conversely, patients with poor response to IC are at a higher risk of radiotherapy failure and require treatment intensification. Despite being an attractive strategy, IC is associated with increased rates of complications (10). Therefore, an early predictive biomarker is essential to identify those who will or will not benefit.
Functional and molecular imaging (FMI) characterize the tumor phenotype by providing quantitative information on biologic processes such as metabolic activity, vascularity, and cellularity (11). Biologic changes measured by FMI are usually evident before morphologic changes (12), and this confers a potential advantage over conventional imaging for early response assessment. Several studies have identified 18F-FDG PET/CT and diffusion-weighted MRI (DW MRI) as promising imaging biomarkers for HNSCC (13–16), with different, but complementary, biologic information from each modality (17). Most FMI studies are largely based on post-IC imaging, but an earlier time point for assessment during IC is required to allow time for an individualized treatment plan based on tumor response to therapy.
To address these issues, we established a prospective multimodality longitudinal FMI study (INSIGHT) in locally advanced HNSCC patients scheduled for radical chemoradiotherapy (18). Here, we report the results of serial 18F-FDG PET/CT and DW MRI after each cycle of IC in the first 20 patients (target accrual, 66). The purpose of this planned interim analysis is 3-fold: to assess the appropriateness of early assessment after 1 cycle of IC with 18F-FDG PET/CT and DW MRI by comparing the difference in changes of FMI parameters between the first and second cycle, to identify FMI parameters predictive of ultimate response to subsequent radical chemoradiotherapy, and to identify a biologic target volume in the event of persistent disease.
MATERIALS AND METHODS
Study Design
Patients were recruited at The Royal Marsden Hospital between July 2013 and February 2015. Patients with previously untreated histologically proven HNSCC (stage III–IVb) and World Health Organization performance status 0–2 planned for radical chemoradiotherapy, with or without IC, were eligible for the study. This study received approvals from the institutional review board (CCR3926) and research ethical committee (13/LO/0067). All patients provided written consent.
Our standard regimen of IC is 2 cycles of 3 weekly TPF (docetaxel [75 mg/m2] day 1/cisplatin [75 mg/m2] day 1/5-fluorouracil [1,000 mg/m2] days 1–4). Modifications were permissible for individual patient factors, for example, tinnitus, renal impairment, and peripheral neuropathy. Patients prospectively underwent 18F-FDG PET/CT and DW MRI at baseline and 2 wk after each cycle of IC (first cycle, IC1; second cycle, IC2). Three weeks after IC, patients proceeded to 6 wk of radical radiotherapy with concomitant chemotherapy (cisplatin [100 mg/m2] or carboplatin [AUC5] days 1 and 29). Macroscopic and microscopic disease (defined on prechemotherapy imaging) received 65 and 54 Gy in 30 fractions, respectively, using intensity-modulated radiotherapy with a simultaneous integrated boost. Response was assessed at 3 mo after completion of chemoradiotherapy with MRI, 18F-FDG PET/CT, and clinical examination including nasendoscopy. Patients with evidence of persistent disease at 3 mo were classed as nonresponders.
PET/CT Image Acquisition
PET/CT studies were acquired using Phillips Gemini (London) and Siemens mCT (Sutton) PET/CT scanners. Patients fasted for 6 h before the study. 18F-FDG (400 MBq) was injected intravenously if the blood sugar level was less than 10 mmol/L. Before PET acquisition, patients rested for 60 min. Patients were positioned on a flat-top couch in their radiotherapy treatment position, using a headrest and 5-point thermoplastic shell. Emission data were acquired from the base of skull to carina (3 min/bed; average 2 bed acquisition). Unenhanced, low-dose CT was performed from the base of skull to carina for purposes of attenuation correction and image fusion for anatomic localization (approximate mAs, 50/slice).
MR Image Acquisition
All MR images were acquired on a 1.5-T scanner (MAGNETOM Aera; Siemens Healthcare). Patients were set up on a flat-top MRI couch in the radiotherapy treatment position, using a headrest and 5-point thermoplastic shell. Large flex and spine coils were used. For all images, a 200 × 200 mm field of view, 2-mm isotropic voxel size, and 80-mm craniocaudal coverage were used. Anatomic T2-weighted (matrix, 192; echo time/retention time, 82/11,000 ms) and T1-weighted (matrix, 192; echo time/retention time, 13/794 ms) images were acquired first to aid functional MRI planning. DW MRI sequences (spin-echo echo-planar imaging DW imaging; matrix, 96; echo time/retention time, 61/13,400; b values, 50,400,800 s/mm2; number of signal averages, 5; field of view, 199 × 199; bandwidth, 1,000 Hz) were then acquired.
Image Analysis
All PET and MRI data were analyzed using RayStation (version 4.6.1; RaySearch Medical Laboratories), a radiotherapy treatment-planning system. RayStation (internally validated for data accuracy) was chosen for its ability to handle large longitudinal multimodality image sets and incorporate radiotherapy dosimetry. Regions of interest (ROIs) encompassing the primary tumor (PT) or involved lymph nodes (LNs) were delineated on each imaging modality by a radiation oncologist. These contours were verified by experienced consultants in nuclear medicine and radiology.
PET images reconstructed using ordered-subset expectation maximization were used for analysis. Two methodologies were used to generate the metabolic tumor volume (MTV): relative threshold of 40% of maximum SUV (SUVmax) (MTV40%) and fixed threshold of SUV3.5 (MTV3.5). The baseline value served as the threshold for MTV on subsequent scans. Other PET parameters including SUVmax and total lesion glycolysis (TLGn = SUVmean × MTVn; n = 3.5 or 40%) (19) were recorded for all ROIs at each time point.
Anatomic contours for MRI were delineated on T2-weighted images with reference to T1-weighted images. For DW analysis, ROIs were defined on the T2-weighted low b value images (b50) with reference to the coregistered anatomic contours, excluding regions of necrosis and cysts (Fig. 1). This accounts for potential local deformation of DW images in the vicinity of air-tissue interfaces and dental objects. All b values were used to calculate the apparent diffusion coefficient (ADC). Because of the skewed distribution of ADC values, the median value was chosen as the statistical representation for individual ROI. ADC was recorded separately for PT and LNs.

(A) Panel of serial PET/CT, T2-weighted, b50, and ADC images (from left to right) alongside respective ROI contours in patient with T2N2bM0 HPV-positive oropharyngeal squamous cell carcinoma. (B) Example of ROI definition on ADC maps with reference to anatomic image (T2-weighted). Arrows highlight active exclusion of necrotic/cystic regions in right level II LNs.
The radiotherapy planning CT and dosimetry were imported to enable dosimetric analysis. Good coregistrations between FMI and planning CT were achieved due to immobilization, allowing rigid transformation of contours across all images.
Statistical Analysis
The data were analyzed using SPSS statistical software (version 21.0; IBM Corp.). Depending on the normality of the data distribution (using the Kolmogorov—Smirnov test), the changes in PET and DW MRI parameters from baseline were compared between IC1 and IC2 using the paired t test (normal) or Wilcoxon signed-rank test (nonnormal). Changes in FMI parameters after IC1 were compared between responders and nonresponders using the Mann–Whitney U test. The significance threshold was set at a P value of less than 0.05. Receiver-operator-characteristics analysis was used to identify and determine the optimal threshold values for parameters with predictive value.
RESULTS
Clinical Characteristics
Patient and treatment characteristics are shown in Table 1. Seventeen of 20 patients underwent 2 cycles of IC; 3 patients stopped IC after 1 cycle because of poor tolerance. One patient did not receive concomitant chemotherapy because of persistent myelosuppression after IC. All patients completed chemoradiotherapy within 42 d. Median follow-up was 14 mo (range, 7–25 mo).
Summary of Patient and Tumor Characteristics
Treatment Outcome
There were 15 responders and 5 nonresponders. One responder underwent a modified radical neck dissection due to equivocal radiologic appearance after chemoradiotherapy, but no viable residual disease was found. At the time of analysis, all responders remained alive and disease-free. All 5 nonresponders had locoregional failure: 2 also developed distant metastases. Only 1 patient was deemed suitable for salvage surgery and underwent radical pharyngolaryngectomy. This patient remains disease-free to date. The remaining 4 nonresponders had died by the time of analysis (5–9 mo after chemoradiotherapy).
FMI: Responders Versus Nonresponders
Baseline MTV40%, MTV3.5, TLG40%, and TLG3.5 differed significantly between the 2 groups but not for SUVmax and SUVmean (Table 2). Responders also showed a significantly greater mean reduction in MTV3.5, TLG3.5, and TLG40% after IC1 than nonresponders. The reductions in SUVmax and SUVmean were not discriminative between the 2 groups after IC1 but did reach statistical significance after IC2 (P = 0.01 and 0.037, respectively). There was a clear association between MTV or TLG response and HPV status (Fig. 2).
Comparison of FMI Parameters Between Responders and Nonresponders

Box plots of changes after IC1, grouped by HPV status, for MTV3.5 (A), MTV40% (B), TLG3.5 (C), TLG40% (D), and cumulative ADC (PT and LNs) (E).
There was no significant difference in pretreatment ADC for both PT and LNs between the 2 groups (Table 2). For patients with discernible tumor after IC1, the mean ADC for PT was higher in responders than nonresponders, but this did not reach statistical significance (P = 0.089). LNs in responders also showed a greater, but statistically nonsignificant, increase in ADC after IC1 than those in nonresponders. The changes in ADC after IC2 remained nondiscriminative between responders and nonresponders for both PT (P = 0.343) and LNs (P = 0.658). The pretreatment mean ADC was significantly lower in the LNs for HPV-positive than HPV-negative HNSCC (0.95 ± 0.13 vs. 1.07 ± 0.15 × 10⁻³ mm2/s, P = 0.025), but no difference was observed in the PT (1.15 ± 0.18 vs. 1.16 ± 0.14 × 10⁻³ mm2/s, P = 0.93). Cumulatively, a tendency toward a larger increase in ADC after IC1 was observed in HPV-positive tumors (Fig. 2).
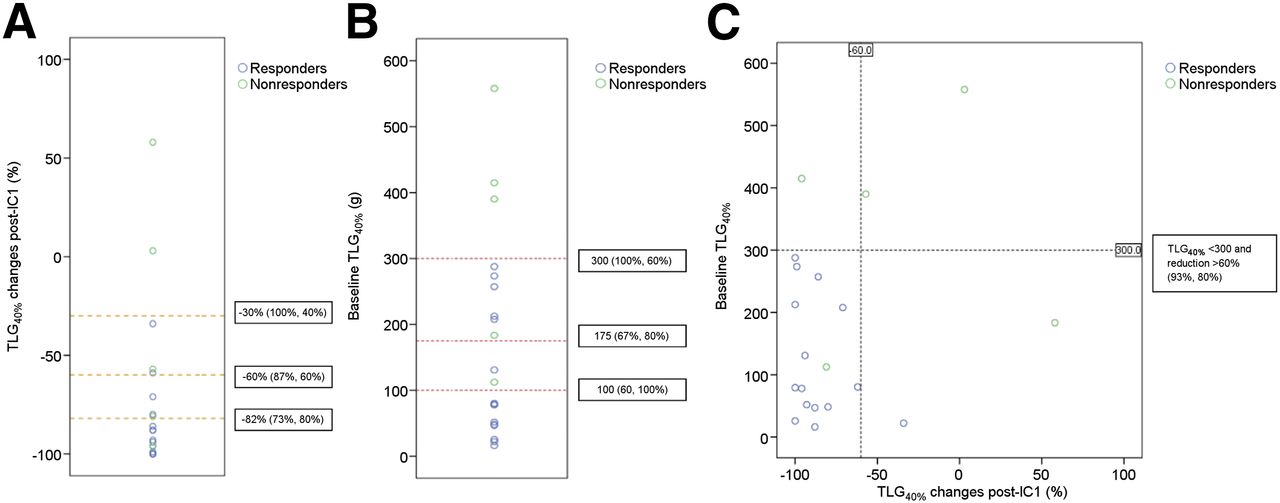
T stage (T1–2 vs. T3–4), N stage (N0–1 vs. N2–3), and tumor grade (G1–2 vs. G3) were all nonpredictive of response to chemoradiotherapy (P > 0.05). Receiver-operator-characteristics analyses identified TLG40% as the optimal predictive parameter for treatment response using relative threshold and MTV3.5 using fixed threshold. A combination of pretreatment TLG40% less than 300 g and TLG40% reduction greater than 60% after IC1 gave an improved sensitivity and specificity of 93% and 80%, respectively, in predicting complete remission in comparison to individual parameters (Fig. 3). A combination of MTV3.5 less than 50 cm3 and MTV3.5 reduction greater than 55% after IC1 yielded similar results.

(A) Dot-plot of ΔTLG40% after IC1 with suggested receiver-operator curve coordinates (−30%, −60%, and −82%) as cut-offs for predicting complete response to chemoradiotherapy. Optimal sensitivity and specificity achieved by ΔTLG40% after IC1 as a standalone parameter were 73% and 80%, respectively (−60%). (B) Dot-plot of baseline TLG40% with suggested receiver-operator curve coordinates (100, 175, and 300 g) as cut-offs. Cut-off of 100 g (60%,100%) was considered optimal. (C) Scatterplot of baseline TLG40% (y-axis) against ΔTLG40% after IC1 (x-axis). Iteratively, combination of baseline TLG40% < 300 g and TLG40% after IC1 reduction > 60% gives improved balance of sensitivity and specificity (93% and 80%), that is, not over- or underestimating nonresponders.
Longitudinal FMI Parameters
The longitudinal changes in 18F-FDG PET/CT and DW MRI parameters during IC are summarized in Table 3. In 17 evaluable patients, there was no significant difference in the changes from baseline between IC1 and IC2 for all PET parameters. This indicates that most metabolic response or nonresponse to IC was evident soon after IC1, with no significant change after a subsequent cycle, which remains the case after dichotomizing the data to PT and LNs (Supplemental Table 1; supplemental materials are available at http://jnm.snmjournals.org). However, it is noteworthy that the differences in SUVmax and SUVmean approached statistical significance (P = 0.065 and 0.071, respectively).
Longitudinal 18F-FDG PET and MRI Parameters (n = 17)
Similarly, there was no significant difference in the magnitude of ADC changes between IC1 and IC2. Overall, the dominant trend of ADC observed for both PT and LNs was an increase. As anticipated, there was a significant difference in the anatomic changes for both PT and LNs between IC1 and IC2, with notable additional change after IC2, reaffirming that morphologic change in HNSCC after IC lags behind biologic change.
Radiotherapy Dosimetry
Review of the radiotherapy dosimetry in the nonresponders (in relation to the site of persistent disease identified on imaging after chemoradiotherapy) revealed 1 marginal and 4 in-field failures. The patient with marginal failure exhibited an unusual pattern of disease spread with the persistent tumor extending beyond clinical target volume (1-cm isotropic expansion of prechemotherapy gross tumor volume). There was significant overlap between persistent disease and MTV after IC1. For the in-field failures, there was an average volume overlap of 73%, with the nonoverlapping volume corresponding to areas of progression. This indicates that residual MTV after IC1 represents a more resistant tumor subregion and is, therefore, a potential biologic target volume for radiotherapy dose escalation. A representative case is shown in Figure 4.
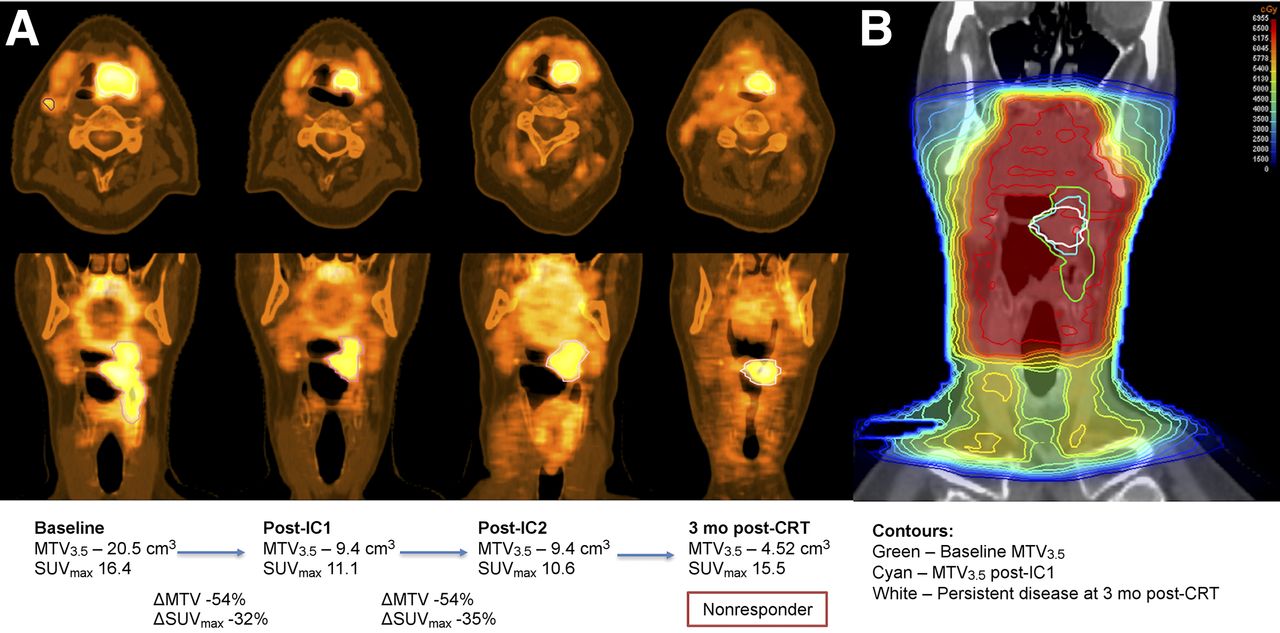
(A) Serial 18F-FDG PET/CT in nonresponder with T3N2bM0 oropharyngeal squamous cell carcinoma. After initial response, no further significant reduction in MTV3.5 and SUVmax was observed between IC1 and IC2. This would be considered suboptimal response (MTV3.5 reduction < 55%) with higher risk of subsequent chemoradiotherapy failure. (B) Coronal view of radiotherapy planning CT and dosimetry from clinical plan showing in-field failure. There was 86% volume overlap between persistent disease after chemoradiotherapy with MTV3.5 after IC1.
DISCUSSION
We evaluated early assessment after IC1 using 18F-FDG PET/CT and DW MRI to predict response to subsequent chemoradiotherapy in locally advanced HNSCC. There are 3 main findings. First, the changes in FMI parameters measured by both modalities after IC1 are representative of its full effect with few additional changes with IC2, indicating that response assessment using 18F-FDG PET/CT and DW MRI at this early time point is clinically relevant. To the best of our knowledge, this is the first study in HNSCC to provide full longitudinal 18F-FDG PET/CT and DW MRI data after each cycle of IC.
Second, 18F-FDG PET/CT–derived MTV or TLG, acquired before and after IC1, are early predictors of response to subsequent chemoradiotherapy. The high predictive power achieved by a combination of these parameters enables early stratification of patients into distinct groups based on response and associated risk of subsequent chemoradiotherapy failure. This has important clinical applicability for guiding treatment personalization. Patients with favorable metabolic response after IC1 (reduction in MTV > 55% or TLG > 60%) could be considered for radiotherapy dose reduction, especially HPV-positive patients. On the contrary, those with unfavorable response should be considered for a nonstandard chemoradiotherapy approach, for example, radiotherapy dose escalation, addition of novel targeted agents, or surgery. IC should also be discontinued immediately in those with metabolic progression (increase in MTV or TLG). These preliminary findings provide the basis for a future interventional study using FMI parameters to stratify patients (Fig. 5).
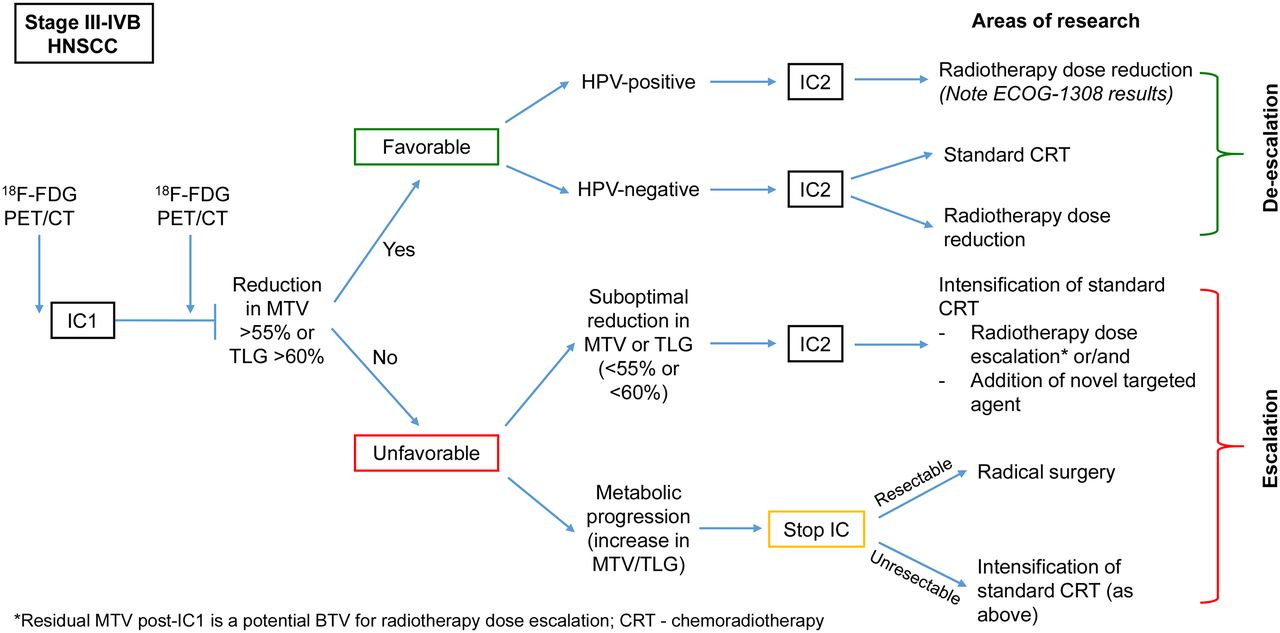
Flowchart illustrating how stratification of patients during IC using FMI (based on response) could guide subsequent treatment personalization. Escalation or deescalation of radical chemoradiotherapy are now topical area of research.
Third, residual MTV after IC1 is a potential biologic target volume for radiotherapy dose escalation. This is particularly relevant for those who had suboptimal metabolic response, where dose escalation to a subvolume of more resistant tumor should be feasible within acceptable tolerance of organs at risk. This may improve the rate of complete remission after chemoradiotherapy and avert the need for salvage surgery. Conveniently, early assessment after IC1 also allows for a fluent radiotherapy planning workflow without delay if a patient requires dose modification.
Our findings add to a growing body of evidence that pretreatment MTV and TLG are independent factors associated with local control and survival outcome (20) and further highlight their utilities early during IC to guide treatment individualization. Three studies have evaluated response assessment with 18F-FDG PET/CT after IC1 in HNSCC (21–23). However, none was designed to inform how best to personalize treatment based on response: one only investigated the correlation between PET parameters after IC1 and endoscopic response after IC before definitive treatment (22), and the other 2 had large variations in both the scanning timeline (anytime 2–4 wk after IC1) and the definitive therapy (surgery, chemoradiotherapy, or hyperfractionated radiotherapy) (21,23). The strength of our study lies in the homogeneous data; the scans were performed at 2 wk after IC1 and the parameters correlated specifically with outcomes after chemoradiotherapy.
We have shown that there are clear signals from 18F-FDG PET/CT irrespective of the methodologies chosen to generate MTV. Nevertheless, if investigators choose to use the relative threshold method, TLG should be the parameter of choice because it accounts for the variable metabolic significance of individual ROIs as demonstrated by the improved predictive value of TLG40% over MTV40%.
In contrast, we did not find pretreatment ADC to be predictive of treatment outcome. A possible explanation for this is that a comparatively larger variation in pretreatment ADC, notably in the PT (range, 0.9–1.54 × 10⁻³ mm2/s), was observed among the responders. This appears to be driven by the high prevalence of HPV-positive disease in our patient cohort (Fig. 6). HPV-positive oropharyngeal cancer (tonsillar and base of tongue) are known to exhibit unique histologic features such as indistinct cell borders and comedo necrosis, unlike other subsites or HPV-negative disease (24,25). The presence of micronecrosis (not readily distinguishable on imaging) may have contributed to the unexpectedly high pretreatment ADC values in some HPV-positive PTs. Importantly, this does not have the same negative biologic impact on outcome as in HPV-negative tumors (25). Therefore, investigators should exercise caution interpreting ADC values for HPV-positive PT.
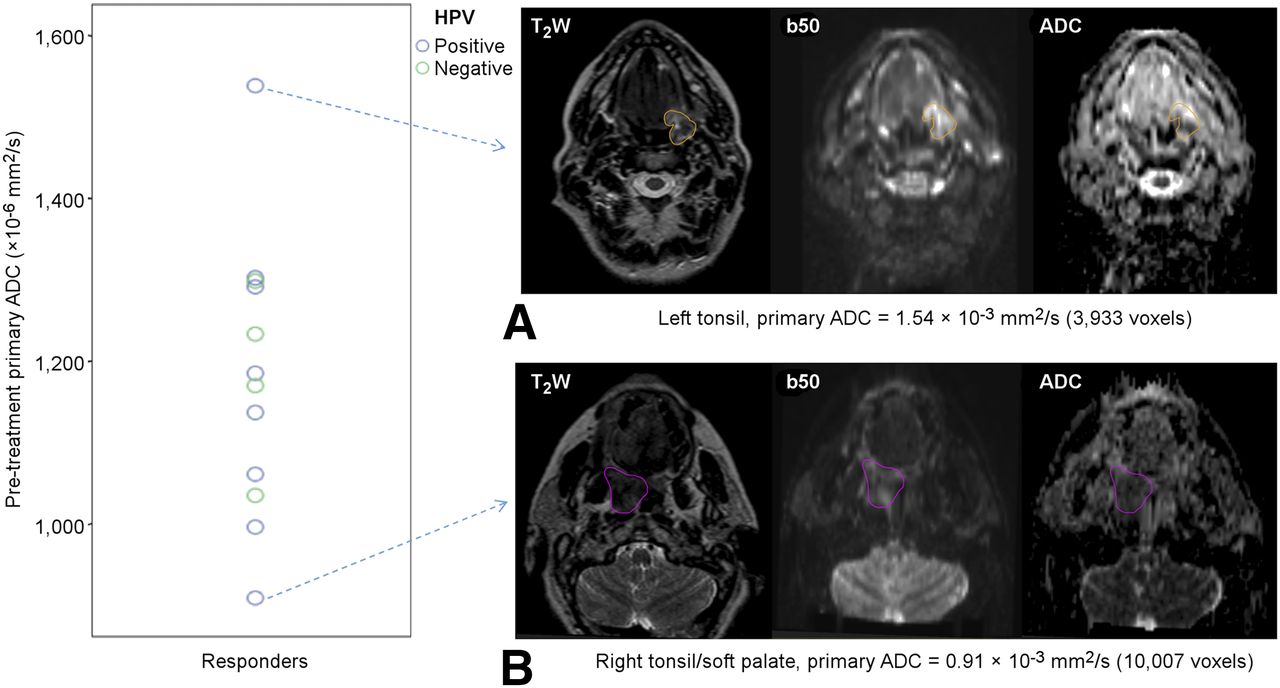
Dot-plot showing distribution of pretreatment ADC for PT in responders, categorized by HPV status with representative DW images for cases with highest (A) and lowest (B) values. It was evident that HPV-positive PTs were accountable for large variation of ADC values in this group.
DW MRI studies, in the context of chemoradiotherapy alone, have demonstrated an increase in ADC in responders and a lower increase or decrease 1–3 wk into radiotherapy in nonresponders (13,26,27). Although our DW MRI data with IC showed similar trends, it was unable to distinguish eventual responders from nonresponders. A possible explanation for this is the more pronounced impact of IC on the volumetric changes of tumor (Table 3) in comparison to chemoradiotherapy. Reorganization of cellular structures and extracellular spaces after IC may have consequently dampened the peak ADC increase measured in our responders, suggesting that DW MRI should be acquired even earlier, within the first week after IC1. The only other study evaluating DW MRI after completion of IC also found no significant correlation between ADC changes and short-term control (28).
We acknowledge the limitations of this study. A different PET/CT scanner was used for 2 patients, which may have influenced the reconstruction parameters. Four patients did not have measurable PT after diagnostic tonsillar biopsy or tonsillectomy. In addition, the craniocaudal coverage of our MRI protocol (8 cm) meant that in 3 patients, involved LNs outside the field of view were excluded from the analysis. However, by including the largest nodal metastases, the dominant biology of the disease should have been captured.
CONCLUSION
Our unique longitudinal data demonstrate that early assessment after IC1 using FMI is clinically appropriate. In addition, 18F-FDG PET/CT–derived MTV or TLG, acquired after IC1, are predictive biomarkers for ultimate response to subsequent chemoradiotherapy. These biomarkers enable identification of patients at risk of treatment failure at an early time point, permitting treatment individualization and consideration of alternative strategies such as radiotherapy dose escalation or surgery. On the contrary, DW MRI–derived ADC failed to provide any additional predictive value, but our results highlighted the need for further understanding of the potential influence of HPV status on ADC measurement. This study continues to recruit, and more data will become available.
DISCLOSURE
The costs of publication of this article were defrayed in part by the payment of page charges. Therefore, and solely to indicate this fact, this article is hereby marked “advertisement” in accordance with 18 USC section 1734. This work was supported by Cancer Research U.K. Head and Neck program grant number C7224/A13407. No other potential conflict of interest relevant to this article was reported.
Acknowledgments
This work was undertaken in The Royal Marsden NHS Foundation Trust, who received a proportion of its funding from the NHS Executive; the views expressed in this publication are those of the authors and not necessarily those of the NHS Executive. We acknowledge the support of the National Institute for Health Research, Royal Marsden, and Institute of Cancer Research Clinical Research Facility in Imaging and the Biomedical Research Centre. We also thank the radiographers, nuclear medicine technicians, and research nurses (Tara Hurley, Lorna Grove, Motoko Ryugenji, and Ana Santos) for their support.
Footnotes
Published online Jul. 14, 2016.
- © 2016 by the Society of Nuclear Medicine and Molecular Imaging, Inc.
REFERENCES
- Received for publication February 24, 2016.
- Accepted for publication May 31, 2016.


Jump to section
Related Articles
Cited By...
- Diffusion-Weighted Imaging to Assess HPV-Positive versus HPV-Negative Oropharyngeal Squamous Cell Carcinoma: The Importance of b-Values
- Integration of Antiangiogenic Therapy with Cisplatin and Gemcitabine Chemotherapy in Patients with Nasopharyngeal Carcinoma
- Tumor Subregion Evolution-Based Imaging Features to Assess Early Response and Predict Prognosis in Oropharyngeal Cancer