


Abstract
Background parenchymal enhancement (BPE), and the amount of fibroglandular tissue (FGT) assessed with MRI have been implicated as sensitive imaging biomarkers for breast cancer. The purpose of this study was to quantitatively assess breast parenchymal uptake (BPU) on 18F-FDG PET/CT as another valuable imaging biomarker and examine its correlation with BPE, FGT, and age. Methods: This study included 129 patients with suspected breast cancer and normal imaging findings in one breast (BI-RADS 1), whose cases were retrospectively analyzed. All patients underwent prone 18F-FDG PET/CT and 3-T contrast-enhanced MRI of the breast. In all patients, interpreter 1 assessed BPU quantitatively using SUVmax. Interpreters 1 and 2 assessed amount of FGT and BPE in the normal contralateral breast by subjective visual estimation, as recommended by BI-RADS. Interpreter 1 reassessed all cases and repeated the BPU measurements. Statistical tests were used to assess correlations between BPU, BPE, FGT, and age, as well as inter- and intrainterpreter agreement. Results: BPU on 18F-FDG PET/CT varied among patients. The mean BPU SUVmax ± SD was 1.57 ± 0.6 for patients with minimal BPE, 1.93 ± 0.6 for mild BPE, 2.42 ± 0.5 for moderate BPE, and 1.45 ± 0.3 for marked BPE. There were significant (P < 0.001) moderate to strong correlations among BPU, BPE, and FGT. BPU directly correlated with both BPE and FGT on MRI. Patient age showed a moderate to strong indirect correlation with all 3 imaging-derived tissue biomarkers. The coefficient of variation for quantitative BPU measurements with SUVmax was 5.6%, indicating a high reproducibility. Interinterpreter and intrainterpreter agreement for BPE and FGT was almost perfect, with a κ-value of 0.860 and 0.822, respectively. Conclusion: The results of our study demonstrate that BPU varied among patients. BPU directly correlated with both BPE and FGT on MRI, and BPU measurements were highly reproducible. Patient age showed a strong inverse correlation with all 3 imaging-derived tissue biomarkers. These findings indicate that BPU may serve as a sensitive imaging biomarker for breast cancer prediction, prognosis, and risk assessment.
Accurate risk assessment is pivotal for women at high risk for breast cancer to personalize risk-reduction interventions (1). In clinical practice, several risk-reduction strategies are being used, ranging from lifestyle changes and chemoprevention to invasive interventions such as prophylactic mastectomy and salpingo-oophorectomy (2–6). Although these interventions are efficient in reducing cancer risk (6,7), they are associated with substantial side effects (8,9) and can negatively affect the quality of life (10). However, it currently remains uncertain which level of intervention is indicated for individual women (11), leading to potential overtreatment and undertreatment. Therefore, methods are urgently needed to better determine the likelihood of response to risk-reduction interventions and thus better guide risk management decisions.
MRI of the breast allows a 3-dimensional assessment of both the anatomy and the physiologic activity of breast tissue. In addition, MRI provides insight about the amount of fibroglandular tissue (FGT), as well as background parenchymal enhancement (BPE). Thus, FGT and BPE are considered more sensitive predictive and prognostic imaging biomarkers than density assessment with mammography (12–18).
Similar to MRI, PET using the radiotracer 18F-FDG provides insight into the physiologic activity of the normal breast parenchyma through the depiction of tissue glucose metabolism (19–24). This 18F-FDG uptake is defined as breast parenchymal uptake (BPU). Thus, it could be that BPU might also serve as an important imaging biomarker in breast cancer.
With the worldwide implementation of hybrid PET/MRI systems and dedicated breast PET systems, there is the potential to simultaneously assess and monitor these imaging biomarkers of breast cancer (19,25,26). To define the value of BPU, BPE, and FGT as imaging biomarkers for breast cancer and use them for better guidance of risk management decisions, information about their correlations and reproducibility is needed. However, to our knowledge, no such information currently exists. Therefore, the aim of this study was to quantitatively assess BPU on 18F-FDG PET/CT and examine its correlation with age and with BPE and FGT on MRI.
MATERIALS AND METHODS
The institutional review board approved this prospective, single-institution study and retrospective data analysis, and all patients gave written informed consent.
Patients
From December 2009 to April 2014, 172 consecutive patients with suspected breast cancer were evaluated for inclusion in this study. To be included, the patients had to be at least 18 y old, not pregnant, and not breastfeeding; had to have a suggestive finding on mammography or breast ultrasonography (i.e., asymmetric density, architectural distortion, breast mass, or microcalcifications [BI-RADS 0, further imaging warranted; BI-RADS 4, suspicious abnormality; or BI-RADS 5, highly suggestive of malignancy]) that had not been previously treated; and could have no contraindications to MRI or MRI contrast agents. Twenty-eight patients had to be excluded because of incomplete examinations or prior treatment. The remaining 144 patients underwent 18F-FDG PET/CT and MRI. In 30 patients, the imaging revealed an abnormality in the contralateral breast (BI-RADS 2–5). All suggestive lesions were histopathologically verified by either image-guided or surgical biopsy. Fifteen of these patients were excluded because of an MRI or PET imaging finding in the contralateral breast; that is, not the breast in which there had been an imaging abnormality on mammography or breast ultrasonography. The remaining 129 patients (mean age ± SD, 57.9 ± 3.9 y; range, 18–87 y) were evaluated in the retrospective analysis.
Several patients examined in this study were previously analyzed in a different context (19,22).
Imaging
The 18F-FDG PET/CT and MRI examinations were performed no more than 6 d apart (mean, 2.26 d; range, 0–6 d; same day, n = 57; 1 d, n = 32; 2 d, n = 11; 3 d, n = 9; 4 d, n = 12; 5 d, n = 5; 6 d, n = 1).
A prone PET/CT dataset over the breasts was acquired using a combined PET/CT in-line system (Biograph 64 TruePoint; Siemens), allowing the same patient geometry as with MRI. The whole-body PET/CT system is equipped with a high-resolution PET scanner and a 64-detector CT scanner. The patients fasted 6 h before injection of approximately 300 MBq of 18F-FDG, depending on patient weight. Blood glucose levels were less than 150 mg/dL (8.3 mmol/L) at the time of tracer application. Uptake time was 60 min. No contrast agent was injected for the CT scan, which was used only for attenuation correction. PET images were reconstructed using the TrueX algorithm (Siemens) (22).
MR imaging was performed with the patient prone using a 3-T Tim Trio scanner (Siemens) and a 4-channel breast coil (InVivo). In premenopausal patients, MRI was performed between the seventh and 14th days of the menstrual cycle to minimize hormonal influence on BPE (27).
The MRI protocol consisted of 3 sequences. The first was a T2-weighted turbo spin echo sequence with fat suppression (repetition time/echo time, 4,800/9 ms; field of view, 340 mm; 48 superior–inferior slices 3 mm thick; flip angle, 128°; matrix, 384 × 512; acquisition time, 2 min 16 s). The second and third were a split-dynamics, contrast-enhanced T1-weighted volume-interpolated breath-hold examination (repetition time/echo time, 3.62/1.4 ms; field of view, 320 mm; 72 slices; 1.7-mm isotropic spatial resolution; matrix, 192 × 192; one average; 13.2 s per volume) and a T1-weighted turbo fast low-angle shot 3-dimensional sequence with selective water-excitation (repetition time/echo time, 877/3.82 ms; field of view, 320 mm; 96 slices; 1-mm isotropic spatial resolution; matrix, 320 × 134; one average; 2 min) with a total acquisition time of 15 min 20 s.
A standard dose (0.1 mmol/kg of body weight) of gadoterate meglumine was administered intravenously as a bolus using a power injector (Spectris Solaris EP; Medrad) at 4 mL/s with a saline flush after injection. The total MRI examination time was approximately 18 min.
Data Analysis
18F-FDG PET/CT
After reconstruction of the 18F-FDG PET/CT images, a 3-dimensional region of interest was carefully drawn on the contralateral normal breast around the glandular breast tissue, as determined by visual inspection of the subsequent 4–6 PET/CT scan slices by a breast radiologist under the supervision of a nuclear medicine physician. The nipple and areola area were excluded from region-of-interest placement. From these regions of interest, the SUVmax was calculated. In all patients, BPU SUVmax measurements were repeated by interpreter 1 to assess reproducibility.
MRI
FGT and BPE of the normal contralateral breast were qualitatively assessed on the MR images by 2 independent interpreters using the revised American College of Radiology (ACR) BI-RADS classification (28). For calculation of intrainterpreter agreement, interpreter 1 reassessed all cases. As recommended by BI-RADS, FGT and BPE were assessed by visual subjective estimation for each MRI study. FGT was classified as ACR A if the breasts were almost entirely fatty, ACR B if scattered FGT was present, ACR C if there was heterogeneous FGT, and as ACR D if there was extreme FGT content. BPE was graded as minimal, mild, moderate, or marked on the basis of contrast-enhanced images approximately 90 s after contrast medium injection.
Statistical Analysis
Statistical analysis was performed using SPSS Statistics, version 22.0 (IBM). Metric data, such as BPU SUVmax and age, are described using mean ± SD, and nominal and ordinal data are presented using absolute frequencies and percentages. To compare average age and BPU for different BPE and FGT grades, 1-way analyses of variance and post hoc Tukey range tests were performed. The Pearson correlation coefficient (r) was used to assess for correlations between age and BPU, and Spearman rank correlation (ρ) was used to assess for correlations between BPE and FGT. To calculate inter- and intrainterpreter agreement, the Cohen κ was used for FGT and BPE and the coefficient of variance was used for BPU. A P value of 0.05 or less was considered statistically significant. A correlation coefficient matrix was prepared showing numeric, color-coded, and size-coded Pearson correlation coefficients for BPU SUVmax on 18F-FDG PET/CT, BPE and FGT on MRI, and age for both interpreters, as well as reassessment of BPU SUVmax by interpreter 1, with 0 indicating no correlation, 0.1–0.2 a weak correlation, 0.3–0.4 a moderate correlation, 0.5–0.7 a strong correlation, and 0.8 or higher an excellent correlation (Fig.1).

Matrix showing numeric, color-coded, and size-coded Spearman rank correlation coefficients for BPU SUVmax on 18F-FDG PET/CT, BPE, FGT, and age for both interpreters and reassessment of BPU SUVmax by interpreter 1. Correlations ranged from moderate to strong and are marked in blue if positive and red if negative.
RESULTS
Mean, SD, minimum, and maximum BPU SUVmax on 18F-FDG PET/CT were 1.81, 0.61, 0.88, and 4.55, respectively. The mean BPU SUVmax and 25th and 75th percentiles were, respectively, 1.57 ± 0.6 and 1.27–1.88 for minimal BPE, 1.93 ± 0.6 and 1.44–2.31 for mild BPE, 2.42 ± 0.5 and 2.06–2.85 for moderate BPE, and 1.45 ± 0.3 and 1.09 for marked BPE. Thus, BPU on 18F-FDG PET/CT varied among patients.
BPE was minimal in 58 patients (44.96%), mild in 54 (41.86%), moderate in 14 (10.85%), and marked in 3 (2.33%). FGT was classified as ACR A in 33 patients, ACR B in 59, ACR C in 27, and ACR D in 10. The mean BPU SUVmax and 25th and 75th percentiles were, respectively, 1.54 ± 0.5 and 1.15–1.89 for ACR A, 1.75 ± 0.5 and 1.36–2.16 for ACR B, 2.01 ± 0.75 and 1.48–2.44 for ACR C, and 2.29 ± 0.66 and 1.79–2.54 for ACR D. Detailed ACR classification results for BPE and FGT for both interpreters and interpretation rounds are summarized in Table 1. Correlations among BPU, BPE, FGT, and age for both interpreters are summarized in Figure 1. Correlation coefficients ranged from moderate, that is, 0.3–0.5 (between BPU and age, BPE and FGT, and BPE and FGT) to strong, that is, 0.5–0.7 (between age and BPU, BPE, and FGT).
ACR Classification Results for BPE and FGT
BPU showed a significant moderate direct correlation with BPE (P < 0.001, ρ = 0.492), indicating that patients with greater levels of BPE present with a greater BPU SUVmax (Figs. 2 and 3). BPU showed a significant moderate direct correlation with FGT (P < 0.001, ρ = 0.370), indicating that patients with a larger amount of FGT present with a greater BPU SUVmax (Figs. 2 and 3).
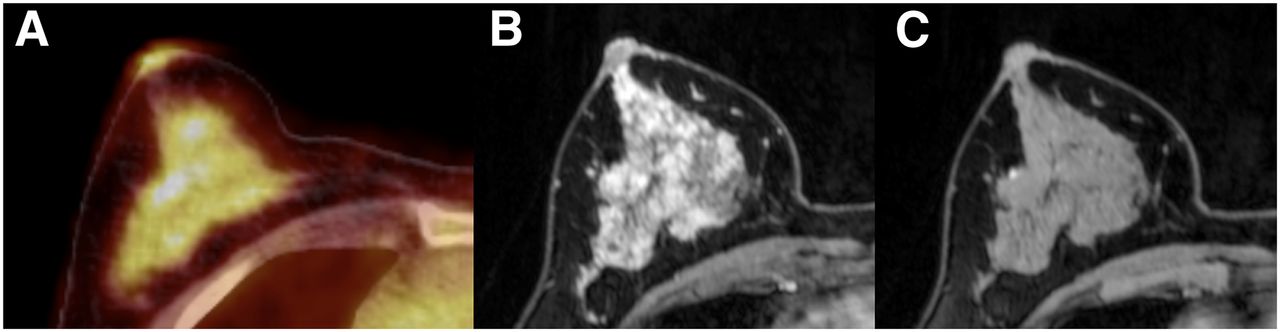
54-y-old woman who presented with BPU SUVmax of 2.96 on 18F-FDG PET/CT and showed marked BPE and extreme FGT (ACR D). Axial 18F-FDG PET/CT (A), axial dynamic contrast-enhanced MRI (B), and axial unenhanced T1-weighted MRI (C) of right breast are shown.

61-y-old woman who presented with BPU SUVmax of 1.12 on 18F-FDG PET/CT and showed no BPE and scattered FGT (ACR B). Axial 18F-FDG PET/CT (A), axial dynamic contrast-enhanced MRI (B), and axial unenhanced T1-weighted MRI (C) of right breast are shown.
All 3 imaging-derived tissue biomarkers, that is, BPU (r = 0.386), BPE (ρ = −0.498), and FGT (ρ = −0.631), showed a significant indirect correlation with age (P < 0.001).
When moderate and marked BPE were grouped together, the results were not different. Mean BPU for the grouping was 2.25 ± 0.6. The correlations between BPU, BPE, FGT, and age for this grouped analysis for both interpreters are summarized in Supplemental Figure 1 (available at http://jnm.snmjournals.org). The correlation coefficients ranged from moderate (0.3–0.5, between BPE and FGT) to strong (0.5–0.7, between age and BPE). BPU showed a significant moderate direct correlation with BPE (P < 0.001, ρ = 0.422). FGT showed a significant moderate direct correlation with BPE (P < 0.001, ρ = 0.474). BPE showed a significant indirect correlation with age (P < 0.001, ρ = −0.498).
The coefficient of variance for quantitative BPU measurements with SUVmax was 5.6%, indicating a high reproducibility. Inter- and intrainterpreter agreement for BPE was almost perfect, with κ-values of 0.860 and 0.822, respectively. Inter- and intrainterpreter agreement for FGT was also almost perfect, with κ-values of 0.839 and 0.931, respectively.
DISCUSSION
PET imaging has been implemented worldwide in oncologic practice and is used in breast assessment with promising results (19,22,29,30). BPE and FGT on MRI have been implicated as sensitive predictive and prognostic imaging biomarkers in breast cancer (12–15,17,31). The investigation of BPU as another potential sensitive and also quantifiable imaging biomarker for breast cancer prediction, prognosis, and risk assessment is, therefore, of considerable interest. To fully elucidate the value of BPU, BPE, and FGT as imaging biomarkers for breast cancer, information about their correlations and reproducibility is needed.
The results of our study demonstrate that BPU, which is the degree of 18F-FDG uptake in the glandular tissues of the normal breast, varies among patients. BPU was directly correlated with both MRI-derived BPE and FGT. Patient age showed a moderate to strong indirect correlation with all 3 imaging-derived tissue biomarkers. BPU measurements were highly reproducible, and there was almost perfect inter- and intrainterpreter agreement for both BPE and FGT with MRI. These findings indicate that BPU may serve as a sensitive predictive and prognostic imaging biomarker for breast cancer prediction, prognosis, and risk assessment.
To our knowledge, this is the first study to examine the correlation of BPU on 18F-FDG PET/CT with BPE and FGT on MRI. We identified a significant direct correlation between BPU and BPE and between BPU and FGT, which suggests that BPU could also be used as an imaging biomarker for risk assessment, hormonal replacement therapy, or chemoprevention. Just as can be done with the imaging biomarkers BPE and FGT on MRI, BPU can be assessed noninvasively on 18F-FDG PET/CT, but a definite benefit of BPU over BPE and FGT is that it can be assessed quantitatively and is highly reproducible, which is a prerequisite for a stable and clinically relevant imaging biomarker (32,33).
To our knowledge, the correlation of 18F-FDG radiotracer uptake in normal breast parenchyma with BPE has been investigated in only a single retrospective study that used 18F-FDG positron emission mammography (PEM) (34). In that study, Koo et al. assessed the correlation of BPU on 18F-FDG PEM, BPE on contrast-enhanced MRI, and breast density on mammography. Although mean BPU increased from minimal to marked BPE, there was considerable overlap, especially for women with minimal and mild BPE, and mean BPU was not an independent predictor of BPU on PEM. In contrast, in the current study, we found a direct correlation between BPU and BPE. The divergent results might be explained by the fact that, in the study by Koo et al., there was a small sample size, especially for moderate (n = 5) and marked BPE (n = 5), which may have led to underpowered statistical analyses. Moreover, in contrast to the current study, BPU was assessed using a 2-dimensional imaging modality, that is, 18F-FDG PEM, which could have influenced the results and, thus, limits comparability. In addition, MRI was not scheduled according to the menstrual cycle, and there is no information on the time interval between PEM and MRI, which potentially might act as another confounding factor.
To our knowledge, no information currently exists on the correlation between BPU and FGT on MRI, which is a newly introduced descriptor in the MRI BI-RADS lexicon. In this first study to examine the correlations between BPU and FGT, we found a direct correlation. This finding agrees with studies that have investigated the correlation between BPU on 18F-FDG PET or PEM and breast density on mammography, which is the equivalent of FGT on MRI (34–37). These results further underline the potential of BPU as a valuable imaging biomarker in breast cancer.
Findings of increased breast density on mammography have been shown to lessen with age. Similar to mammographic breast density, all 3 tissue-derived imaging biomarkers in our study showed an indirect correlation with patient age. To date, results on the correlation of BPU with age are scarce and divergent. Similar to our results, Mavi et al. (37), Zytoon et al. (29), and Koo et al. (34) demonstrated that 18F-FDG uptake significantly decreases as age increases. Only one study, by Vranjesevic et al., found no significant correlation (35).
BPE and FGT also showed a negative correlation with age, as agrees with previously published data from studies that investigated BPE and mammographic breast density (38–40).
A clinically relevant imaging biomarker must be stable and reproducible. In this study, we demonstrated that BPU possesses those qualities, as the quantitative BPU measurements were highly reproducible. Our findings are in accordance with those of Vranjesevic et al. (35) and Mavi et al. (37), who found good agreement between quantitative BPU measurements when determined by 2 observers independently. In our study, there was almost perfect inter- and intrainterpreter agreement for both BPE and FGT on MRI. Previous studies reported good agreement for BPE classification when performed by trained interpreters (17,41) but yielded more variability for inexperienced interpreters, thus somewhat limiting the stability of BPE as an imaging biomarker. The excellent results in the current study can be explained by the fact that both interpreters were experienced in breast density assessment and MRI. Currently, there are no data on inter- and intraobserver agreement for FGT, as this parameter has only recently been introduced into the MRI BI-RADS lexicon. In contrast to mammographic breast density (42), for which there is considerable variability, inter- and intrainterpreter agreement was almost perfect for FGT. Similar to the excellent results for BPE, this good agreement is most likely due to the fact that our interpreters had vast experience in breast density assessment and MRI.
The current study has some limitations, one of which is the small number of patients with marked BPE. However, this small number reflects the normal distribution of BPE in the population. Additionally, we performed a grouped analysis for patients with greater levels of BPE—that is, moderate and marked—that yielded similar results. Our study assessed BPE and FGT qualitatively, in contrast to BPU. However, the BI-RADS lexicon does not recommend quantitative assessment of BPE and FGT, but there was excellent intra- and interinterpreter agreement for BPE and FGT. Therefore, the approach in our study seems to be justified. The fact that our study did not perform all PET/CT and MRI examinations on the same day (range, 0–6 d) might have affected BPE in a few cases because of the changes in BPE with the menstrual cycle. However, in most cases, the interval between examinations was short (mean, 2.26 d), and thus, relevant changes in BPE seem unlikely.
CONCLUSION
The results of our study demonstrate that BPU varies among patients. BPU directly correlated with both BPE and FGT on MRI. Patient age showed a strong inverse correlation with all 3 imaging-derived tissue biomarkers. BPU measurements were highly reproducible, with almost perfect inter- and intrainterpreter agreement for both BPE and FGT on MRI. These findings indicate that BPU may serve as a sensitive imaging biomarker for breast cancer prediction, prognosis, and risk assessment.
DISCLOSURE
The costs of publication of this article were defrayed in part by the payment of page charges. Therefore, and solely to indicate this fact, this article is hereby marked “advertisement” in accordance with 18 USC section 1734. No potential conflict of interest relevant to this article was reported.
Footnotes
Published online May 26, 2016.
- © 2016 by the Society of Nuclear Medicine and Molecular Imaging, Inc.
REFERENCES
- Received for publication February 29, 2016.
- Accepted for publication April 12, 2016.


