


Abstract
Dose coefficients of radiopharmaceuticals have been published by the International Commission on Radiological Protection (ICRP) and the MIRD Committee but without information concerning uncertainties. The uncertainty information of dose coefficients is important, for example, to compare alternative diagnostic methods and choose the method that causes the lowest patient exposure with appropriate and comparable diagnostic quality. For the study presented here, an uncertainty analysis method was developed and used to calculate the uncertainty of the internal doses of 7 common radiopharmaceuticals. Methods: On the basis of the generalized schema of dose calculation recommended by the ICRP and MIRD Committee, an analysis based on propagation of uncertainty was developed and applied for 7 radiopharmaceuticals. The method takes into account the uncertainties contributed from pharmacokinetic models and the so-called S values derived from several voxel computational phantoms previously developed at Helmholtz Zentrum München. Random and Latin hypercube sampling techniques were used to sample parameters of pharmacokinetic models and S values, and the uncertainties of absorbed doses and effective doses were calculated. Results: The uncertainty factors (square root of the ratio between 97.5th and 2.5th percentiles) for organ-absorbed doses are in the range of 1.1–3.3. Uncertainty values of effective doses are lower in comparison to absorbed doses, the maximum value being approximately 1.4. The ICRP reference values showed a deviation comparable to the effective dose calculated in this study. Conclusion: A general statistical method was developed for calculating the uncertainty of absorbed doses and effective doses for 7 radiopharmaceuticals. The dose uncertainties can be used to further identify the most important parameters in the dose calculation and provide reliable dose coefficients for risk analysis of the patients in nuclear medicine.
The absorbed and effective dose coefficients to the patients from administered radiopharmaceuticals are usually calculated according to the generalized schema recommended by the International Commission on Radiological Protection (ICRP) and the MIRD of the Society of Nuclear Medicine and Molecular Imaging (1–3). In these calculations, the mathematic models (4) for the time-dependent activity curves in organs and tissues (pharmacokinetic models) and the mathematic and digital representations of the human body (now voxel phantoms) (5) are initially evaluated. Because of the uncertainties in the image acquisition chains and the variability of the patients, the image-based kinetic models and the reference human phantoms used for the estimation of absorbed doses to patients are subject to large sources of uncertainty (6–8). Hence, for an individual patient, the resulting dose coefficients are uncertain.
Generally, the radiation doses to patients are reported without associated uncertainty and this information is important, for example, to compare alternative diagnostic methods and choose the method that causes the lowest patient exposure with appropriate and comparable diagnostic quality. Furthermore, the uncertainty of internal dose is generally greater than that of external dose, for example, in external-beam radiation therapy. The calculated internal dose is needed for a medical radiation risk analysis for patients.
In this study, an uncertainty analysis method, based on the propagation of uncertainty, was set up to analyze the 2 main sources of uncertainties in internal dose calculation for radiopharmaceuticals, namely, the image-based pharmacokinetic model parameters and the S values derived from different voxel phantoms. This practical method was applied to assess the uncertainty of dose coefficients of 7 commonly used radiopharmaceuticals. The uncertainty factor (UF, defined as the square root of ratio between 97.5th and 2.5th percentiles) for absorbed dose coefficients is in the range between 1.1 and 3.3; for effective dose the UFs are lower in comparison to absorbed dose, the maximum value being about 1.4. The uncertainty of dose coefficients can be used for risk analysis of patients undergoing diagnostic nuclear medicine procedures.
MATERIALS AND METHODS
Radiopharmaceuticals
In this study, the uncertainty of absorbed dose coefficient and effective dose coefficient are calculated for the following radiopharmaceuticals: 18F-FDG, 99mTc-pertechnetate, 99mTc-phosphonate, 99mTc-sestamibi, 99mTc-tetrofosmin, 99mTc-macroaggregated albumin (MAA), and 201Tl-chloride.
Calculation of Dose Coefficients
In this work, the generalized schema for radiopharmaceutical dosimetry published by the MIRD Committee and ICRP (3) was used for calculating the internal doses. The absorbed dose  in the target organ
  is determined by:
 Eq. 1where
  is the time-integrated activity in a source organ or region
  over the integration period
  , where
  is commonly taken to be infinity (3);
  is the radionuclide-specific quantity representing the mean absorbed dose to target tissue
  per unit activity in source tissue
  , the so-called S value; and MTB and MREM are the organ mass (g) of the total body (TB) without contents of walled organs and the organ mass (g) in the remainder tissues (REM), respectively, with
  .
.
The ICRP and the MIRD Committee defined the effective dose E for a reference person by averaging the equivalent doses of female and male (9). However, because the objective of this study was to estimate the uncertainty of effective dose, the biokinetic data of the 7 radiopharmaceuticals were evaluated from the literature without sex identification and the S values were derived from 6 male phantoms and 1 female phantom. Therefore, the uncertainty of effective dose is calculated according to the following formula (10): Eq. 2
Eq. 2
where  is a tissue-weighting factor for the target tissue
  , and
, and  is the committed equivalent dose. The tissue-weighting factors published by ICRP (9) were applied, and the uncertainty of factors
  was not considered in this study. The factors are related to risk analysis. In addition, the difference between the dose coefficients of women and men is calculated using the mathematic and voxel phantoms, respectively (Table 1).
Deviations in Absorbed Dose (mGy/MBq) Calculation for Reference Voxel Phantoms and Mathematic Phantoms for 18F-FDG
To quantitatively determine the uncertainties of the dose coefficients (absorbed dose per administered activity), uncertainties of the S values and the time-integrated activity  were evaluated first.
Determination of Uncertainty of Time-Integrated Activity
The time-integrated activity of an administered radiopharmaceutical in a source organ is calculated by solving a system of ordinary linear differential equations with transfer rates  as described by Berman (4):
 Eq. 3where
  is activity of the radioactive substance in compartment i at the time t;
  is the transfer rate of substance transferred from j to i;
  is the transfer rate from compartment i to j;
  is the loss rate to outside of the system;
  is the rate of input from outside the system; and
  is the radioactive decay constant. According to Bolch et al. (3), the time-integrated activity is calculated by
  . The MIRD Committee has reported such compartmental models and their corresponding model parameters (transfer rates) for some radiopharmaceuticals.
If the transfer rates are expressed by fraction and half-life, the solution for the above differential equation (Eq. 3) can be obtained. The time-integrated activity can be written as the following (1): Eq. 4
Eq. 4
where  is the administered activity,
  is the fractional distribution to organ S,
  is a fraction of
  eliminated with a biologic half-life
  , and
, and  is the fraction of
  taken up with a biologic half-life
  . Both
  and
and  follow
  and
and  .
.  and
and  are the elimination and uptake effective half-lives, respectively. ICRP applied such mathematic models for many commonly used radiopharmaceuticals and tabulated the corresponding model parameters in its publications (1,11,12). In contrast to the MIRD schema, the time-integrated activity can be calculated here explicitly.
The time-integrated activity  is a function of parameters
  (ICRP analytic method) or parameter λ (MIRD compartmental method). To calculate the uncertainty of the
  , the Latin hypercube sampling technique (13) was used for sampling the parameters in the function. The range between the minimum and maximum values of each parameter was divided into 500 intervals on the basis of equal probability. One value from each interval was selected at random with respect to the probability density in the interval. The 500 values thus obtained for the first parameter were paired in a random manner (equally likely combinations) with the 500 values of the second parameter. These 500 pairs were combined in a random manner with the 500 values of the third parameter to form 500 triples and so forth until 500 k-tuples were formed. In this manner, one got an n × k matrix of input in which the ith row contained values of each of the k input variables to be used on the ith run (n = 500 runs) of the computer model.
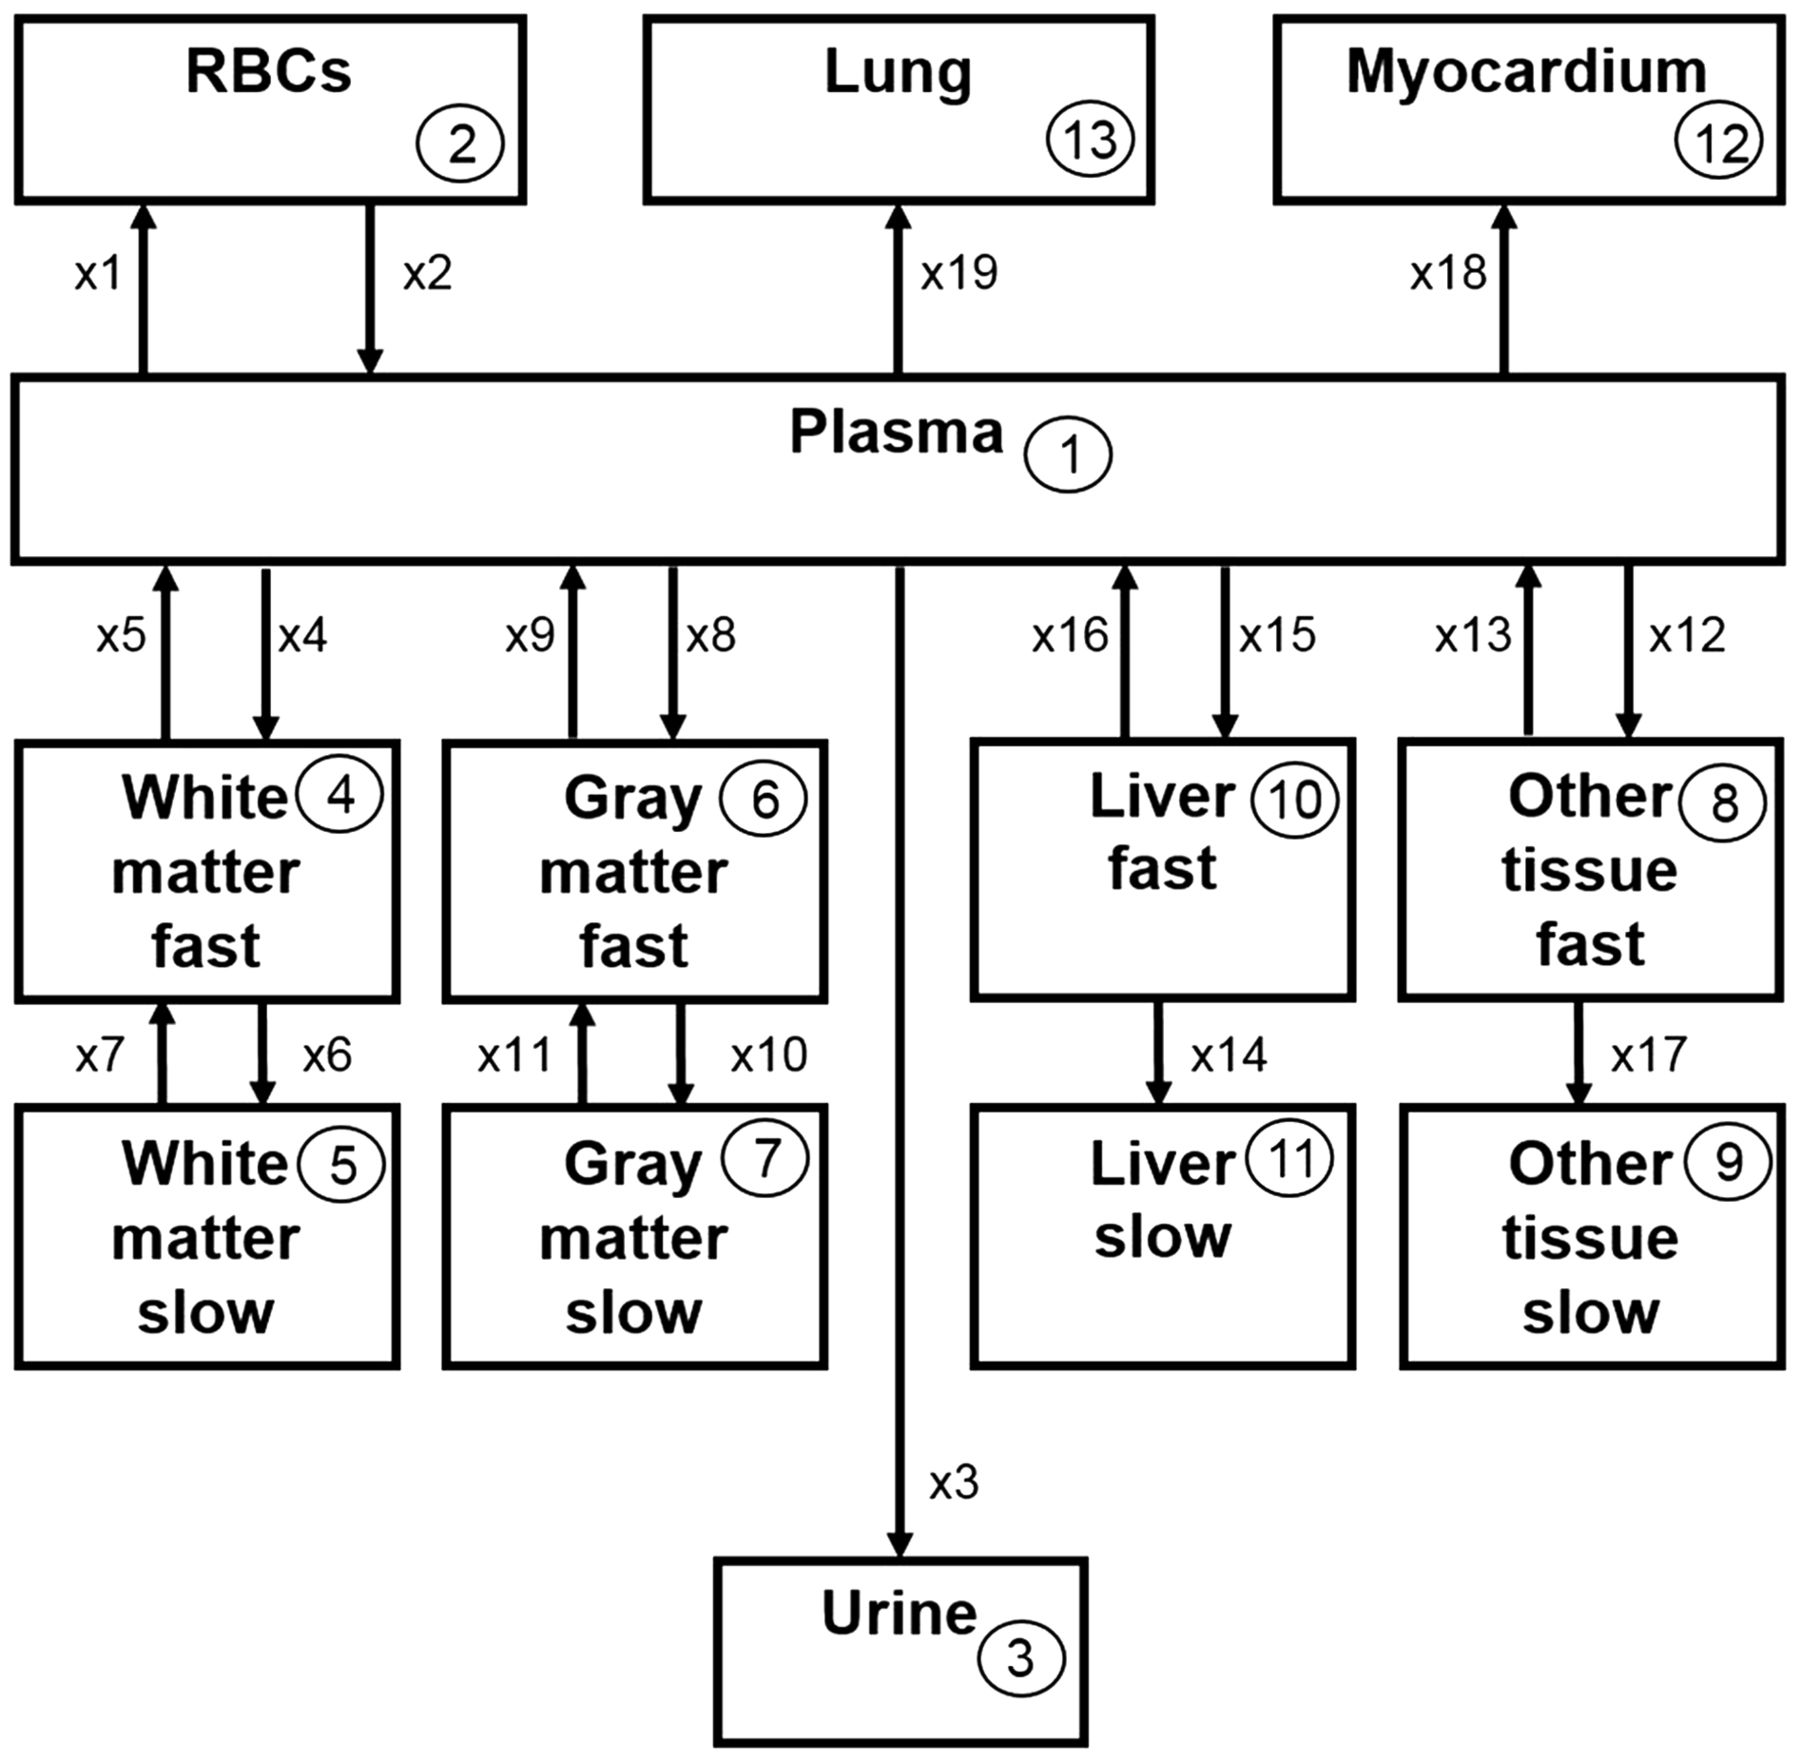
To illustrate the MIRD compartmental model approach, the model structure, the mean values, and the SD of the model parameters for 18F-FDG were taken from Hays et al. (14). The minimum and maximum values and the type of the distribution of the model parameters for the Latin hypercube sampling were taken from Li et al. (15). The 18F-FDG compartmental model is depicted in Figure 1. For the other 6 radiopharmaceuticals, based on a normal distribution and a confidence interval of 95%, the minimum and maximum values were calculated as the following:
 Eq. 5For the negative values, which occurred in some parameters, a lognormal distribution was assumed. The minimum and maximum values were then recalculated on the basis of the lognormal distribution.
 Eq. 6After the geometric mean
  and the geometric SD
  (16) were determined, the minimum and maximum values (97.5th and 2.5th percentiles of the lognormal distribution) were calculated with a confidence interval of 95%:
 Eq. 7
Eq. 7

Compartmental model for 18F-FDG developed by MIRD Committee (14). RBCs = red blood cells.
The mean values of the model parameters for 18F-FDG and 201Tl-chloride, in accordance with the ICRP analytic method, were taken from ICRP publication 106 (12); for 99mTc-pertechnetate, 99mTc-phosphonate, and 99mTc-MAA, from ICRP publication 53 (1); and for 99mTc-sestamibi and 99mTc-tetrofosmin, from ICRP publication 80 (11). To calculate the uncertainty of the model parameter, a normal distribution with a coefficient of variation of 0.2 was assumed. Some parameters for the source organs, marked with a dagger (Supplemental Tables 2–8; supplemental materials are available at http://jnm.snmjournals.org), were not specified; however, the time-integrated activity was indicated.
For 18F-FDG, the uncertainties of the time-integrated activity were calculated by both MIRD and ICRP models. For the remaining 6 radiopharmaceuticals, the calculations were performed solely by the ICRP method because there is no proposed compartmental model published by the MIRD Committee.
Determination of Uncertainty of S values
The S values were calculated by the specific absorbed fraction values (SAF values), the energy and yield of emitting radiation. The SAF values are the fraction of radiation R of energy E emitted within the source region that is absorbed per unit mass in the target region. In our laboratory, the SAF values for 7 different phantoms (Table 2) were calculated by applying the Monte Carlo radiation transport simulation technique (17). The decay energies and yields, which were taken from the ICRP publication 107 (18), are assumed to be constant in the present uncertainty analysis. Therefore, the uncertainty of the S values is the fractional uncertainty of the SAF values. The SD and mean values were determined from the SAF values of the 7 phantoms. For lognormal distributions, the geometric mean and the geometric SD were calculated from which the minimum and maximum values for the SAFs were determined.
Phantom Data
The SAF values of electrons for some walled organs were not simulated. For SAF values of electrons with energies less than 100 keV, the following approximations have been made (19): Eq. 8where
  is target region;
  source region; TB is total body; MT, Mc and MTB are masses of the target regions, content of walled organ, and of the total body, respectively; and
  is the specific absorbed fraction. The minimum and maximum values required for the Latin hypercube sampling method were calculated according to the same principle as in the determination of the uncertainties of the model parameters.
A computer program called DoseU, written in C#, was developed at the Helmholtz Zentrum München for calculating the uncertainty of the absorbed dose and effective dose coefficients according to Equation 1 and Equation 2. As input, 500 sample values of the k parameters of time-integrated activity and S values were generated and were entered in the computer code DoseU. As output, 500 values of absorbed and effective dose coefficients were calculated that were further used for calculating the statistics, for example, 2.5th, 25th, 75th, and 97.5th percentiles, the mean values, and SD of the dose coefficients.
To demonstrate the deviations in the calculation of dose coefficients with the same time-integrated activities and different phantoms, dose coefficients calculated using voxel phantoms (17) and mathematic phantoms (20) were compared.
RESULTS
The uncertainty of the model parameter for 18F-FDG, expressed in maximum and minimum values, and the distribution type required for sampling are summarized in Supplemental Tables 1 and 2. The data for the rest of the radiopharmaceuticals, according to the ICRP analytic method, can be found in Supplemental Tables 3–8.
For a quantitative description of uncertainty, the UF (21) was used. The uncertainty-associated quantity can be expressed in terms of lower and upper bounds, A and B, respectively. The UF for a confidence interval of 95% is defined as the square root of ratio between 97.5th (B) and 2.5th (A) percentiles. The UFs for the time-integrated activity varied generally from 1.0 to 2.0. The calculated minimum and maximum values and the type of distribution for the S values are not listed here for reasons of space.
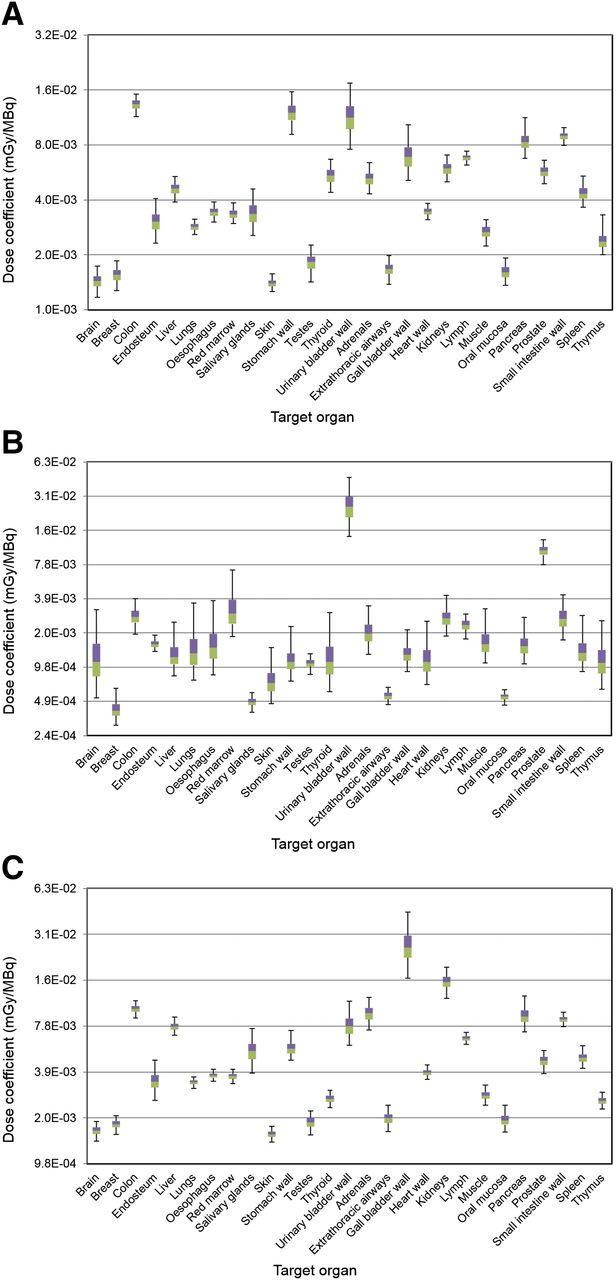
The uncertainties of the dose coefficients are presented in Figures 2–5 (logarithmic representation) in the form of boxplots. The boundary line between the 2 colors of the box reflects the median value. The lower and the upper edge of the box represent, respectively, the 25th and 75th percentiles; within the box are the 50th percentiles of all values. The upper and lower ends of the whiskers show the 2.5th and 97.5th percentiles, respectively.
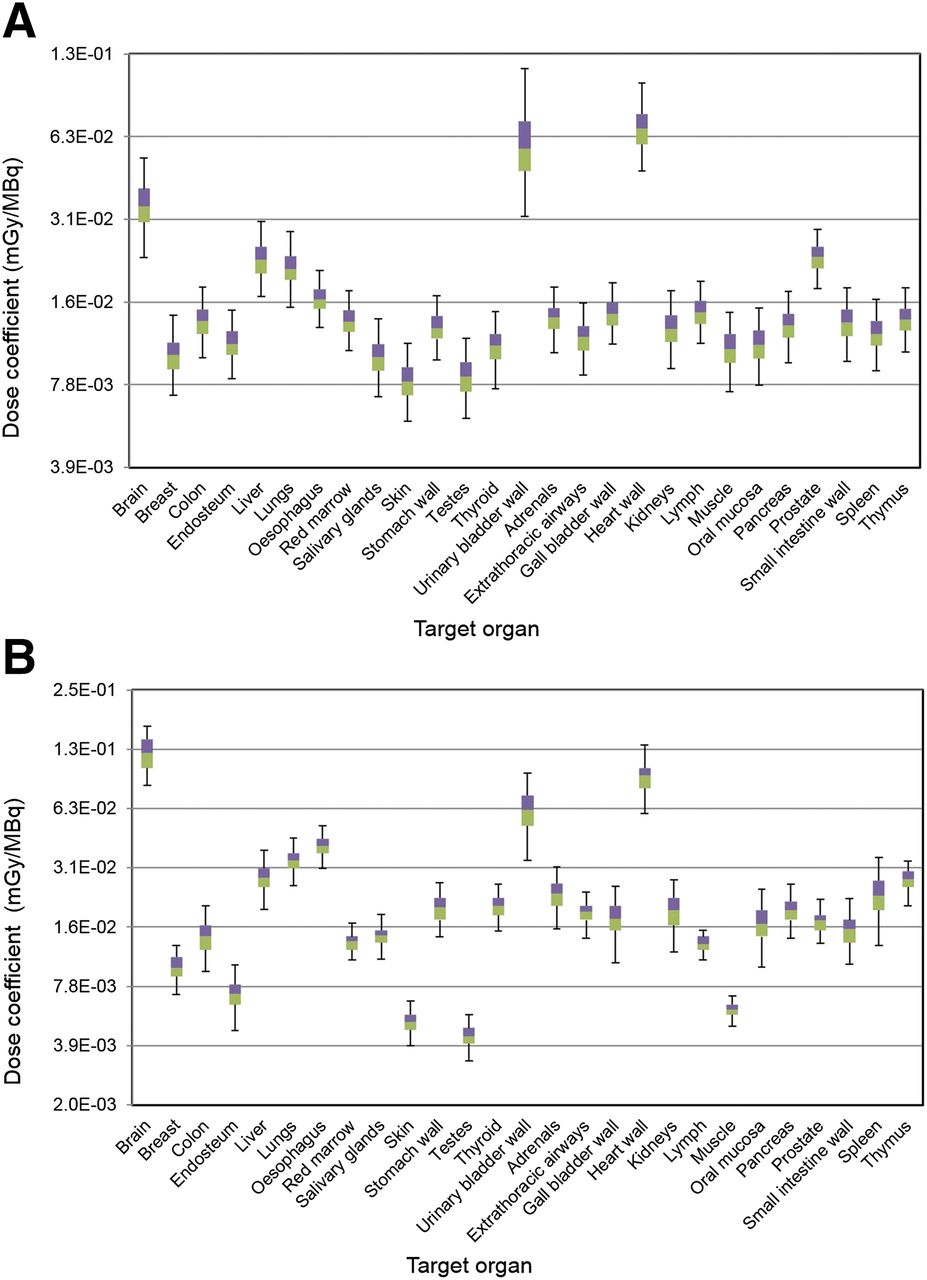
Dose coefficient for 18F-FDG, according to ICRP schema (A) and to MIRD schema (B). GB = gallbladder; Ht = heart; R = red; SI = small intestine; UB = urinary bladder.

Dose coefficient for 99mTc-pertechnetate (A), 99mTc-phosphonate (B), and 99mTc-sestamibi (C), according to ICRP schema. GB = gallbladder; Ht = heart; R = red; SI = small intestine; UB = urinary bladder.

Dose coefficient for 99mTc-tetrofosmin (A) and 99mTc-MAA (B), according to ICRP schema. GB = gallbladder; Ht = heart; R = red; SI = small intestine; UB = urinary bladder.

Dose coefficient for 201Tl-chloride, according to ICRP schema. GB = gallbladder; Ht = heart; R = red; SI = small intestine; UB = urinary bladder.
For 18F-FDG, the uncertainty of the dose coefficients, according to the MIRD calculation, varies from 1.2 to 1.7; the large coefficient of variation of the S value (liver to urinary bladder wall, 29%) leads to the larger UF in the urinary bladder wall of 1.9. According to the ICRP calculation, the UF ranges from 1.1 to 1.9, especially for the brain, with a greater UF of 1.5, and the urinary bladder wall, with a UF of 1.9. For 99mTc-pertechnetate, the UF varies from 1.1 to 1.5 and for 99mTc-phosphonate from 1.2 to 2.4; the large UF of 2.4 in the brain with 99mTc-phosphonate is due to the large geometric SD of the S values of bone to brain (2.9) and urinary bladder contents to brain (2.4). The UFs for 99mTc-sestamibi are from 1.1 to 1.6, and for 99mTc-tetrofosmin from 1.1 to 1.7. For 99mTc-MAA, the UF varies from 1.2 to 2.4, particularly for thymus, with a greater UF of 2.4; the large UF of 2.4 in the thymus with 99mTc-MAA is due to the large coefficient of variation of the S values of liver to thymus (25%) and kidney to thymus (28%). Finally, the UF of 201Tl-chloride varies from 1.3 to 3.3, with greater uncertainties for lungs (UF = 2.8) and kidneys (UF = 3.3); the very large UF of 3.3 in the kidneys with 201Tl-chloride is due to the large geometric SD of the S values of bone to kidney (2.9) and kidney to kidney (3.2), respectively.
The uncertainties of effective dose coefficients are presented in Figure 6. The UF varies from 1.1 (99mTc-sestamibi) to 1.4 (201Tl-chloride). For comparison, the dose coefficients and deviations of 18F-FDG between the 2 different types of phantoms are shown in Table 2.
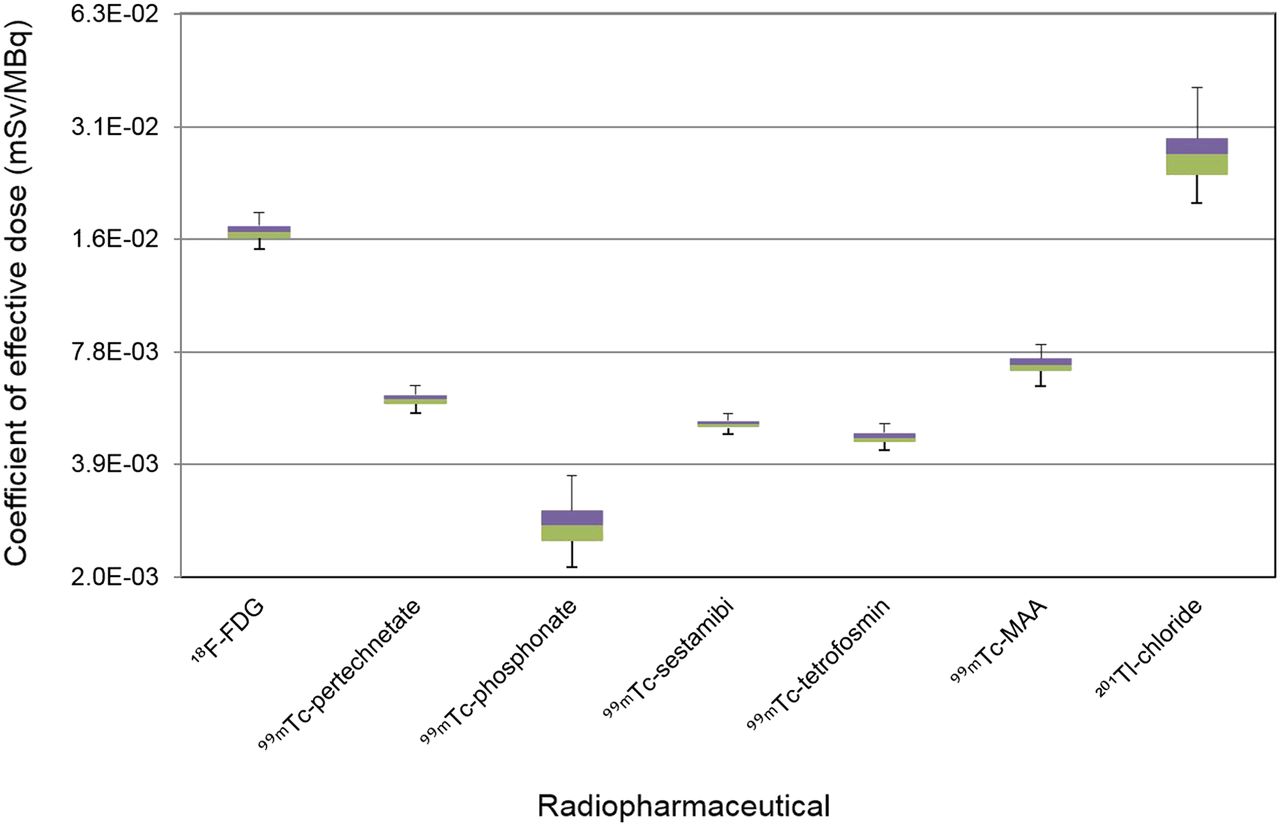
Effective dose coefficients, according to ICRP schema.
DISCUSSION
The uncertainties in the absorbed dose can mainly be attributed to the uncertainties in the time-integrated activity, which is associated with the pharmacokinetic model parameters, and the uncertainties of the S values, which were derived from the voxel phantoms. For model parameters, because there was insufficient information on which to base an estimate of the uncertainty, we assumed a coefficient of variation of 20%. The mean energy of electrons was used in the calculation of the S values from the SAF values.
The mean values of the dose coefficients calculated in the present work were compared with the values reported by other investigators to show the development of the internal dose calculation and the advanced imaging technology in nuclear medicine.
For 18F-FDG, dose coefficients were reported by the ICRP (1,11,12), MIRD Committee (22), and many other groups (23–29). A strong variation of absorbed doses in some target organs was shown. For example, for the lungs our calculated value of 0.0208 mGy MBq−1 was compared with 0.0046 mGy MBq−1 reported by Khamwan et al. (29) and 0.094 mGy MBq−1 by Mejia et al. (23); for the spleen, our value of 0.0122 mGy MBq−1 was compared with the value of 0.05 mGy MBq−1 by Reivich et al. (25) and 0.04 mGy MBq−1 by Jones et al. (26). A greater variation was also found in the comparison of skin between our calculated mean value of 0.00813 mGy MBq−1 and the reported value of 0.0011 mGy MBq−1, and between our calculated mean value of 0.01 mGy MBq−1 for breast and the reported value of 0.0733 mGy MBq−1 (29). For the remaining target organs, all reference values were within or close to our calculated uncertainty range.
The dose coefficient uncertainties of 99mTc-pertechnetate and 99mTc-MAA were also compared with the values reported by ICRP (1,11). For 99mTc-pertechnetate, the reported values for breast, liver, lungs, kidneys, spleen, and thymus were within our calculated uncertainty range. For all other target organs, there was a greater deviation of the reported values from our calculated dose coefficient values.
For 99mTc-phosphonates, except for red bone marrow, testes, and kidneys, other organ dose coefficients reported by ICRP (1,11) and Subramanian et al. (30) were within our calculated uncertainty range. For 99mTc-sestamibi, only the values of the gallbladder wall reported by ICRP (11), Higley et al. (31), and Wackers et al. (32) were in our calculated uncertainty range. Dose coefficients for breast, liver, red bone marrow, stomach wall, and thymus were in good agreement with values reported by Wackers et al. (32). For the remaining target organs, there were greater deviations between the reported values and our calculated uncertainty ranges.
For 99mTc-tetrofosmin, absorbed dose coefficients reported by the ICRP (11) and Higley et al. (31) were comparable to our calculated values; however, there was greater deviation for brain and breast. The absorbed dose coefficients reported for the liver, spleen, thymus, and red marrow were in the range of the present calculated uncertainty.
For 201Tl-chloride, absorbed dose coefficients reported by the ICRP (1,11,12) and by other groups such as Thomas et al. (33), Castronovo et al. (34), Krahwinkel et al. (35), and Higley et al. (31) were compared with our calculated values. The coefficients for organs of red marrow, kidneys, small intestine wall, and spleen in the study by Krahwinkel et al. (35) are consistent with our calculated values. For other organs, values reported by Krahwinkel et al. (35) are lower than the range of calculated uncertainty, and the values reported by other investigators (1,11,12,33–35) are greater.
The absorbed dose coefficients reported by ICRP are often not in the calculated uncertainty range. This is because the ICRP used the S values, which were derived from the mathematic phantom. These S values often differ greatly from those used in the present calculation. The influence of the S values on the absorbed dose of 18F-FDG was shown in Table 1. The significant difference was found in urinary bladder contents. In the mathematic phantom, the SAFs for electrons were not explicitly simulated but approximated according to Equation 8. Zankl et al. (17) showed that, using different mathematic and voxel phantoms, the difference in the dose calculation can be greater than 150%.
The reference effective dose coefficients reported by ICRP (1,11,12) were compared with our calculated values. With the exception of 18F-FDG, all ICRP reference values were higher than the calculated values and lay outside the uncertainty range. The uncertainty of tissue-weighting factor was not considered as calculating the uncertainty of effective dose coefficients. However, an example of calculation using tissue-weighting factors with a coefficient of variation of 20% showed no significant effect of uncertainty of tissue-weighting factor on uncertainty of effective dose coefficient. The coefficient of variation varied less than 1%.
In addition to the theoretic analysis, the patient counting rate in SPECT and PET are, in clinical practice, subject to a large uncertainty, and this uncertainty of counting rate propagates to the time-integrated activities and will thus affect the overall uncertainties of the dose estimates.
CONCLUSION
In the present work, a general method was developed for calculating the uncertainty of absorbed dose and effective dose coefficients of 7 radiopharmaceuticals commonly used in nuclear medicine. The uncertainties for organ-absorbed doses were in the range of 1.1–3.3 and for effective dose in the range of 1.1–1.4. The urinary bladder wall is the tissue that most commonly shows the highest degree of uncertainty. Furthermore, the uncertainty information can further be used in the sensitivity analysis to identify the most influential model parameter so that scientific efforts can be invested for updating the pharmacokinetic models and consequently reducing the uncertainty of absorbed dose.
DISCLOSURE
The costs of publication of this article were defrayed in part by the payment of page charges. Therefore, and solely to indicate this fact, this article is hereby marked “advertisement” in accordance with 18 USC section 1734. This work was financially supported by the German Federal Ministry for the Environment, Nature Conservation, Building and Nuclear Safety (BMUB) under the contract no. 3612S20013. No other potential conflict of interest relevant to this article was reported.
Acknowledgments
We thank Randolph Caldwell for the English improvement of the manuscript.
Footnotes
Published online Nov. 12, 2015.
- © 2016 by the Society of Nuclear Medicine and Molecular Imaging, Inc.
REFERENCES
- Received for publication May 11, 2015.
- Accepted for publication October 22, 2015.


Jump to section
Related Articles
Cited By...
- No citing articles found.