


Abstract
With an increasing emphasis on quantitation of SPECT imaging and its use in dosimetry to guide therapies, it is desirable to understand the repeatability in normal-organ SPECT uptake values (SPECT-UVs). We investigated the variability of normal abdominal organ uptake in repeated 111In-pentetreotide SPECT studies. Methods: Nine patients with multiple 111In-pentetreotide SPECT/CT studies for clinical purposes were evaluated. Volumes of interest were drawn for the abdominal organs and applied to SPECT-UVs. The variability of those values was assessed. Results: The average SPECT-UV for the liver (1.7 ± 0.6) was much lower than for the kidneys (right, 8.0 ± 2.4; left, 7.5 ± 1.7). Interpatient and intrapatient variability was similar (intraclass correlation coefficients, 0.40–0.59) for all organs. The average coefficients of variation for each organ for each patient were obtained and averaged across all patients (0.26 for liver, 0.22 for right kidney, and 0.20 for left kidney). The coefficients of variation for the organs across all scans were 0.33 (liver), 0.30 (right kidney), and 0.22 (left kidney). Conclusion: Variability across all patients and all scans for the liver was higher than reported with 18F-FDG PET, though left kidney variability was similar to PET liver variability and left kidney uptake may be able to serve as an internal metric for determining the quantifiability of an 111In-pentetreotide SPECT study.
SPECT has come to play an important role in the evaluation of numerous medical conditions, oncologic disease states, and normal physiology and can be used in place of or addition to planar imaging as a problem-solving tool. SPECT can better characterize findings and can detect additional lesions not seen on planar imaging by combining the functional information from single-photon imaging with the anatomic information from CT in 3 dimensions (1,2). The combination of SPECT and CT (SPECT/CT) allows us to further refine the anatomic and diagnostic specificity of SPECT and provide attenuation correction to improve quantitative accuracy.
An important aspect of oncology imaging is assessing tumor response or progression before and while the patient is undergoing therapy. An emerging role of SPECT is quantifying in absolute terms the uptake of radiotracers in normal tissues and tumors to help guide radiopharmaceutical therapies. Although this can be performed qualitatively, it may be desirable to perform these functions in a strictly quantitative sense.
Quantitation has already become widely accepted for both anatomic imaging (Response Criteria in Solid Tumors (3)) and PET (PET response criteria in solid tumors [PERCIST] (4)). Quantitation of treatment response by SPECT and dosimetry will likely grow in importance as tumor-specific tracers for diagnosis and radiopharmaceutical treatment are increasingly applied in practice.
SPECT remains widely thought of as an intrinsically nonquantitative or semiquantitative modality (5). However, in addition to the ability of SPECT/CT systems to perform attenuation compensation, methods that compensate for scatter and the collimator-detector response (i.e., the distance-dependent blurring due to the finite acceptance angle of collimator holes and the detector intrinsic resolution) have been developed (6–12). On the basis of these developments, several groups have reported quantitative approaches to many commonly imaged SPECT radionuclides relevant to cancer imaging including 111In (10) and 99mTc (13).
Measurements of tumor uptake values above diagnostic thresholds from a single image or measurements of changes in tumor uptake in sequential images to assess response are only meaningful to the extent that they are larger than the intrinsic variability of the measurement. Similarly, the reliability of the prediction of the radiation-absorbed dose from a therapeutic administration of a radiopharmaceutical to tumor or normal organs from the SPECT/CT distribution of a diagnostic administration depends on the reliability of the SPECT/CT measurement. An important component of this reliability is the intrinsic variability in the estimate of in vivo activity distributions as measured by SPECT/CT. The goal of this work was to provide an initial characterization of the variability of normal abdominal organ uptake in patients undergoing multiple 111In-pentetreotide (OctreoScan; Mallinckrodt Pharmaceuticals) SPECT/CT examinations.
MATERIALS AND METHODS
This retrospective study was approved by the Institutional Review Board at our hospital. Chart review was used to select 9 patients who had between two and three 111In-pentetreotide SPECT/CT studies. Each patient had a history of neuroendocrine or carcinoid tumor, and the studies had been clinically indicated for monitoring for disease progression or response to therapy. Table 1 presents selected demographic and clinical information for each patient.
Selected Demographic and Clinical Information for Patients Included in This Study
Images were acquired on a Precedence 16-slice SPECT/CT scanner (Philips) nominally 24 h after intravenous injection of 229 ± 19 MBq (6.2 ± 0.5 mCi) of 111In-pentetreotide. The acquisitions were performed with two 20%-wide energy windows centered at 171 and 245 keV. The duration of SPECT acquisitions was 48 min, and projections were acquired into 128 × 128 matrices with a pixel size of 0.466 cm at 128 projections over 360°. The images were reconstructed using 3 iterations of 16 subsets of an ordered-subset expectation maximization algorithm. The reconstructions included Philips’ clinical attenuation correction and model-based scatter compensations. After reconstruction, the images were filtered with a fifth order 3-dimensional Butterworth filter with a cutoff frequency of 0.65 cycles per pixel. CT images were obtained using standard clinical parameters for noncontrast CT scans, typically 120 kVp, 80–160 mA (weight-dependent), gantry rotation speed of 0.5 s, and pitch of 0.9.
Volumes of interest (VOIs) were drawn on a commercial workstation (Mirada Medical) encompassing the liver and kidneys in each patient on the basis of visual estimates of the organ edges in the SPECT images. The CT images were available for localization and determination of any relevant postoperative changes, but the CT images were not otherwise used in determining the VOIs. Because multiple patients were postsplenectomy (Table 1), an analysis of the spleen was not performed.
The SPECT-UVs were calculated using: Eq. 1where Countsorgan (c/cc) are the measured average counts per cc inside the organ VOI; Fcalib (cps/Bq) is the calibration factor to convert the counts in the VOI to activity; timeacquisition (s) is the duration of the acquisition; Activitydc (Bq) is the total radiotracer activity injected into the patient (dc: decay corrected to the time of acquisition); and Weightpatient (g) is the weight of the patient in grams, used here to estimate the volume, assuming the average density of the patient as 1 g/cc.
Fcalib was calculated using SPECT data from a cylinder (diameter, 23 cm; height, 27.4 cm) filled with a solution containing 365.2 MBq (9.89 mCi) of 111In. Image acquisition and reconstruction parameters were the same as those used for the patients. The total of the counts in the reconstructed image of the phantom was determined inside a VOI defined manually to include all counts in the phantom. This larger VOI was used to reduce the impact of partial-volume effects. The value of Fcalib was calculated as the total measured counts in the image of the cylinder divided by the product of the known activity and the total acquisition duration. We compared the calibration factor determined this way to one measured using a sphere in a cylinder and a syringe in air and found the difference to be less than 1%.
From the multiple measures of SPECT-UV over time within a subject, intraclass correlation coefficients (ICCs (14)) and coefficients of variation (COVs) across scans for the same patient and across all scans from all patients were calculated.
RESULTS
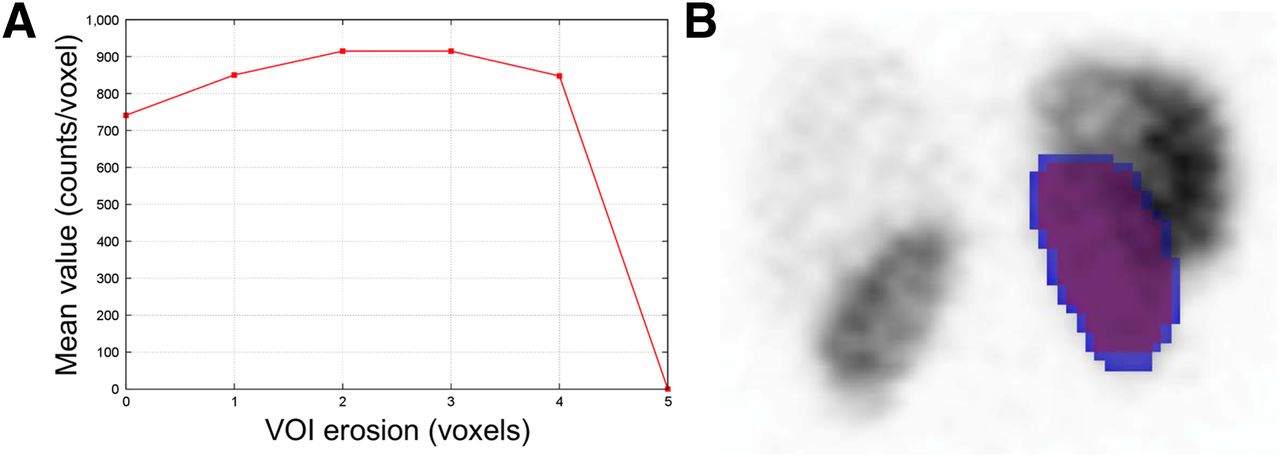
The VOIs were noted to have gradually decreasing uptake along the organ peripheries, likely due to edge partial-volume effects. Thus, the organ VOIs were peripherally eroded by increments of 1 voxel until a peak in the average organ uptake was reached. The uptake at the peak was used as it was less influenced by edge partial-volume effects. For the liver, a peripheral erosion of 3 voxels was used. Figure 1 shows a representative example of the original and eroded whole-organ liver VOIs. In the case of the kidneys, the used erosion was 1 voxel (Fig. 2).
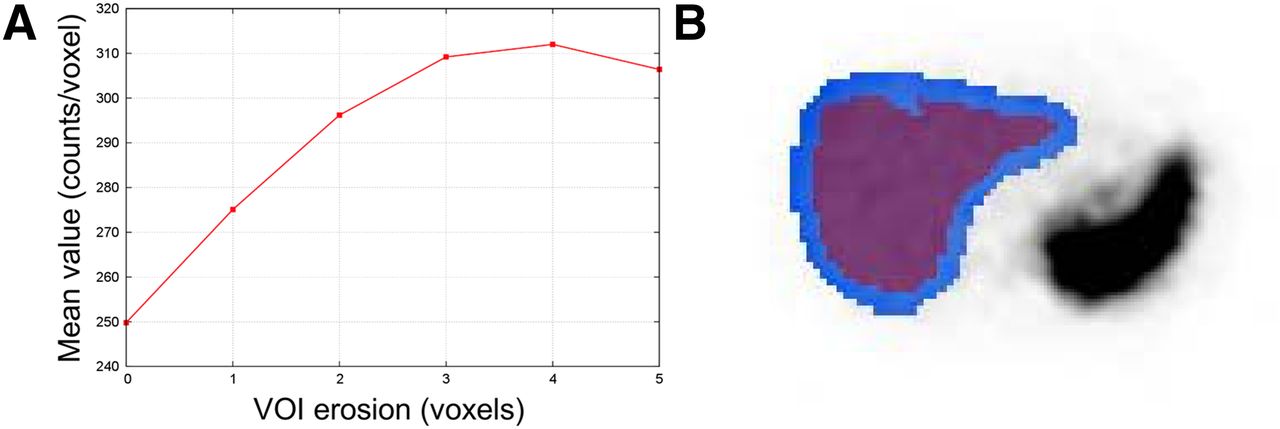
Average counts per voxel as function of number of voxels peripherally eroded from representative liver VOI (A), with uneroded VOI (blue) and 3-voxel eroded VOI (purple) shown overlying axial SPECT image (B).

Average counts per voxel as function of number of voxels peripherally eroded from example left kidney VOI (A), with uneroded VOI (blue) and 1-voxel eroded VOI (purple) shown overlying coronal SPECT image (B).
In 3 of the patients in this study with pancreatic neuroendocrine tumors, metastatic disease to the liver developed. In 1 of these patients, uptake to the liver was diffusely increased (MR imaging demonstrated diffuse metastatic disease to the liver parenchyma). The liver from that scan was excluded from analysis. For the other 2 patients, discrete lesions with increased radiotracer uptake were visually apparent, and the VOIs were defined to exclude the tumors.
The average SPECT-UVs for the liver, left kidney, and right kidney from each scan are displayed in Figure 3. The average SPECT-UVs and their 95% confidence intervals were calculated for the eroded VOIs for the liver, left kidney, and right kidney and were compiled across all studies (Table 2). As expected from visual assessments, there was high renal parenchymal uptake of 111In-pentetreotide. The mean ± SD SPECT-UVs were 7.5 ± 1.7 (range, 4.8–9.4) for the left kidney and 8.0 ± 2.4 (range, 3.8–10.2) for the right kidney. These values were much higher than the corresponding SPECT-UVs for the liver (1.7 ± 0.6 [range, 0.8–2.6]). The average SPECT-UVs for the left and right kidneys were similar, implying a high degree of spatial reliability within the reconstructed images.
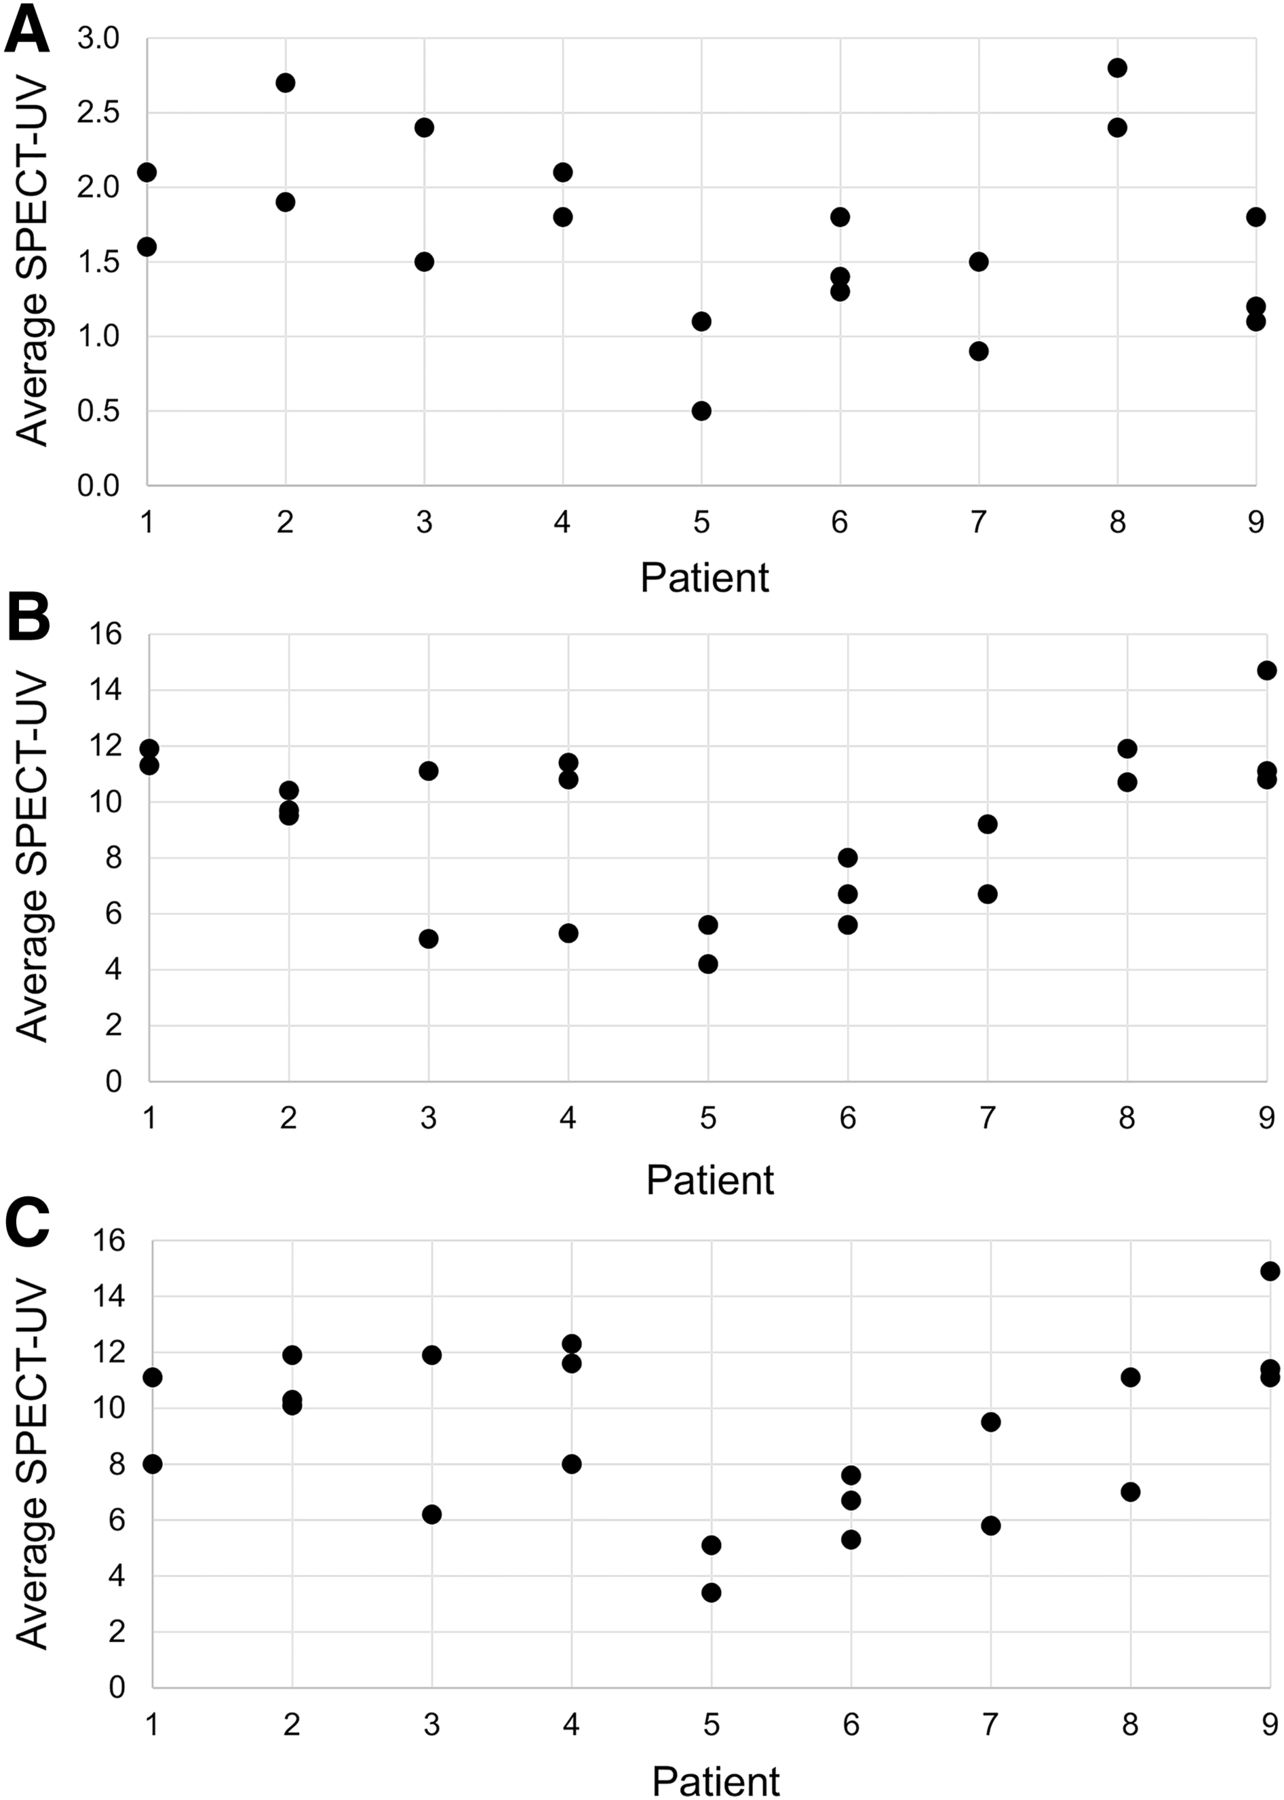
Distribution of average SPECT-UVs for liver (A), left kidney (B), and right kidney (C) in each patient.
Average SPECT-UV, ICCs, and COVs for Each Patient Averaged Over All Patients, and COVs Across All Scans for Liver, Left Kidney, and Right Kidney
The ICCs and COVs of the eroded whole-organ volumes are also included in Table 2. Of note, the ICCs were all in a relatively narrow range around 0.5, indicating nearly equal intrapatient and interpatient variability. The COVs for the organ VOIs on an intrapatient basis—that is, the COV for each patient averaged across all patients—revealed a trend toward higher variability in the liver than the kidneys (0.26 ± 0.14 [range, 0.11, 0.55] for the liver, 0.20 ± 0.07 [range, 0.07–0.31] for the left kidney, and 0.22 ± 0.09 [range, 0.03–0.33] for the right kidney). When the COVs were calculated on an interpatient basis across all patients, variability in the liver (0.33) and right kidney (0.30) was higher than in the left kidney (0.22).
DISCUSSION
It is important to define the ability of SPECT to function as a quantitative modality to most effectively monitor the disease status and response to therapy of oncology patients. Predicting the radiation-absorbed dose of a therapeutic radiopharmaceutical from diagnostic and posttreatment SPECT images is of growing importance. Many tumors remain uniquely evaluable by SPECT radiotracers, and SPECT agents are often used in organ dosimetry.
An in-depth understanding of the uptake parameters of the radiotracers used in SPECT, such as intrinsic organ uptake variability, is needed to fully implement quantitative SPECT evaluation of tumors and their response to therapy. Normal-organ radiotracer accumulation as a tool to calculate the radiation-absorbed dose is also important. In this work, we have demonstrated that the variability in normal-organ uptake across all scans from all patients appears greater than the comparable variability in PET (COV of 0.33 for the liver SPECT-UV vs. 0.21 for 18F-FDG PET (15)). However, the overall variability of uptake in the left kidney in this study (COV, 0.22) was actually quite similar to the reported 18F-FDG PET liver variability.
Uptake in the liver was chosen as the basis of whether a PET study could be reliably quantified given its moderate parenchymal 18F-FDG uptake and the low variability of that uptake across sequential scans. In the context of 111In-pentetreotide, the left kidney may provide a measure of the suitability for quantitation (quantifiability) of a study in a manner similar to the liver in sequential 18F-FDG PET studies as assessed by PERCIST 1.0. The seemingly lower variability of the left kidney in comparison to the right (COV, 0.30) may be caused by crosstalk between activity estimates in the liver and left kidney due to partial-volume effects.
Patient-specific and scan-specific sources of variability were nearly equal (ICCs, 0.40–0.59). These findings suggest that scan-specific normal-organ uptake parameters may be desirable for assessing the quantifiability of normal tissue and tumor uptake values.
We encountered 2 technical limitations in the process of calculating the SPECT-UVs: patient weights were not consistently recorded at the time of imaging, and exact injection times were not available in the medical record for some scans. We thus estimated some patient weights from chart review and some acquisition start times based on the scheduled study start time. In the case of 111In (half-life, 2.80 d), errors due to start time discrepancies would be small. As quantitative SPECT becomes clinically more accepted, stricter imaging protocols and data recording standards will be necessary.
One source of variability in the measurements is camera variations in camera sensitivity over time. However, recent data indicate that camera variability over time is less than 1% (16,17).
CONCLUSION
In patients with repeated 111In-pentetreotide SPECT studies, left kidney SPECT-UV variability was similar to liver SUV variability previously described with 18F-FDG PET. This similarity suggests that left kidney uptake measurements may serve as an internal metric for determining the quantifiability of an 111In-pentetreotide SPECT scan.
DISCLOSURE
The costs of publication of this article were defrayed in part by the payment of page charges. Therefore, and solely to indicate this fact, this article is hereby marked “advertisement” in accordance with 18 USC section 1734. Funding for this study was provided by National Institutes of Health grants U01 CA140204, T32-EB010021-05, T32 EB006351, and R01 CA109234. No other potential conflict of interest relevant to this article was reported.
Acknowledgments
We thank Judy Buchanan for editorial assistance.
Footnotes
↵* Contributed equally to this work.
Published online May 14, 2015.
- © 2015 by the Society of Nuclear Medicine and Molecular Imaging, Inc.
REFERENCES
- Received for publication February 3, 2015.
- Accepted for publication April 15, 2015.


